Fire Risk Map
3. Perform Analyses
3.2. Slope
With the Elevation layer we made earlier, it’s time to create a slope map. The slope map is important, because fire is more likely to occur on steep slopes. This is because rainwater runs off hills quicker when the slope is steeper, causing these areas to be dry. The steep slope also makes fire spread more quickly upwards, because when a slope is steeper, heat from the fire reaches the vegetation above it more easily, causing ignition to happen quicker. This also means that it will spread slower in flatter areas. Therefore, we will now calculate the slope based on the Elevation layer. To do this we will use the Slope tool from the Processing Toolbox. The Slope tool calculates the percentages between the height values of the raster cells. A cell of 1 meter and 5 meters next to each other will create a higher value than a cell of 1 meter and 2 meters.
Calculate Slope from Elevation
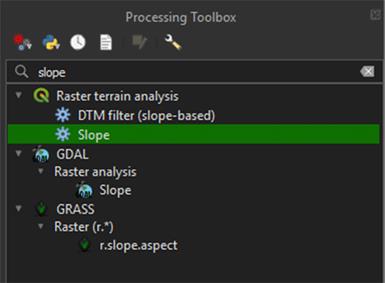
1. Go to the Processing Toolbox and search for Slope under Raster terrain analysis. Double click to open the tool.
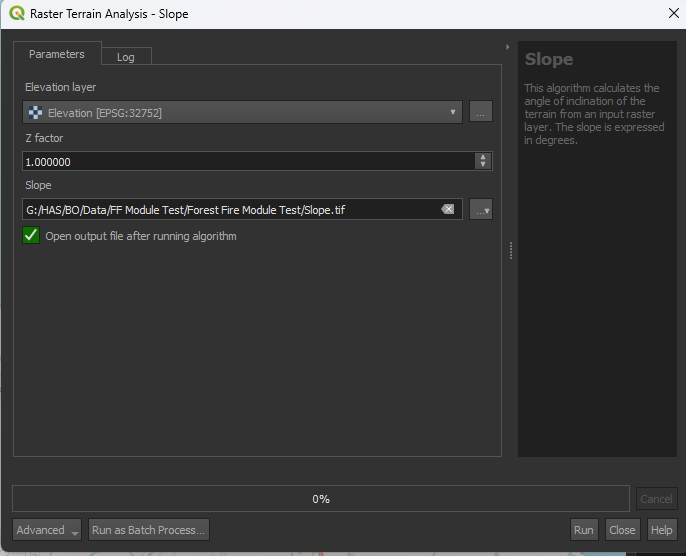
2. In the Slope window, under Elevation layer, select the Elevation layer we downloaded earlier.
3. Under Slope, press the arrow button > Save to File… and name the layer Slope.
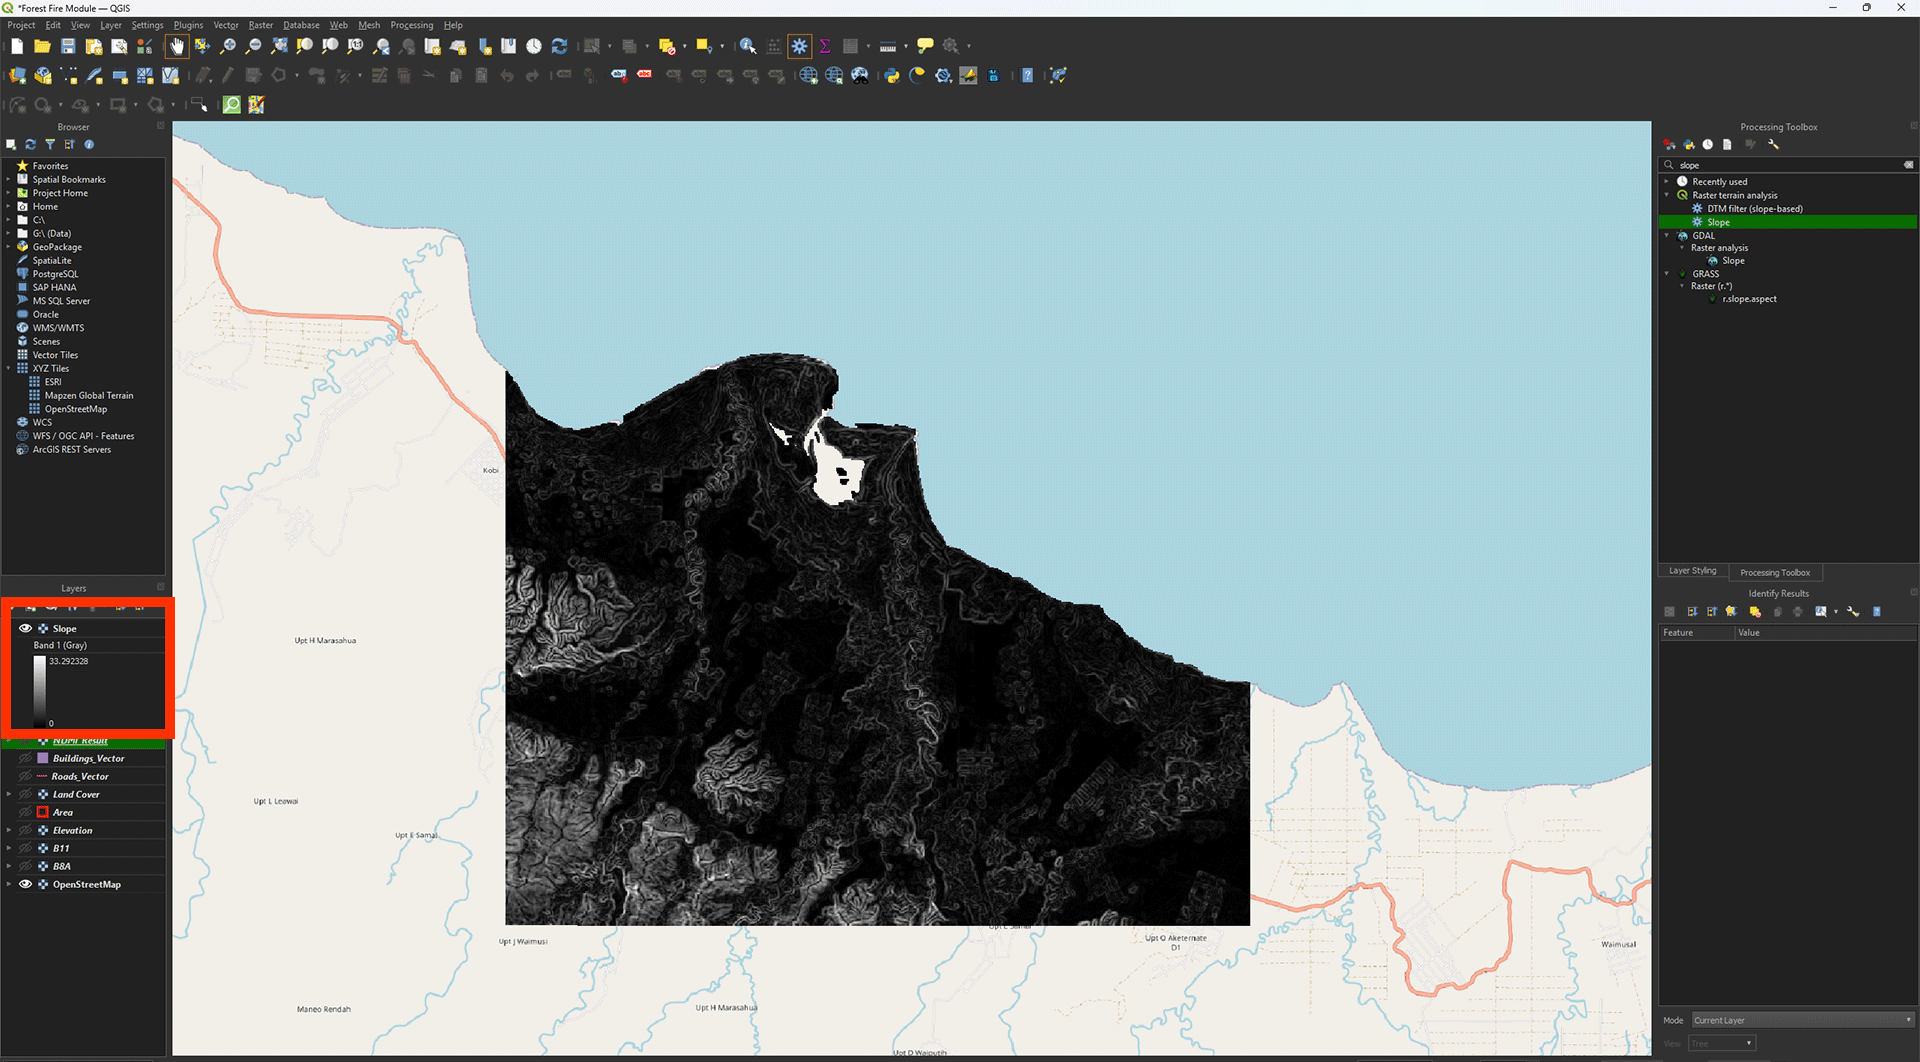
4. Run the tool. Your Slope layer should appear in the layers panel.
This map is still a bit hard to read, but you can see the slope variations in the landscape. The light colours are very steep, while the dark colours are flatter. In our study area, most flat areas are located on the coast, while the higher and sloped areas are more land inwards. The result is shown in degrees, so our maximum is around 33 degrees.
Note: Again, the value may differ slightly depending on your study area's size.
A strange side effect of doing a Slope analysis, is that it will cut the data from the ocean out. This missing data will unfortunately break the Weighted Overlay analysis that we will perform later. This means we have to fill in this missing data ourselves.
Filling No Data
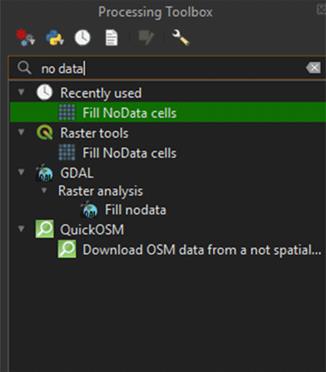
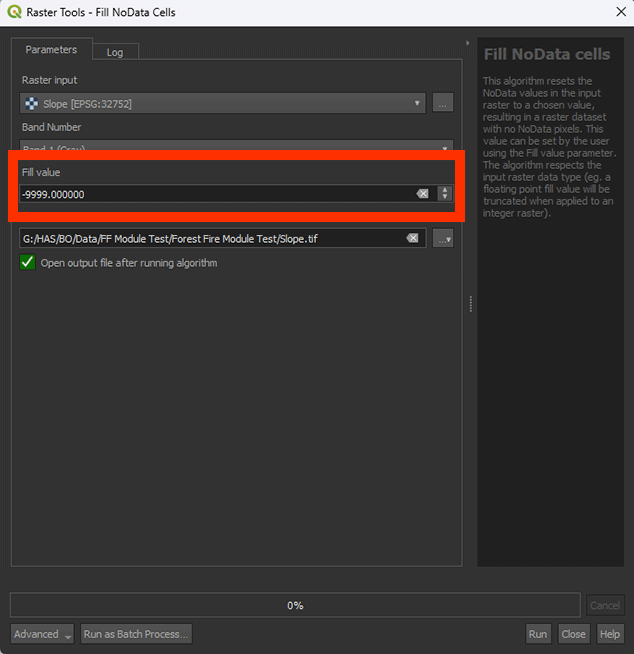
1. Go to the Processing Toolbox and search for Fill NoData cells under Raster tools. Double click to open the tool.
2. Make sure that the Slope layer is selected under Raster Input.
3. Set Fill value on -9999.
4. Save the Permanent layer as Slope_Fill.
5. Run the tool.
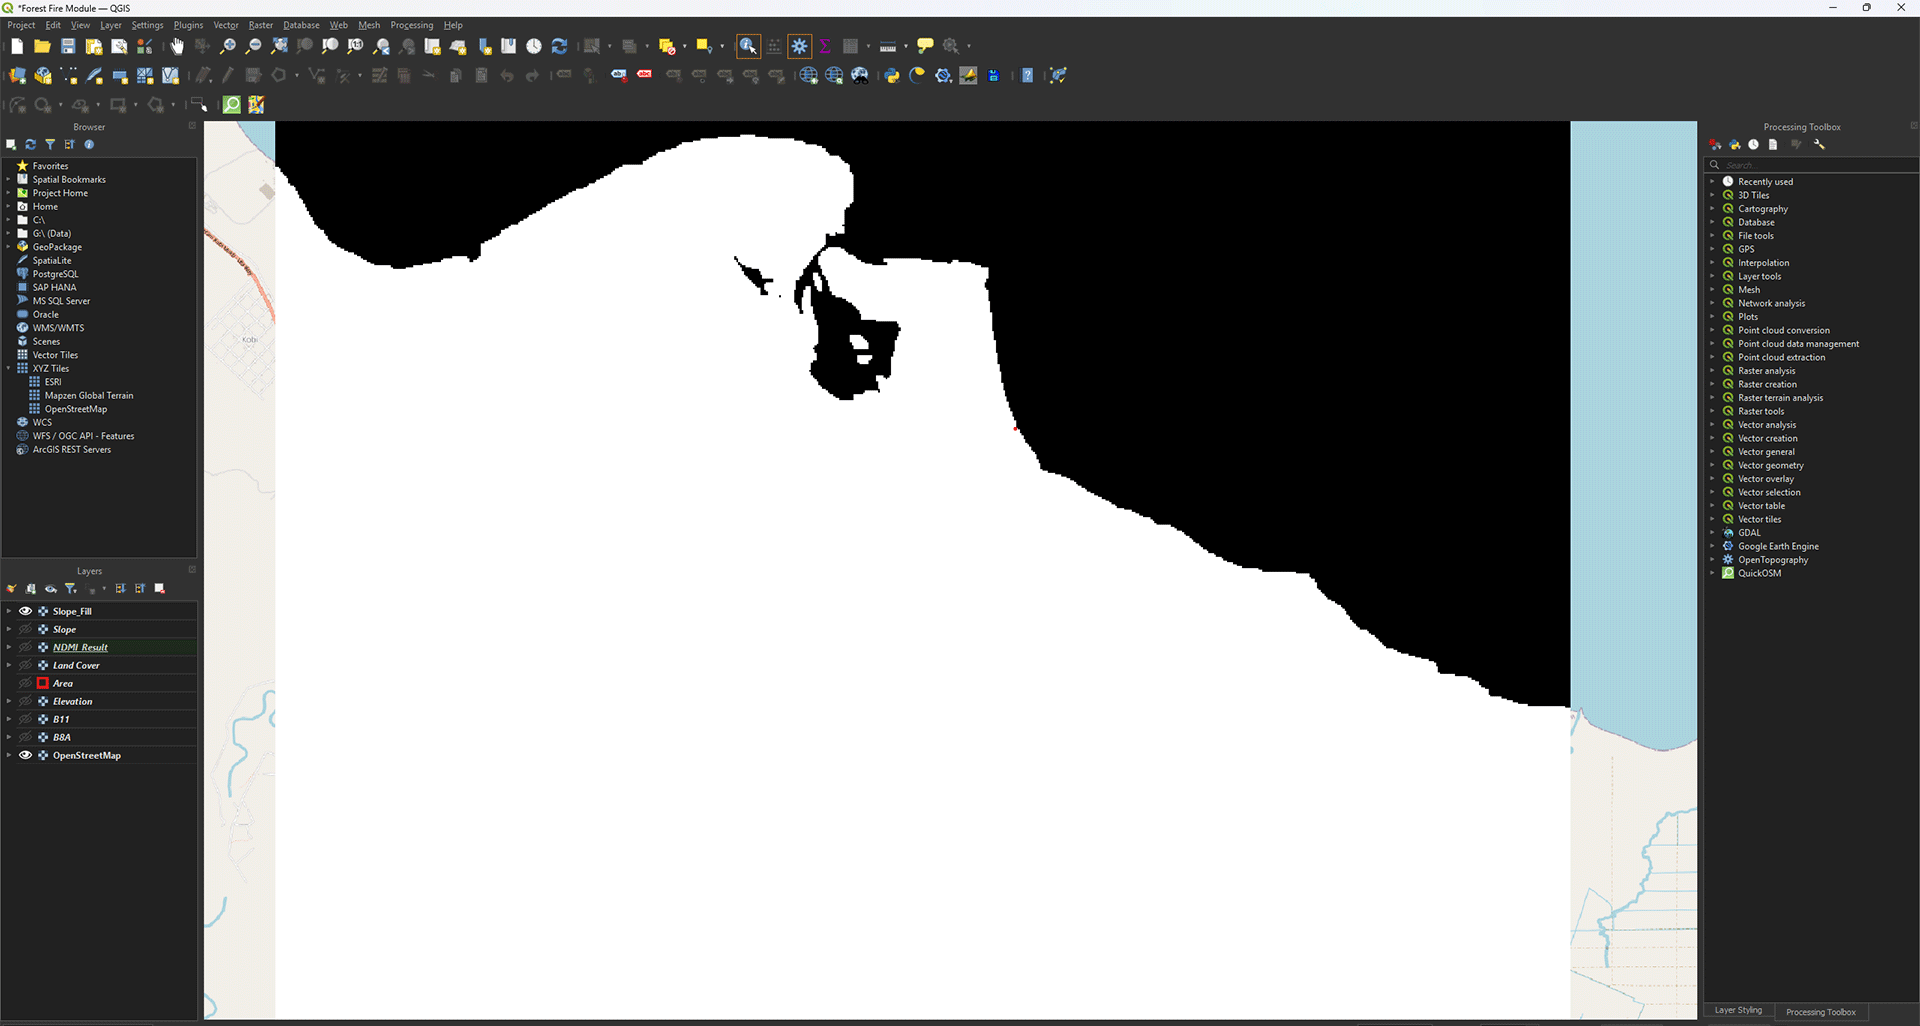
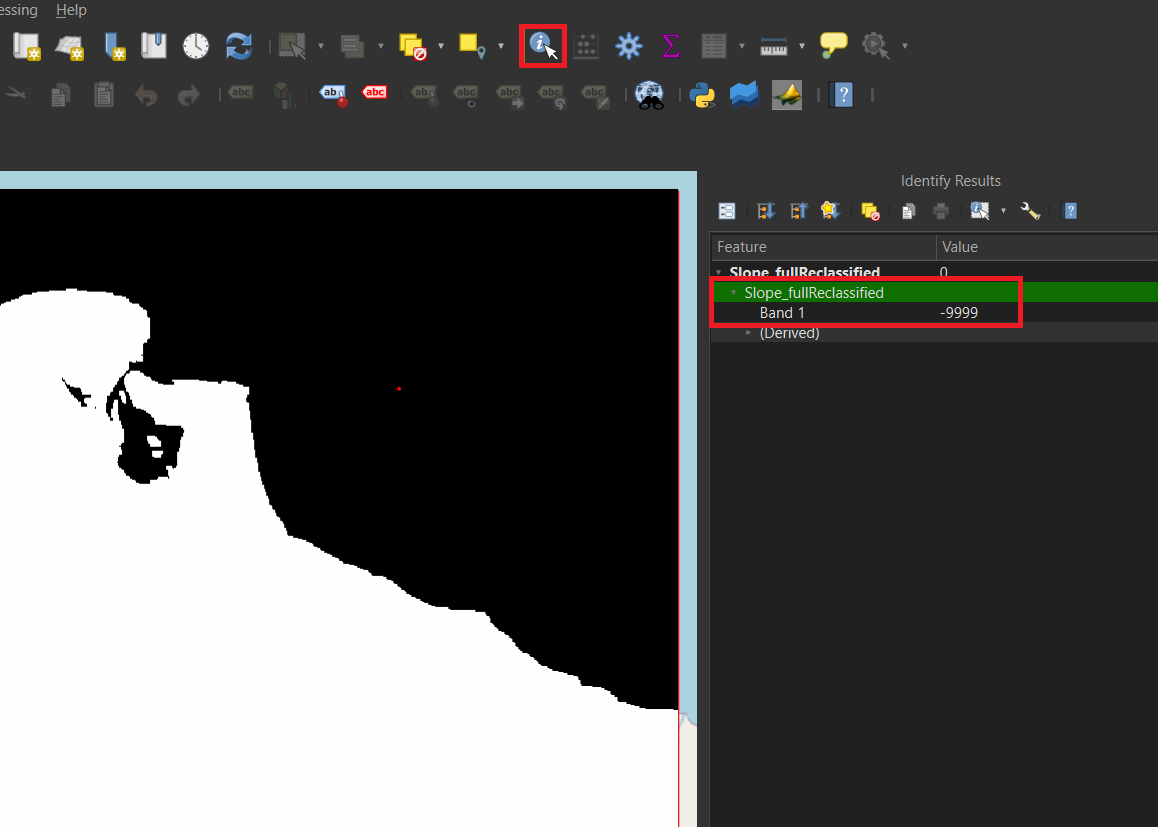
You will see your new layer appear in the Layers panel. This layer should have all the empty ocean spots filled in. You can check the values with the Identify Features button (or press ctrl + shift + i). When selected, you can click on a pixel to see what data it contains. The ocean should say -9999.
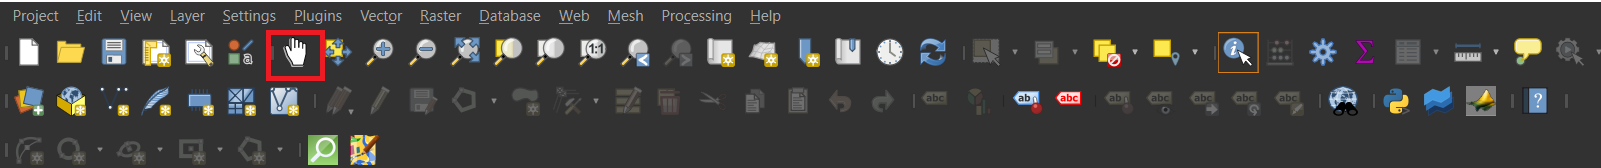
To go back to moving the map with your cursur, press the Pan Map icon
Don’t forget to save your project.