Fire Risk Map
4. Weighted Overlay Analysis
4.1. NDMI
Let’s reclassify the results from our NDMI analysis and start scoring. When we performed the NDMI analysis, we changed the symbology to 3 different classes, going from barren, low moisture, to high moisture. But by changing the symbology, we only change the visuals, not the data itself. To do a Weighted Overlay Analysis, we need to actually change the data itself. We are going to use the Reclassify tool to achieve this.
If you have any trouble with these steps, there is a guide video at the end of this chapter.
1. Go to the Processing Toolbox and search for Reclassify by table under Raster analysis. Double click to open the tool.
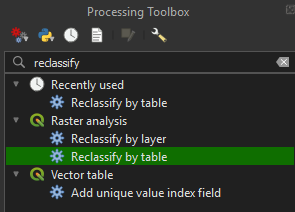
2. Under Raster layer, make sure the NDMI_Results layer is selected and click on the ‘…’ button next to Reclassification table.
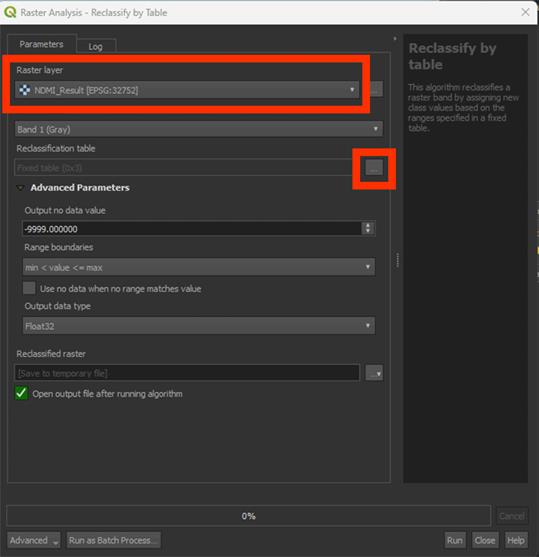
This is the place where we are going to score the factors. We will use a similar classification as we used for the Symbology earlier on. For the Reclassification, we’ll use a few extra steps to create more varied values, otherwise we get three large zones and lose detail.
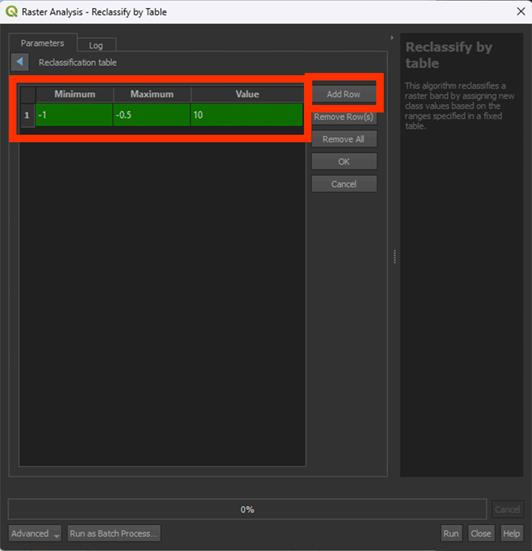
3. Click Add Row and set Minimum to -1 and Maximum to -0.5. The min and max values represent the data from the layer.
4. Under Value, give a score of 10.
This is how we are going to score. We classify the data in a few classes and then give them a score from 0 to 10. 0 being no risk (things like water may end up being something other that 0, which is a limitation of the NDMI), 10 being very high risk.
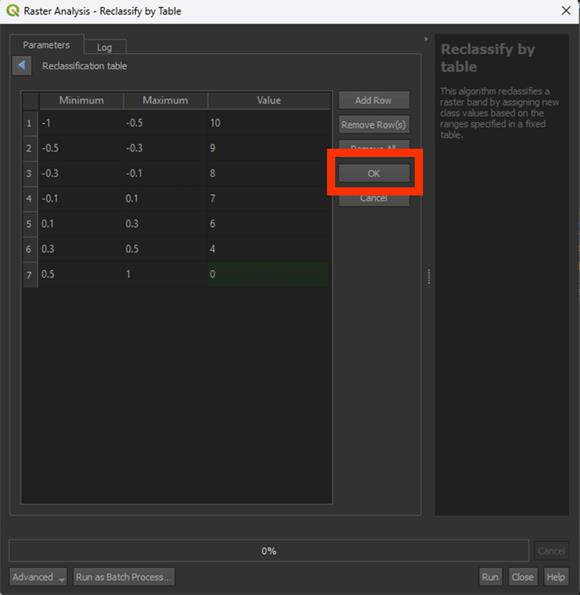
5. Set the values as shown in the table below. Make sure you use ‘.’ as decimals and not ‘,’. QGIS always works with periods, not commas.
Note: be sure to not let any rows empty, GIS does not understand this and will give you an error message. So, make sure to delete empty rows before clicking OK.
|
Minimum |
Maximum |
Value |
|
-1 |
-0.5 |
10 |
|
-0.5 |
-0.3 |
9 |
|
-0.3 |
-0.1 |
8 |
|
-0.1 |
0.1 |
7 |
|
0.1 |
0.3 |
6 |
|
0.3 |
0.5 |
4 |
|
0.5 |
1 |
0 |
As explained in the introduction, the closer the NDMI is to -1, the more heat stress the vegetation in that area experiences. This is why areas with NDMI values ranging from -0.5 to -1 are given the highest risk factor and values ranging closer to 1 create less risk.
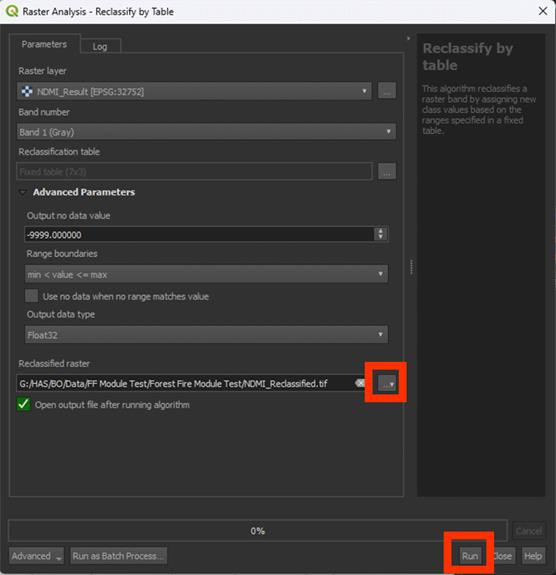
6. When finished scoring, click on OK. Do not click RUN immediately! You have to save the file first.
7. Save the Permanent layer as NDMI_Reclassified, then Run the tool.
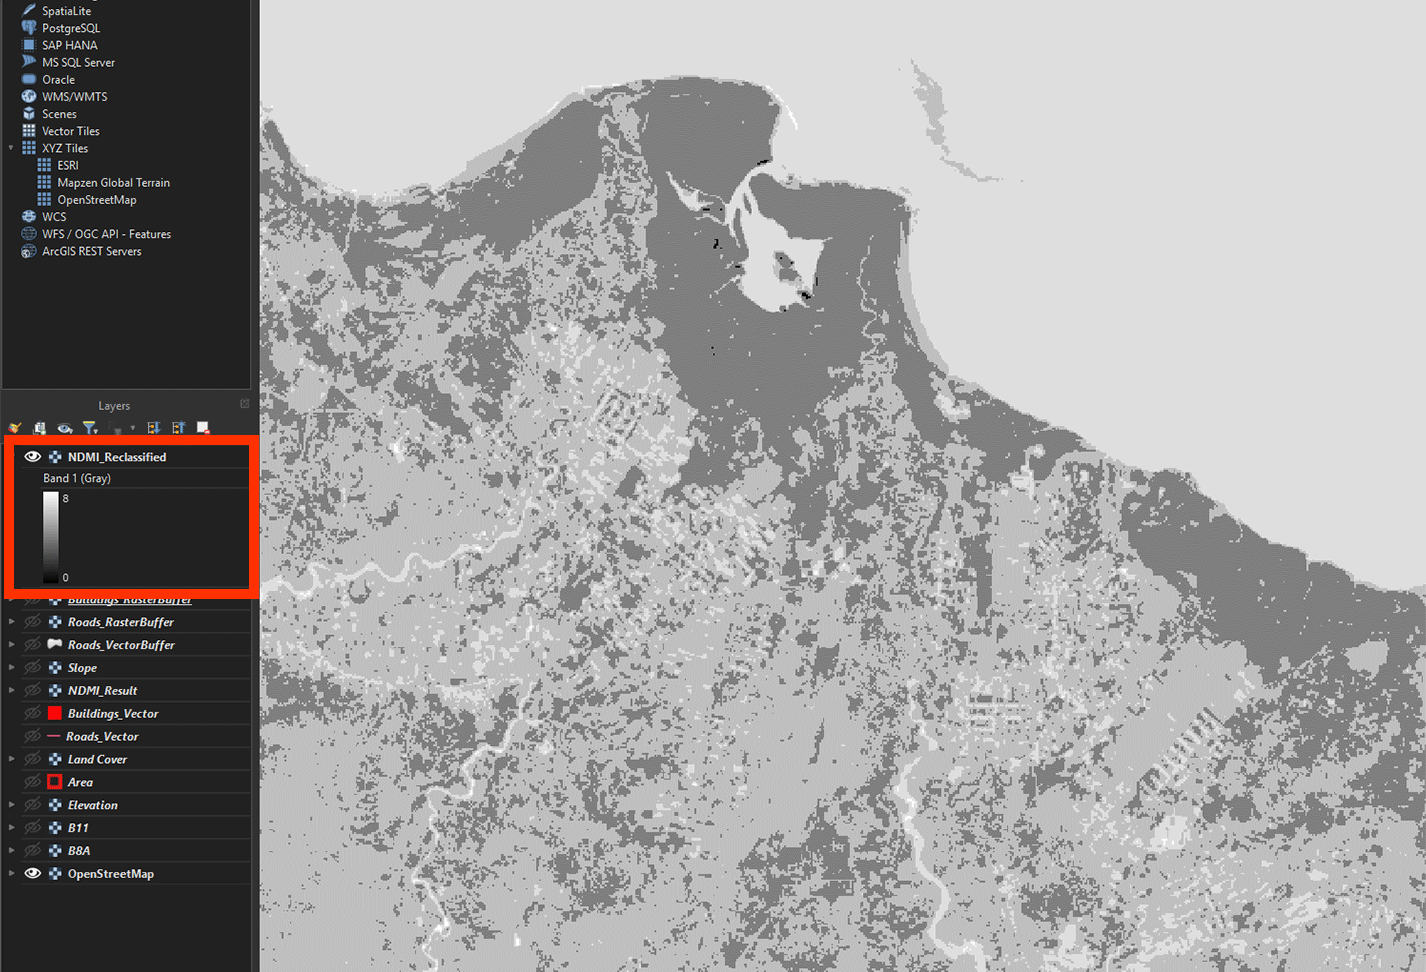
Once the reclassified layer has been created to check if it worked, zoom in. You should see different shades of grey. That means the reclassification was successful. You can check the scores using Identify Features. It should stay between 0 and 10 (in this case being 0 and 8, as there ended up being no area of a value lower than -0.3).
You've now reclassified the first layer, the NDMI layer. We will repeat this process and create the other layers as well.
Don’t forget to save your project.
You can watch these steps in this video if you are having trouble.