Fire Risk Map
4. Weighted Overlay Analysis
4.3. Land Cover
The Land Cover map is going to be a bit weird to Reclassify. It uses values to determine the land cover type. We can see it on the map with the labels (Tree cover, Cropland, etc.), but the Reclassify tool doesn’t understand that.
We can’t use the label naming of the LandCover map in the Reclassify, we need to use the values. In the Layer Styling panel, we can see the values that correspond to the labeling. In the table, you can see a nice overview for your convenience:
|
Value |
Label |
|
10 |
Tree cover |
|
20 |
Shrubland |
|
30 |
Grassland |
|
40 |
Cropland |
|
50 |
Built-up |
|
60 |
Bare/sparce vegetation |
|
70 |
Snow and ice |
|
80 |
Permanent water bodies |
|
90 |
Herbaceous wetland |
|
95 |
Mangroves |
|
100 |
Moss and lichen |
Note: Yes, there is a weird outlier with the 95 value.
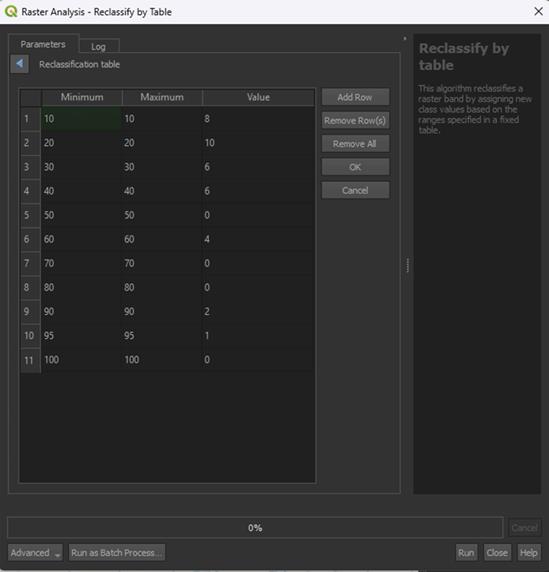
1. Open the Reclassify by table tool again and make sure the LandCover layer is selected.
2. In the table, fill in the values down below:
|
Minimum |
Maximum |
Value |
|
10 |
10 |
8 |
|
20 |
20 |
10 |
|
30 |
30 |
6 |
|
40 |
40 |
6 |
|
50 |
50 |
0 |
|
60 |
60 |
4 |
|
70 |
70 |
0 |
|
80 |
80 |
0 |
|
90 |
90 |
2 |
|
95 |
95 |
1 |
|
100 |
100 |
0 |
Note: The 0 score means that this land cover type cannot burn, like Water, or we don’t take it into the calculation, like Built-up area (we use the Buildings layer for this purpose).
We use the same value for the minimum and maximum amount, as that is how the ESA World Cover data is provided. QGIS doesn’t let us use just 1 value, so this is how we have to fill it in.
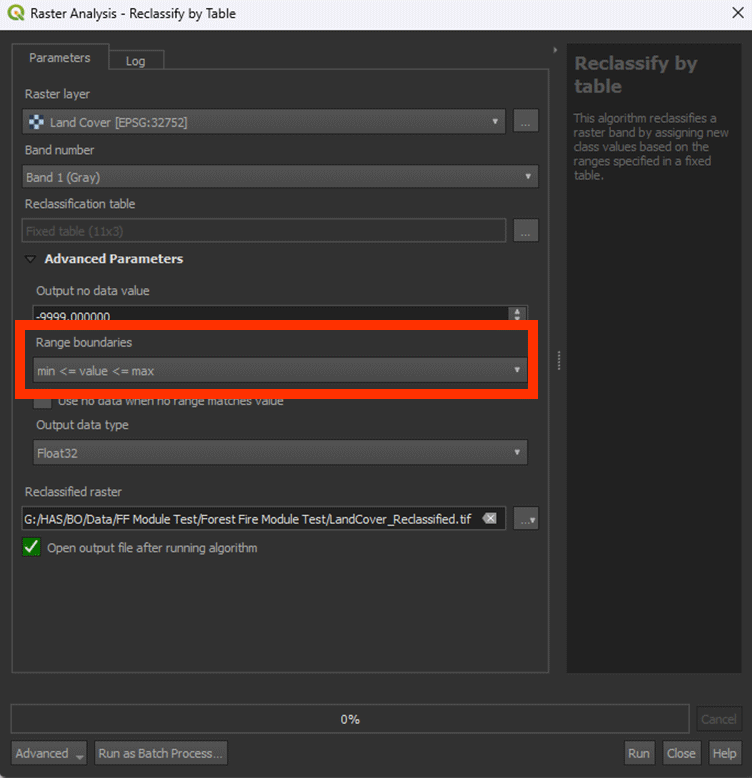
3. Under Advanced Parameters, set Range boundaries to min <= value <= max. This will make the weird min/max values work correctly.
Note: look closely at the way the "<" and ">" are pointing, this does matter.
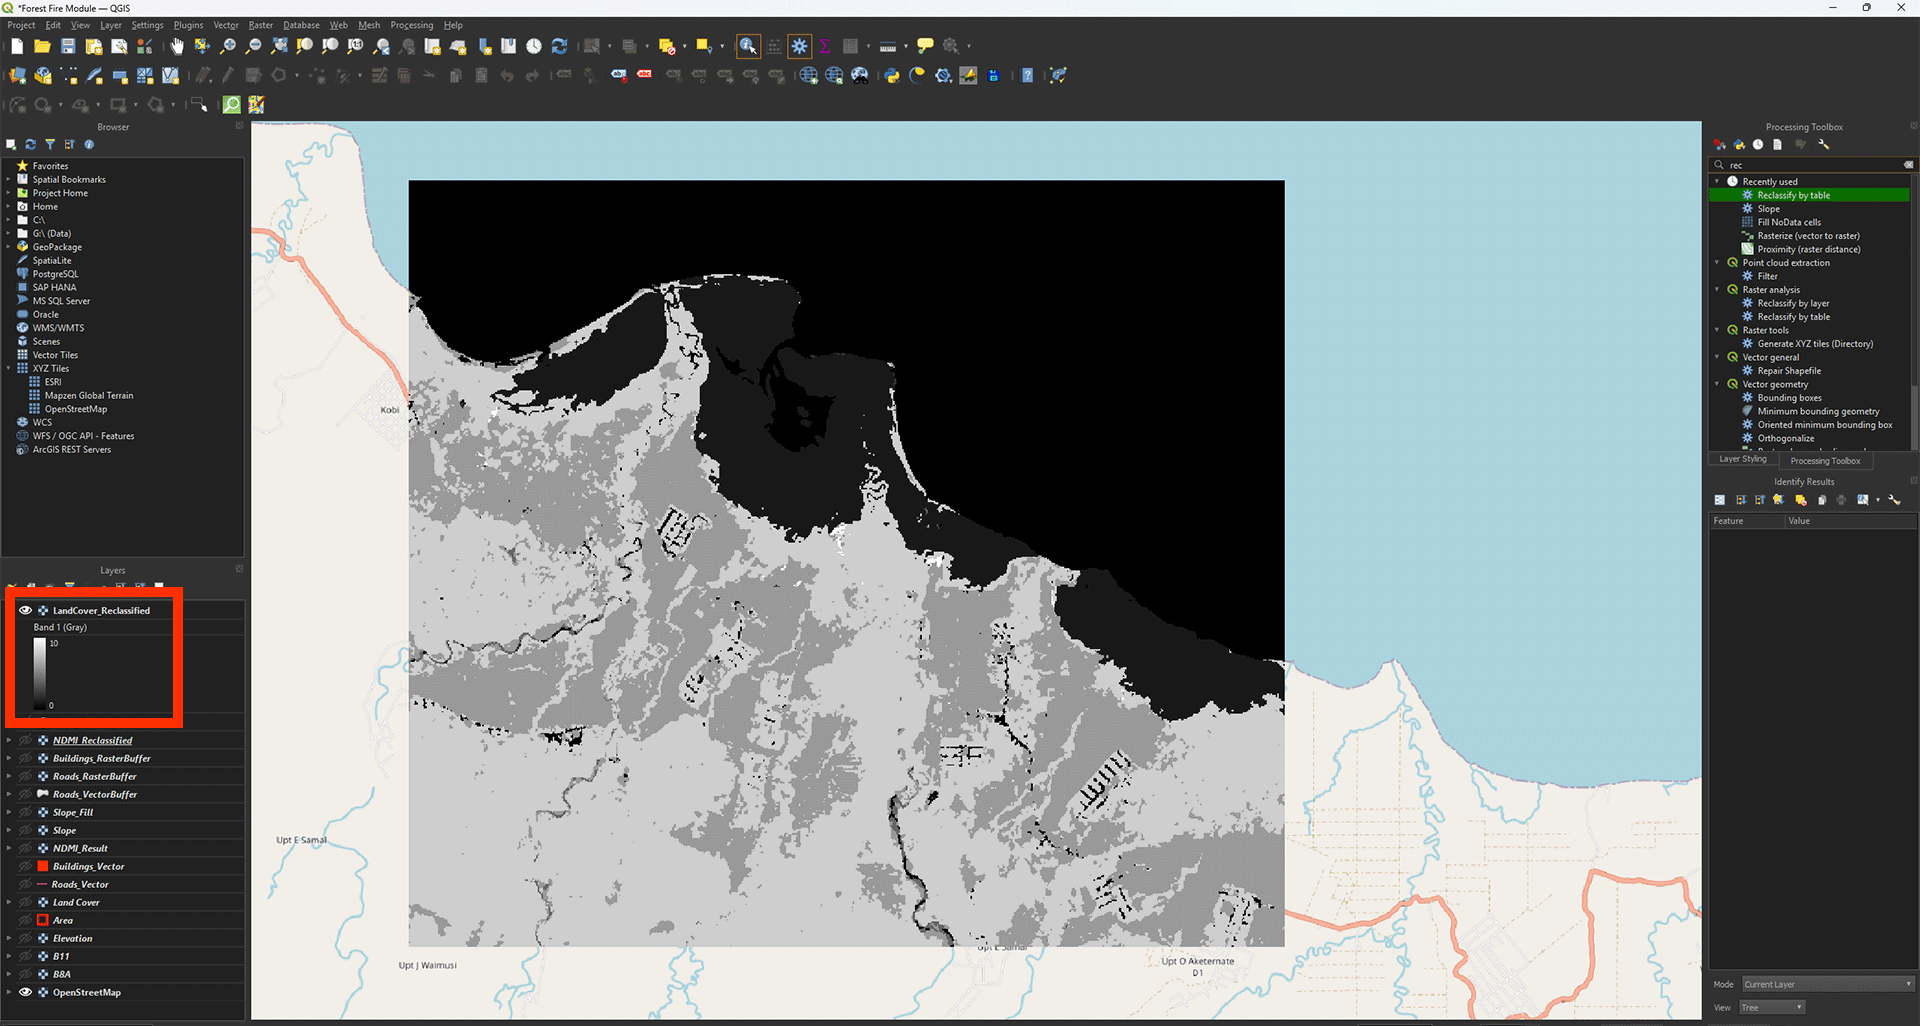
4. Save the Permanent layer as LandCover_Reclassified and Run the tool.
Now we have the reclassified LandCover layer. You can look around on the map and see the different scores with Identify Features. The values should stay between 0 and 10.
Don’t forget to save your project.