Fire Risk Map
6. Download Your Own Data
6.1. Satellite Imagery
To calculate the NDMI, we need to download satellite imagery. To get these images, we will make use of the Copernicus Browser. For the NDMI, we need two layers, B8A and B11. These layers created by the Sentinel-2 satellite’s sensors. In the Copernicus Browser it is possible to search for all the images that are captured by the satellite and download all the layers that is provided.
Copernicus Browser
Create a Copernicus Browser account. As you will encounter many times while looking for data, you need to create an account to use the Copernicus Browser. This website lets us access the Sentinel imagery and download it for our needs.
1. First go to the Copernicus Browser website: https://dataspace.copernicus.eu/browser/
2. Click on the log in button. You don’t have an account yet, so click on the register icon right of the login panel.

3. Fill in the necessary information on the register form and create a password. For the last three questions, you can fill in whatever applies to you, as it does not matter much. An example of what you could fill in is:

4. You can now click the register button and proceed.
You will automatically be sent to the following webpage that will ask you to verify your registration.

5. Go to the inbox of the email address you used during registration and click ‘verify email address’.
Note: If you cannot find the email in your inbox, try looking for it in the Spam folder.
You will be automatically sent back to the Copernicus Browser.
6. If the login was successful, you will see your name appear where the ‘login’ icon was previously.

You now have full access to the Copernicus Browser and can proceed with the rest of the steps.
Find Imagery
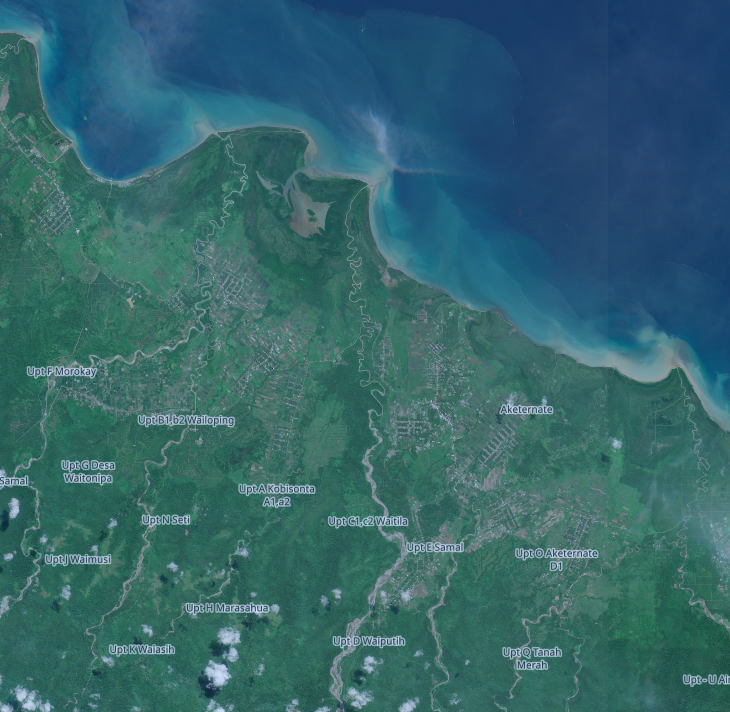
The Copernicus Browser lets us search for all kinds of satellite imagery. This can be quite overwhelming but once you get the hang of it, it isn’t too complicated. We want to find an image of the northern part of the Seram Island, preferably in the months from about June to October.
1. Search for Seram Island by navigating or searching via the Search Bar.

Now we have the correct location, we want to make sure we only get results for what we want.
2. Select Create an area of interest > Draw rectangular area. Draw a rectangle around the island.

Now we can start searching for an image. The main issue we have for Indonesia is the cloud coverage. The islands are covered by clouds most of the year, but we want to have as little cloud coverage as possible, otherwise we can’t see the surface.
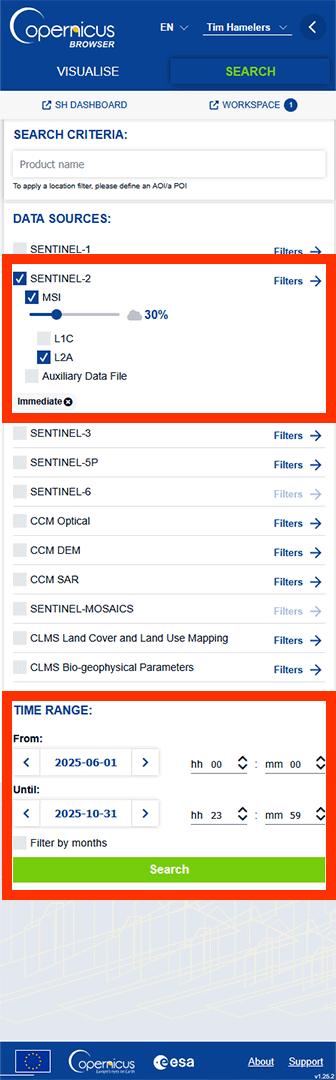
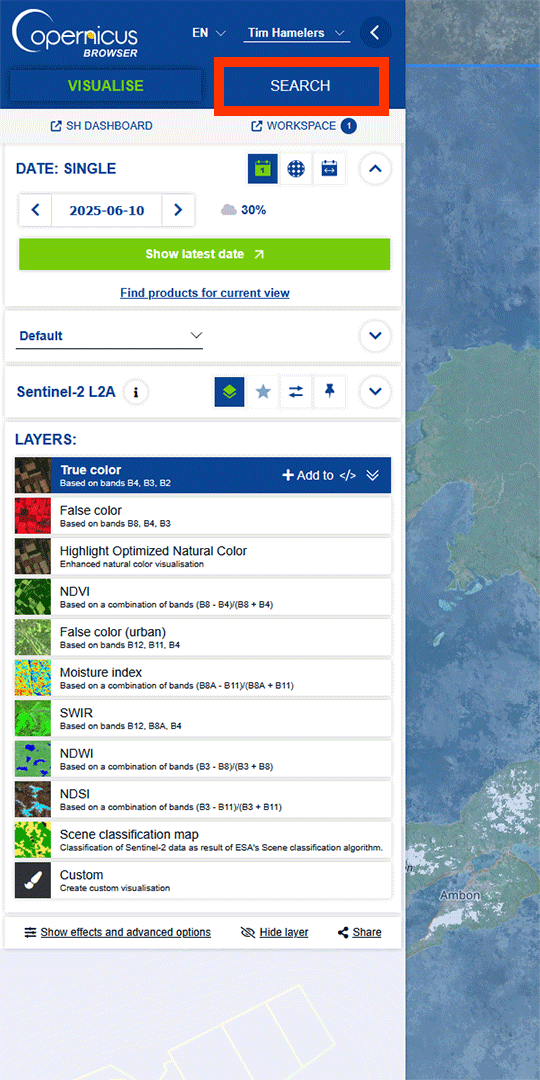
3. Select SENTINEL-2. This is the satellite with the spectral bands we need to perform the NDMI analysis.
4. Select L2A. This gives us the imagery with atmospheric correction. The L2A images remove effects found in the atmosphere that may scatter or absorb light rays. As we want to see the reflections of the surface, we need to use the L2A images instead of L1C, which don’t correct the atmospheric effects.
5. Set the Cloud Coverage at about 30%.This will inlcude imagery with some cloud coverage, but as long as it doesn't cover our area of interest, it is fine.
6. Set the Time Range from 2025-06-01 to 2025-10-31.
7. Click on Search.
Note: Depending on how much data fits our filter, it can take a moment.
On the left panel, we get a list of all the images that fit our filter.
8. Click on a blue square covering the area of interest.

You get a pop-up with all the images that are available on this location. We want to look for the best image with the least cloud coverage.

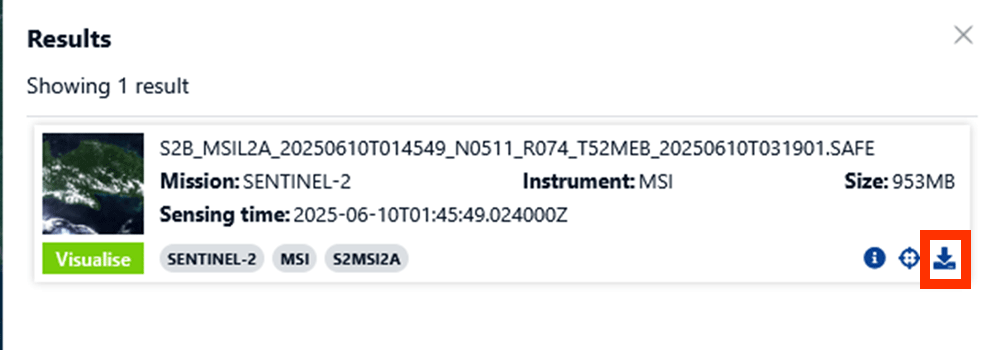
9. Look for this image made on 2025-06-10 and click Visualise.
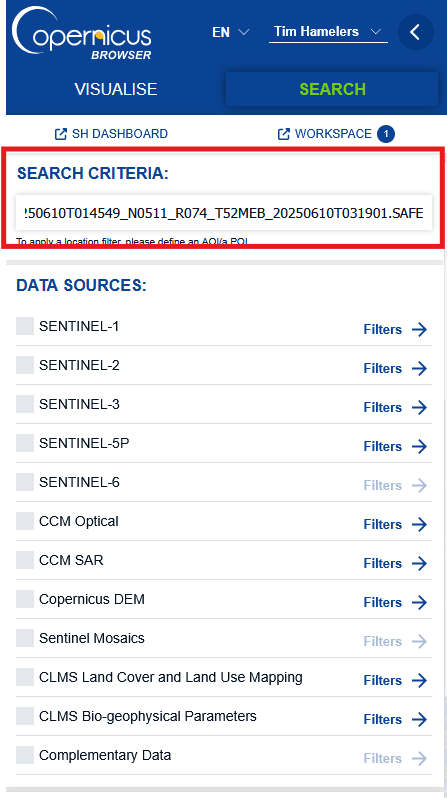
Note: If you can’t find the image, go back to the first Search tab by pressing the < Search button and paste this name into the SEARCH CRITERIA Product name: S2B_MSIL2A_20250610T014549_N0511_R074_T52MEB_20250610T031901.SAFE
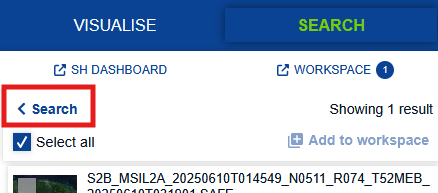
Make sure that the filters are turned off, otherwise the search won’t work. Then, press Search.
If you zoom in on the area of interest on the northern coast of the island, you can see that clouds are not covering it. For this analysis, we will use a fairly small area.
You may have lost the panel with all the images. Click on the Search button and find the image again using the same process.
10. Find the image and press the download button.
Note: older data might take a few days to go online if you want to download it.
This may take a while, as files can be quite large. If you want to download only the necessary images, you can press the Info button next to the dowload button and go to Download single files. Go to GRANULE > IMG_DATA > R20m. Download the two bands that include B8A and B11 in the name. If you want, you can also download the bands from the R10m and R60m folders. The numbers represent the resolution. R20m has a raster of pixels of 20 by 20 meters.
Note: R10m doesn’t include the B11 band and B8A is named B08. B08 slightly differs in result from B8A as well.

Open the Folders
1. When the data is downloaded, unzip the ZIP-file and save it on an easy to find location.
2. You can find the files we are going to use under GRANULE > IMG_DATA > R20m. Look for the two bands that include B8A and B11 in the name.

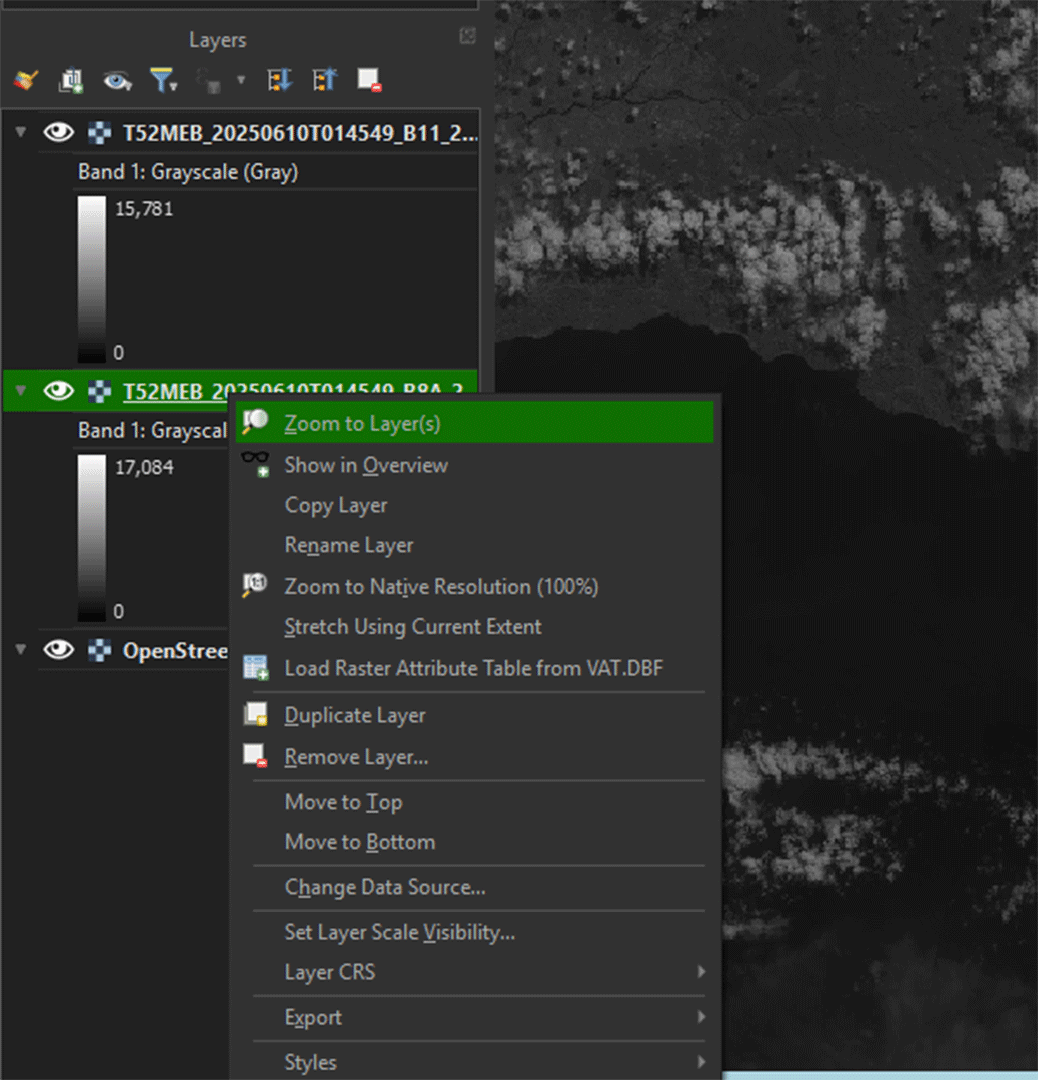
3. Select the 2 images and drag them into QGIS. They now should show up in you Layers panel.

4. If the map stays zoomed out, you can right click on the layer and press Zoom to Layer(s).