PyQGIS Use Case: Stage Volume Curve
2. Calculate the volume below a specific elevation
Before we're going to use a QGIS Processing Tool with PyQGIS, we're going to use the tool first through the interface to get familiar with it. In this tutorial we'll use the Raster surface volume tool tool to calculate the volume below a specific elevation in a DTM.
- Start QGIS Desktop
2. In the main menu go to Project | Open From | GeoPackage.
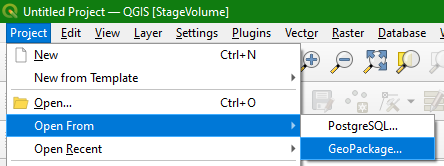
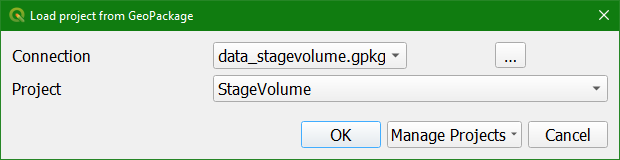
3. In the Load project from GeoPackage dialog browse to the provided data_stagevolume.gpkg GeoPackage and open the StageVolume project.
This project has an SRTM 1-Arc Second DEM reprojected to UTM Zone 32N and clipped to the area around the open pit mine. The DEM has been styled with a colour ramp and is blended with a rendered hillshade.
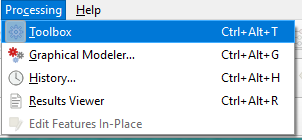
4. Go to Processing | Toolbox to open the Processing Toolbox panel.
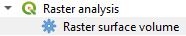
5. In the Processing Toolbox choose Raster analysis | Raster surface volume.
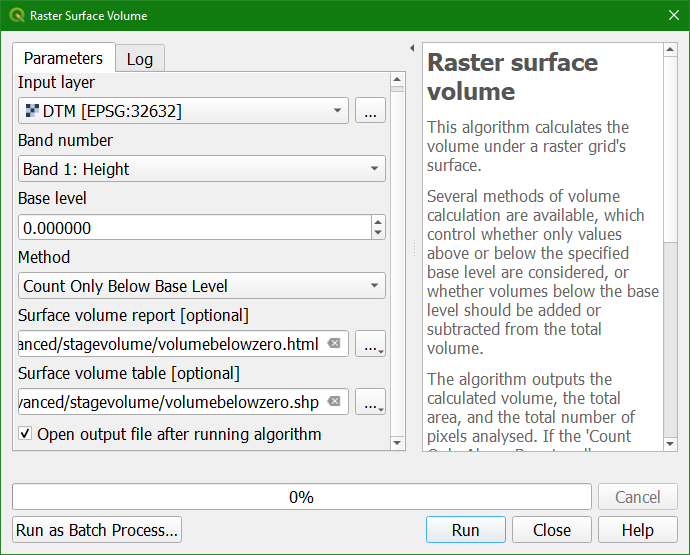
6. In the Raster Surface Volume dialog:
- Choose DTM as Input layer
- Keep Band number as it is
- Here we keep Base level 0 m, because we want to calculate the volume that is below 0 m.
- We do that by changing the Method to Count Only Below Base Level.
- The Surface volume report is an html file. Click on
 and select Save to File... .Give it the name volumebelowzero.html.
 - For Surface volume table Click on and select Save to File... . Make sure to set the file type to a shapefile. Save the file under the name volumebelowzero.shp.
Note that the algorithm actually creates a dbf file, but since this file type can't be selected we work around this by selecting a shapefile as the file format. This will generate an error message when the tool runs, but this can be ignored.
7. Click Run.
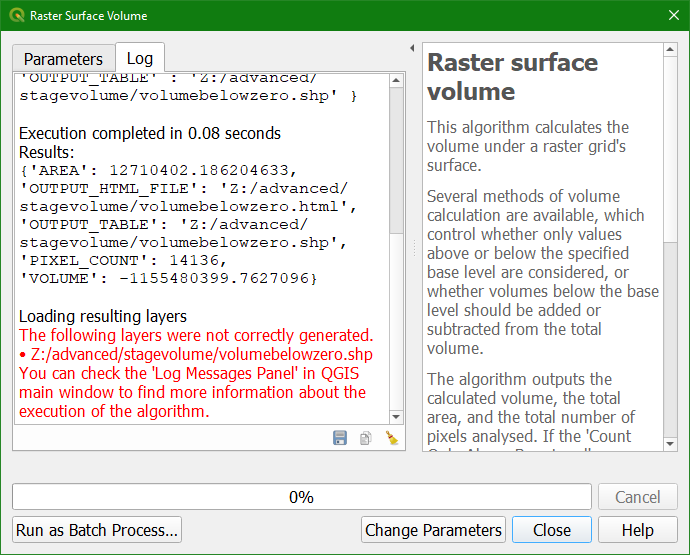
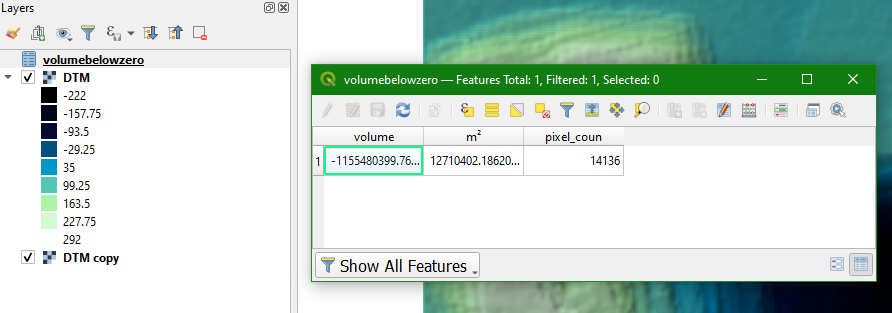
The Log tab gives the result: 'VOLUME' : -1155480399.7627096
It also shows an error in red, which, as mentioned under point 6, you can ignore.
8. Click Close to close the dialogue.
At the bottom of the Processing Toolbox you can find the Results Viewer.
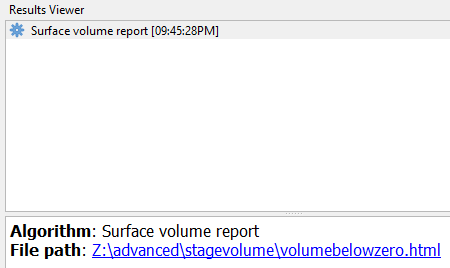
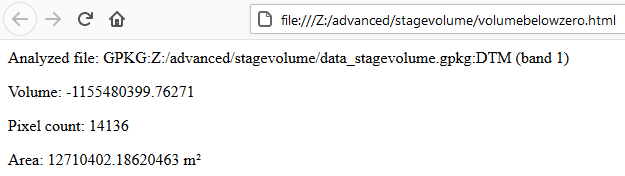
9. Double click on the Surface volume report or the html link (it links to the same). It will open in your web browser. Check the results.
10. Back in QGIS, use the Browser panel to find the volumebelowzero.dbf file on your computer and drag it from the Browser panel to the map canvas.
11. Click right on the volumebelowzero table in the Layers panel and choose Open Attribute Table to check the result.
12. Repeat from step 5 for some other elevations.
In the next section we're going to calculate the volumes for many elevations and store the values in one table.
Watch here the result until this step: