Preprocessing a DEM and calculate flow direction
5. Fill Sinks and Calculate Flow Directions
5.2. Styling the Flow Direction Layer using Arrows
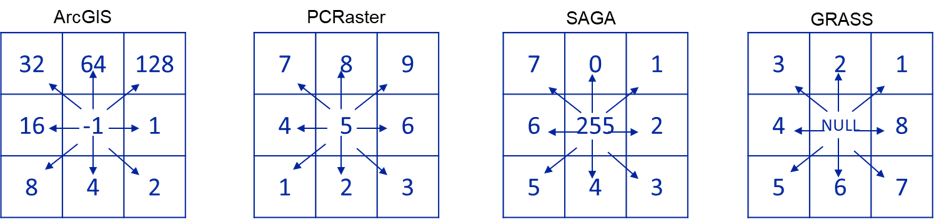
A flow direction layer indicates the direction of flow for each pixel. Direction can be expressed as compass direction, however we cannot store text in a raster. Compass direction can also be expressed by degrees on a circle where north is 0 degrees, east is 90 degrees, etc. To store 360 degrees, we would need more than 8 bits (0-255), which would increase the file size. In addition, the D8 method uses discrete directions to the surrounding pixels. Therefore, GIS software recodes the 8 directions. Each software, however, does it in their own way:
We can styling the flow_direction_saga layer by adding arrows. This can be done using the mesh styling functionality of QGIS. To use that functionality, we need to convert the GeoTIFF to mesh format. We can do that with the Crayfish plugin.
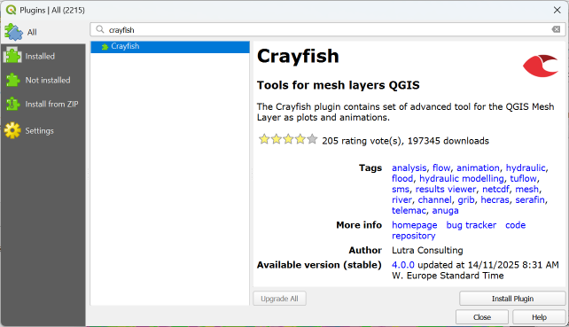
1. Install the Crayfish plugin from the Plugins Manager in the main menu.
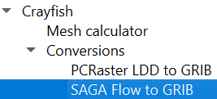
2. In the Processing Toolbox, go to Crayfish | Conversions | SAGA Flow to GRIB.
3. In the SAGA Flow to GRIB dialog, choose flow_direction_saga as Input raster and flowdirmesh_saga.grb as Output file (GRIB).
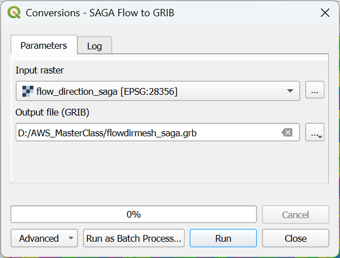
4. Click Run and Close to close the dialog.
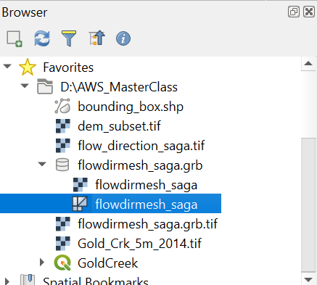
5. In the Browser panel, expand the flowdirmesh_saga.grb group (you might need to refresh the Browser panel with the ![]() button) and add the flowdirmesh_saga layer with the mesh icon
button) and add the flowdirmesh_saga layer with the mesh icon ![]() to the map canvas.
to the map canvas.
This might take some time. If the file is too large for your computer’s memory, you can get errors. In that case, you can clip the flow_direction_saga layer to a smaller area and repeat the steps to convert the file to the mesh format.
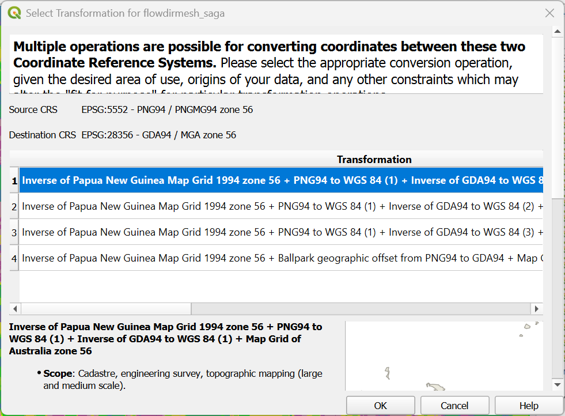
6. If the transformation popup appears, accept the default by clicking OK. Note that the mesh for some reason has a different CRS.
When the map canvas shows a completely yellow layer, the flowdirmesh_saga layer has been loaded and we can start styling it.
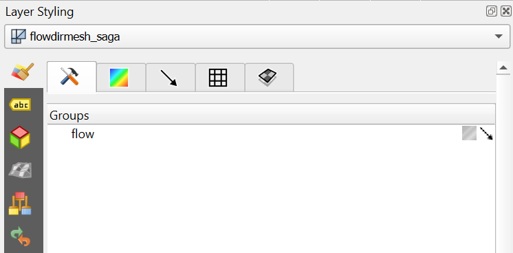
7. Select the flowdirmesh_saga layer in the Layers panel and open the Layer Styling panel.
8. In the Layer Styling panel, stay on the Datasets tab ![]() and click on
and click on ![]() to disable contours and click on the arrow
to disable contours and click on the arrow ![]() to enable vectors. You probably need to make the Layer styling panel larger to see all icons.
to enable vectors. You probably need to make the Layer styling panel larger to see all icons.
Now so many arrows are drawn in the map canvas that it turns black. Let’s tune the settings to improve this.
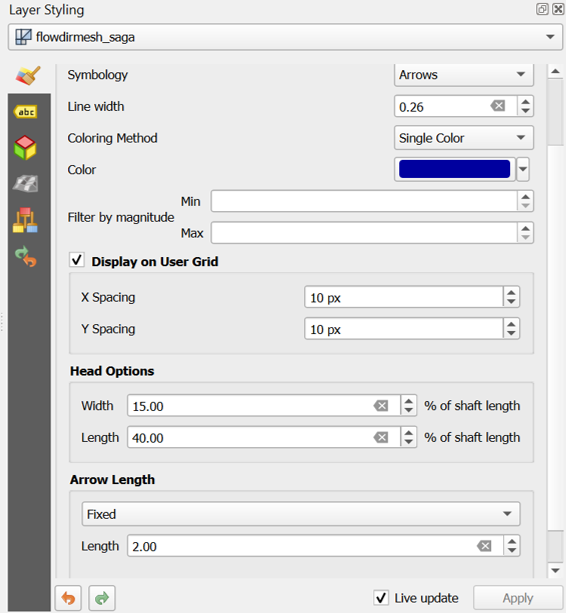
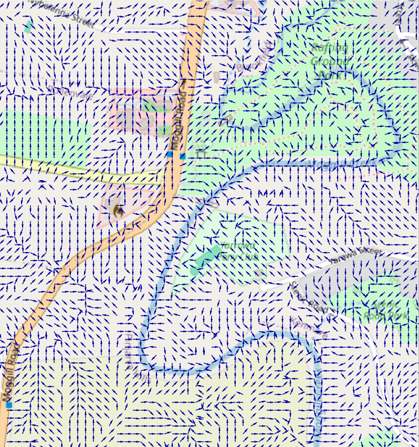
9. Go to the Vectors tab ![]() and change the Arrow Length settings at the bottom of the panel to Fixed and the Length to 2.00. Change the Color to dark blue.
and change the Arrow Length settings at the bottom of the panel to Fixed and the Length to 2.00. Change the Color to dark blue.
10. Zoom in to see the flow direction with arrows.
11. Check the box to Display on User Grid to show the arrows fixed to a grid, e.g. with an X and Y Spacing of 10 px.
The settings are depending on your zoom level. Play with the settings to get a nice result. You can also try the other Symbology settings for visualization as Streamlines and Traces. Don’t forget to regularly save your project.
The arrows are much more intuitive than a coloured flow direction raster. You can plot the arrows over any layer in the map canvas.
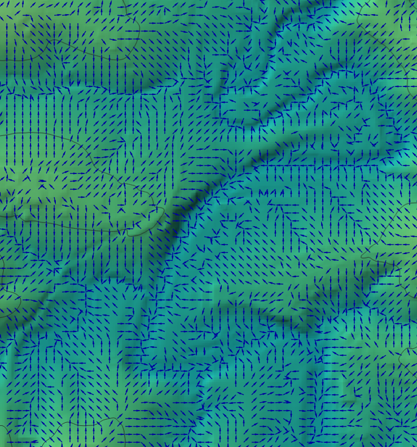
Next, we'll visualise the flow directions in the 3D View.