Create a Heatmap
| Site: | OpenCourseWare for GIS |
| Course: | Creating data visualisations with graphs, maps and animations |
| Book: | Create a Heatmap |
| Printed by: | Guest user |
| Date: | Tuesday, 28 July 2026, 2:34 PM |
1. Introduction
When we want to visualize point data and we are interested in the distribution of the points over space, we can use heat maps.
In this tutorial we'll explore how to visualize point data with a high density.
2. Create Backdrop Maps with Vector Tiles
1. Start QGIS Desktop with an empty project.
2. Install the MapTiler plugin from the Plugins Manager.
Now you can find a MapTiler folder in the Browser panel.
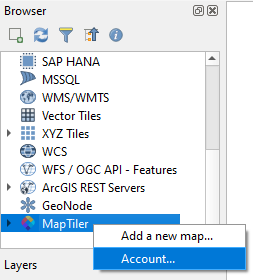
3. Right-click on MapTiler and choose Account....
4. Get a free access key by clicking the link in the MapTiler Account popup.
5. On the web page sign in or create a new account.
6. In your account find or create and API key.
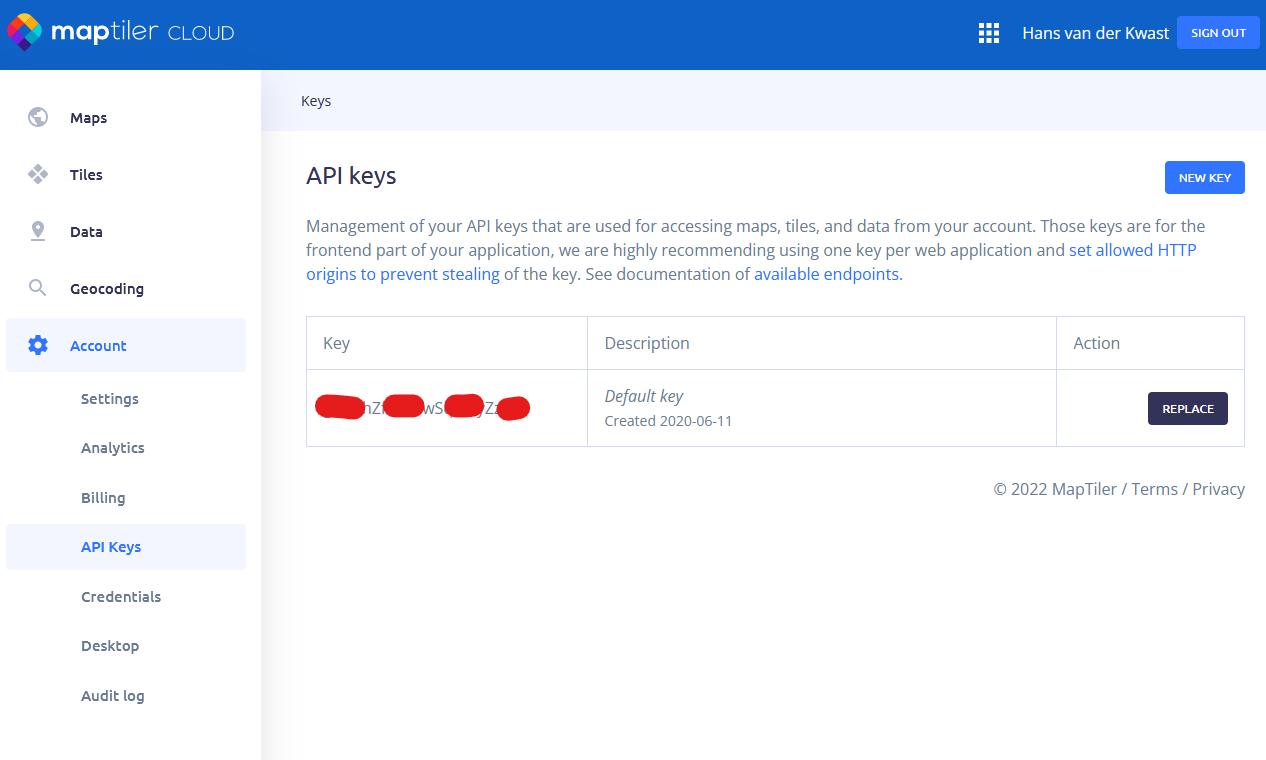
7. Copy the key and paste it in the MapTiler Account popup in QGIS.
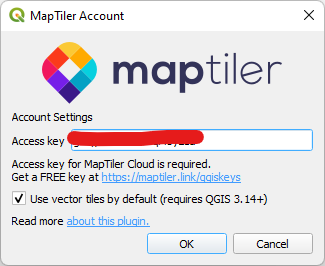
8. Click OK.
Now you have access to vector tiles provided by MapTiler.
9. Expand the MapTiler folder in the Browser panel by clicking the black triangle.
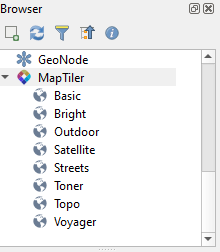
10. Right-click on Basic and choose Add as vector.

11. Ignore the error and zoom in to the Netherlands.
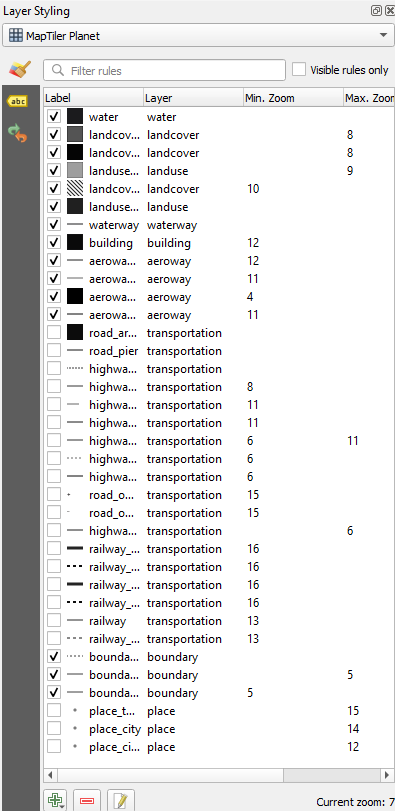
In the Layers panel you can see that the Basic layer is a layer group.
12. Click the black arrow to expand the layer group.
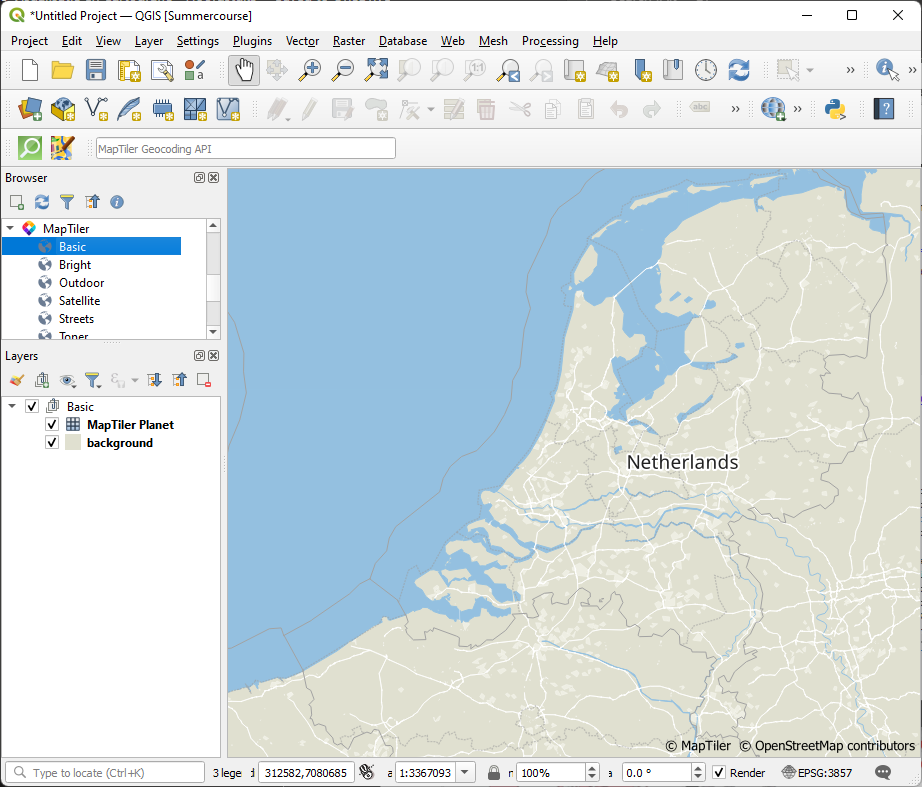
The advantage of vector tiles is that you can change the styling and labels of the layer.
13. Activate the MapTiler Planet layer by clicking it.
14. Open the Layer Styling panel by clicking  .
.
Here you can uncheck styles or change styles.
15. Let's remove the roads. Uncheck all road symbols.
We can also change labels.
16. Go to the Labels  tab.
tab.
17. We know that the country is the Netherlands, so we uncheck the label_country. (Note that the other labels don't show up, that was the error when we loaded the layer).
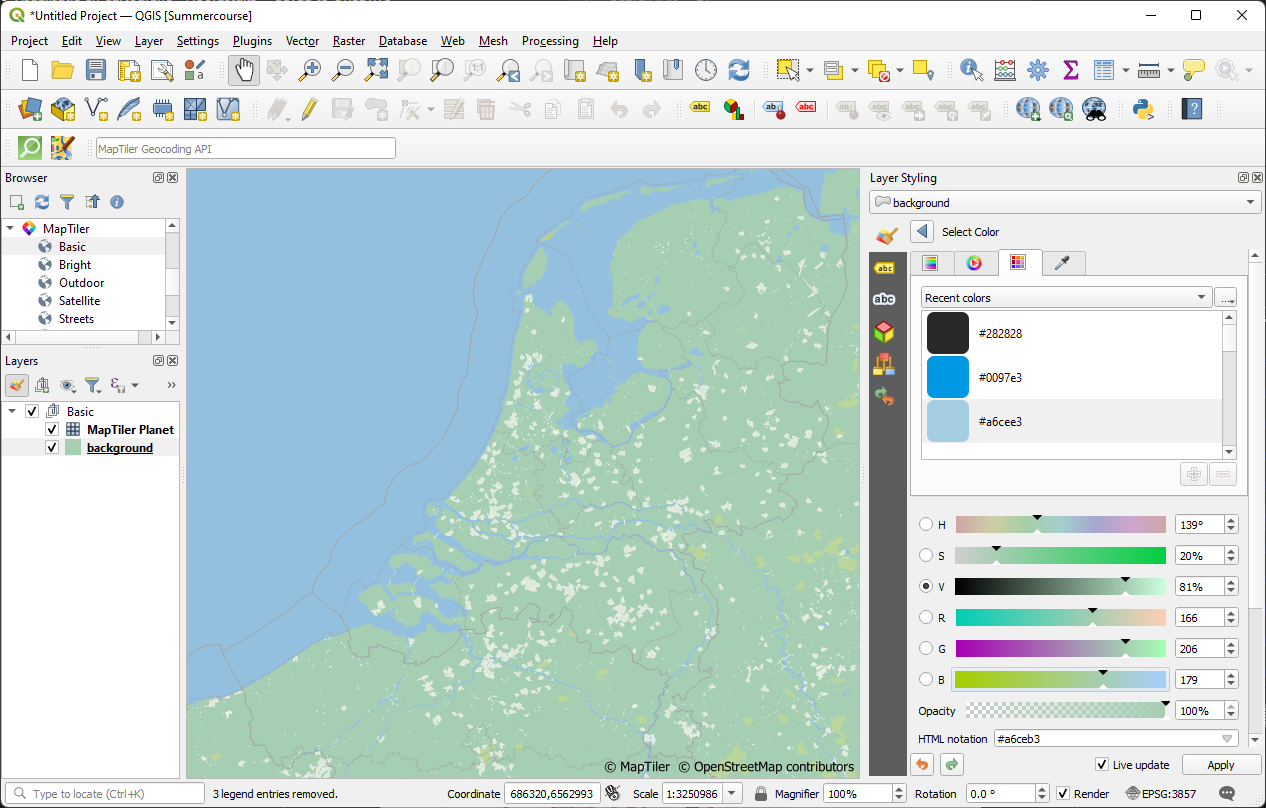
In the Layer group you can also find the background layer which shows the background color below the vectors.
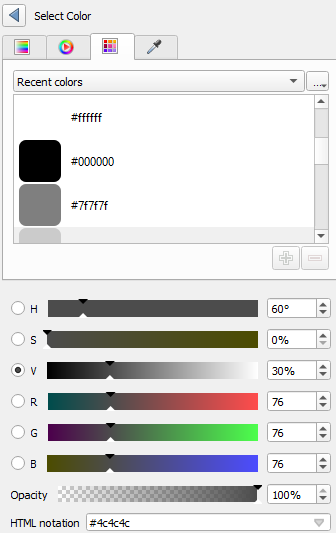
18. Change the color of the background layer to green with RGB 166 | 206 | 179.
The result should look like this:
Besides the default vector tiles we can load others.
For this project we're going to use subtle background with names of the cities.
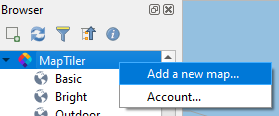
19. Right-click on MapTiler in the Browser panel and choose Add a new map....
20. Go to the MapTiler Cloud tab.
21. Select Dark Matter and click OK.
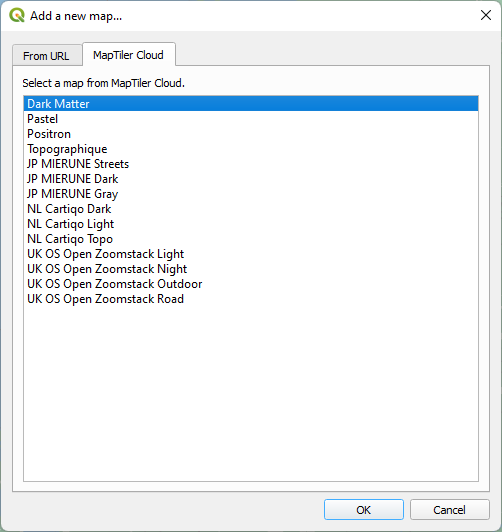
The Dark Matter layer is now available in the Browser panel under MapTiler.
22. Right-click on Dark Matter and choose Add as Vector.
23. Remove the Basic layer group from the Layers panel.
Now we're going to tweak this base map a bit. We're not interested in the roads and the road numbers that are drawing a lot of attention on the map.
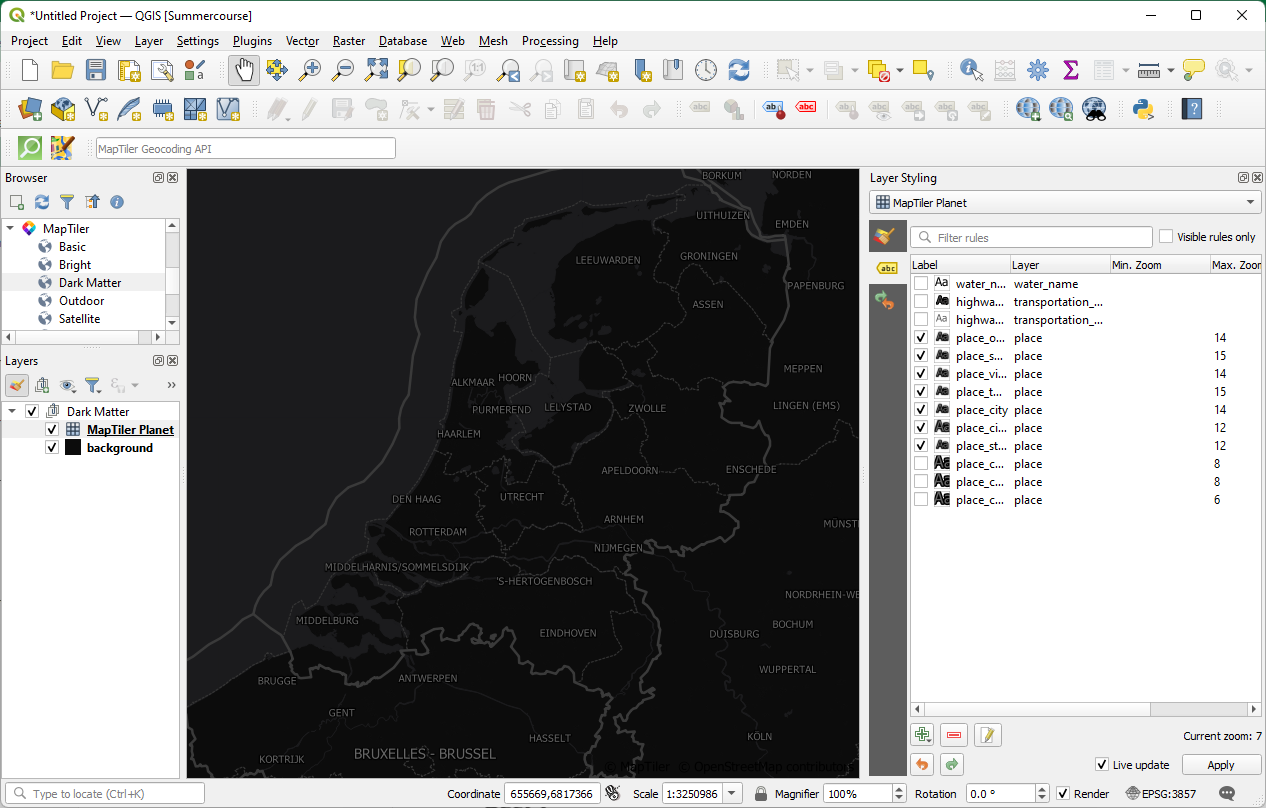
24. Expand the Dark Matter layer group and select the MapTiler Planet layer.
25. Go to the Layer Styling panel and uncheck all boxes related to roads.
26. Also uncheck the points for the places, because we just want to see labels with place names.
27. Now go to the Labels  tab.
tab.
28. Hide all labels except the place names. Also hide the country name labels.
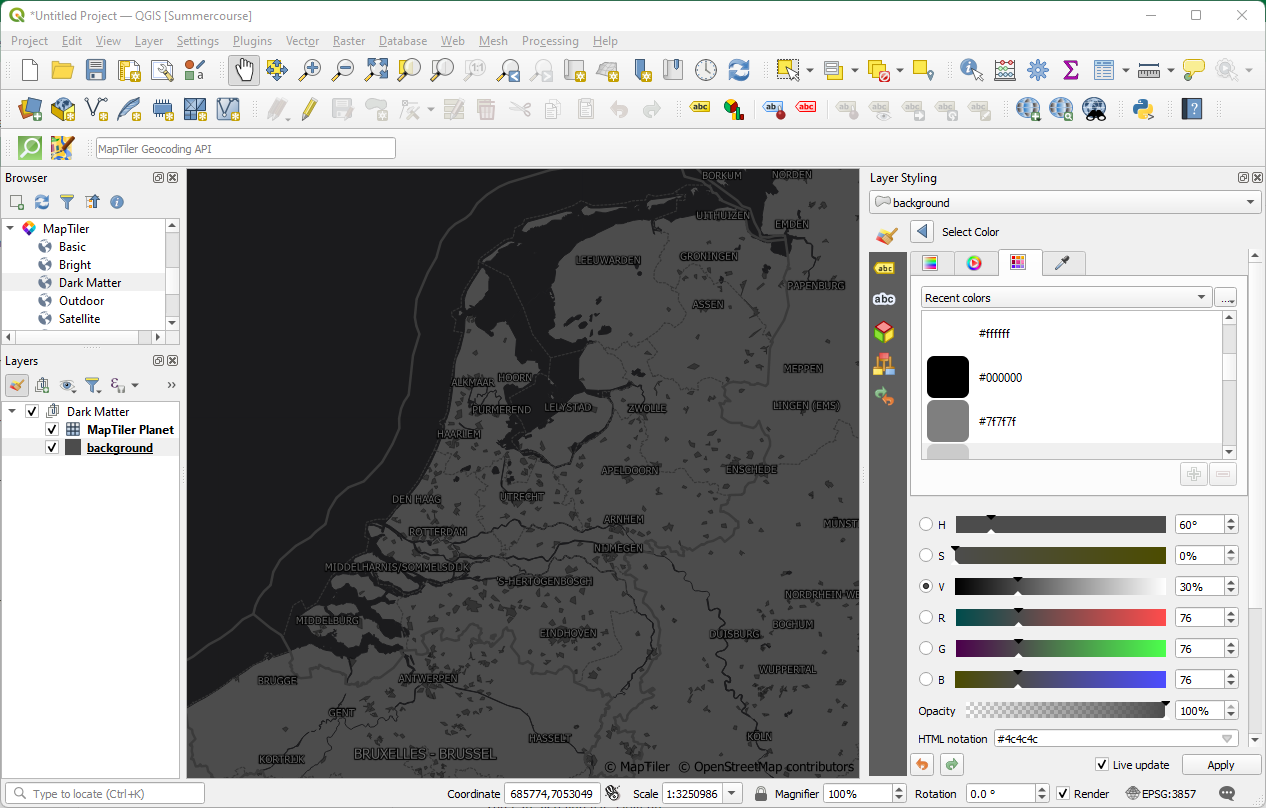
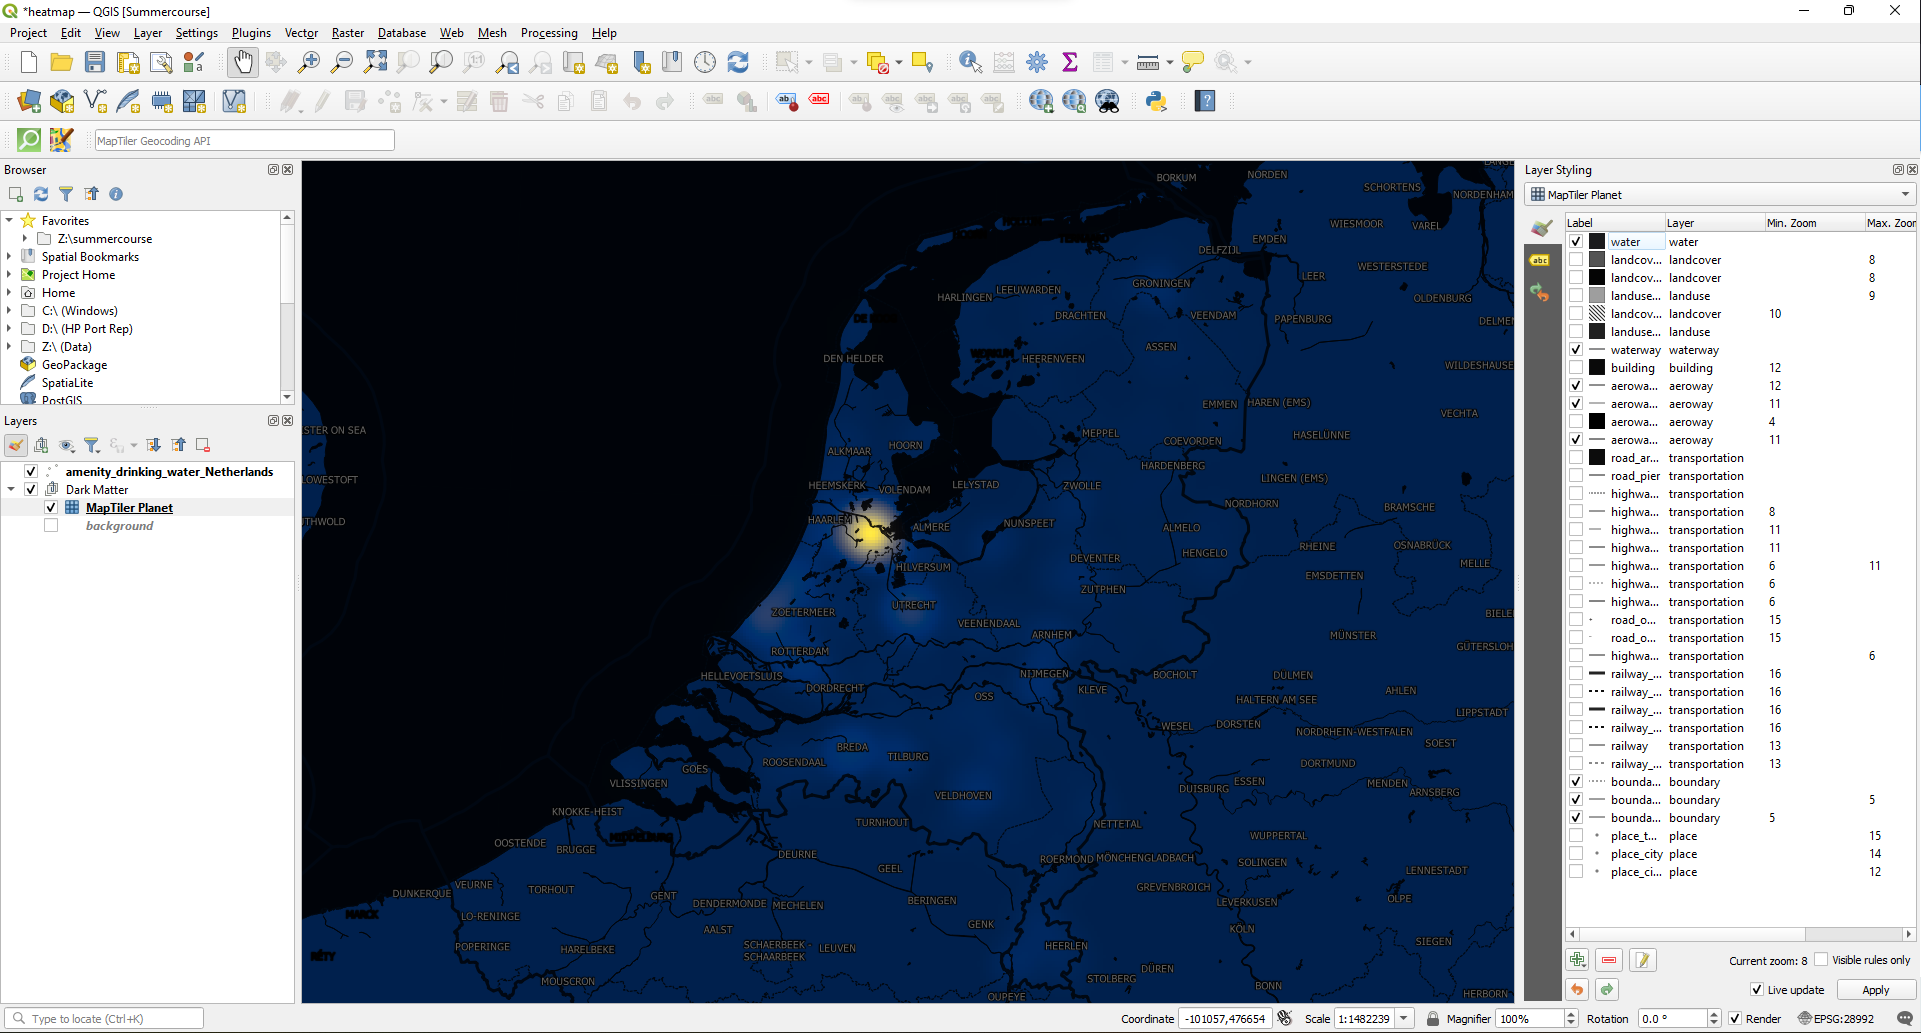
The black background is a bit overwhelming.
29. Select the background layer in the Layers panel.
30. In the Layer Styling panel change the Color to 30% gray.
Now our backdrop layer is ready and we can start with loading the data that we want to visualize. Maybe later we still need to adjust styles and labels from the backdrop.
3. Download Water Tap Points from OpenStreetMap
We're going to visualize water taps in the Netherlands. We can download them from OpenStreetMap with the QuickOSM plugin.
1. Install the QuickOSM plugin from the Plugins Manager.
2. Click the  icon to open the dialog.
3. Use Key=amenity and Value=drinking_water.
4. After In type Netherlands.
5. In the Advanced section make sure to only select Points in the right column.
6. Increase the Timeout to 60, because the dataset to download is quite large.
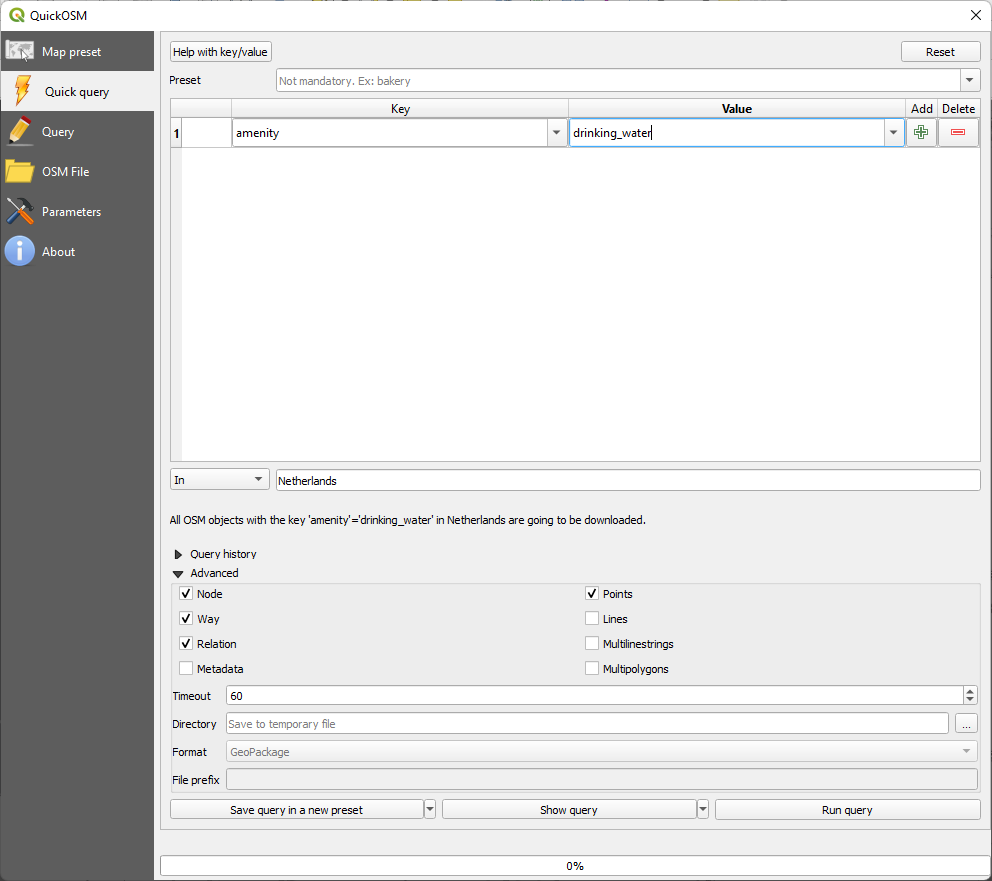
7. Click Run query.
8. When the message appears that the layer has been successful loaded close the dialog.
In the next section we'll style the points.4. Styling Points with Different Renderers
Let's style the point with the water taps.
Make sure the points layer is on top in the Layers panel.
For some reason it shows the data with a categorized legend based on color. We just want to see all points in the same way. Let's try a few options.
1. Change the renderer from Categorized to Single Symbol.
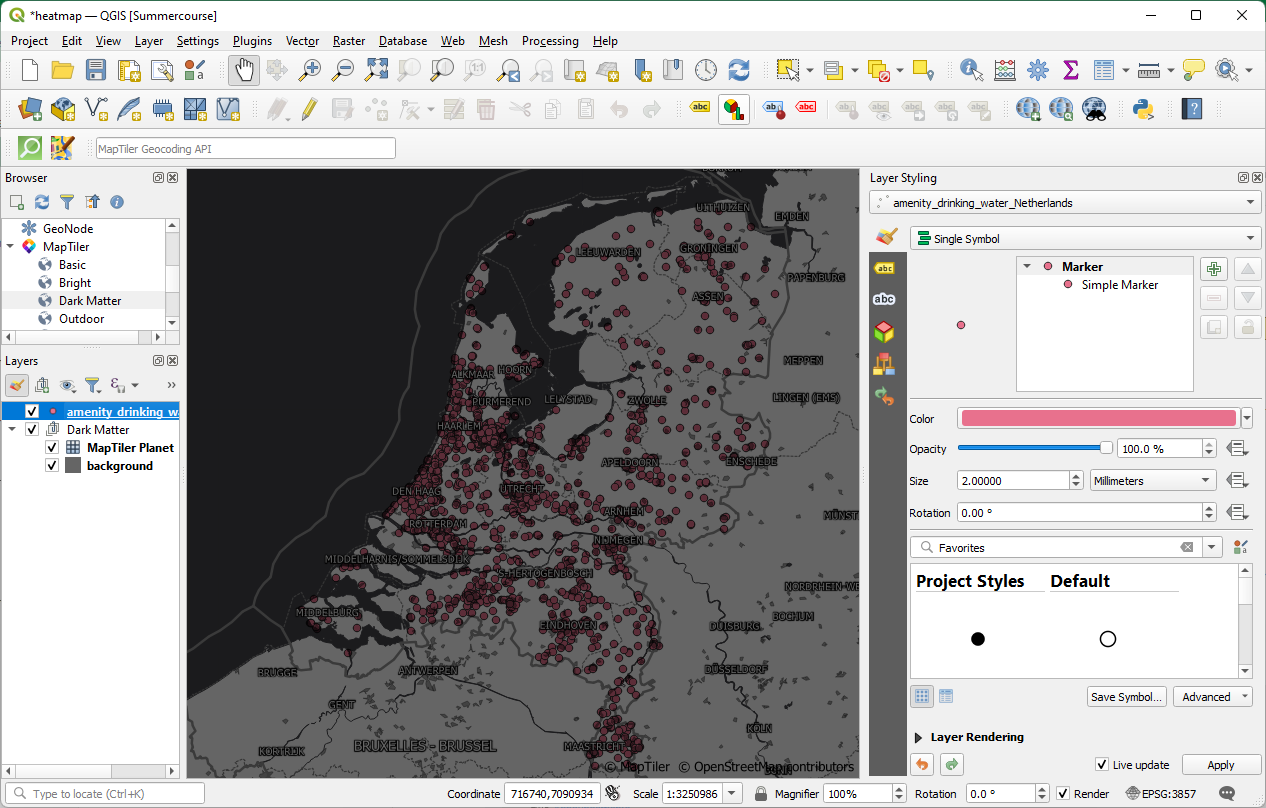
Now each point gets the same symbol. This looks a bit chaotic. We can see that some areas have many overlapping points.
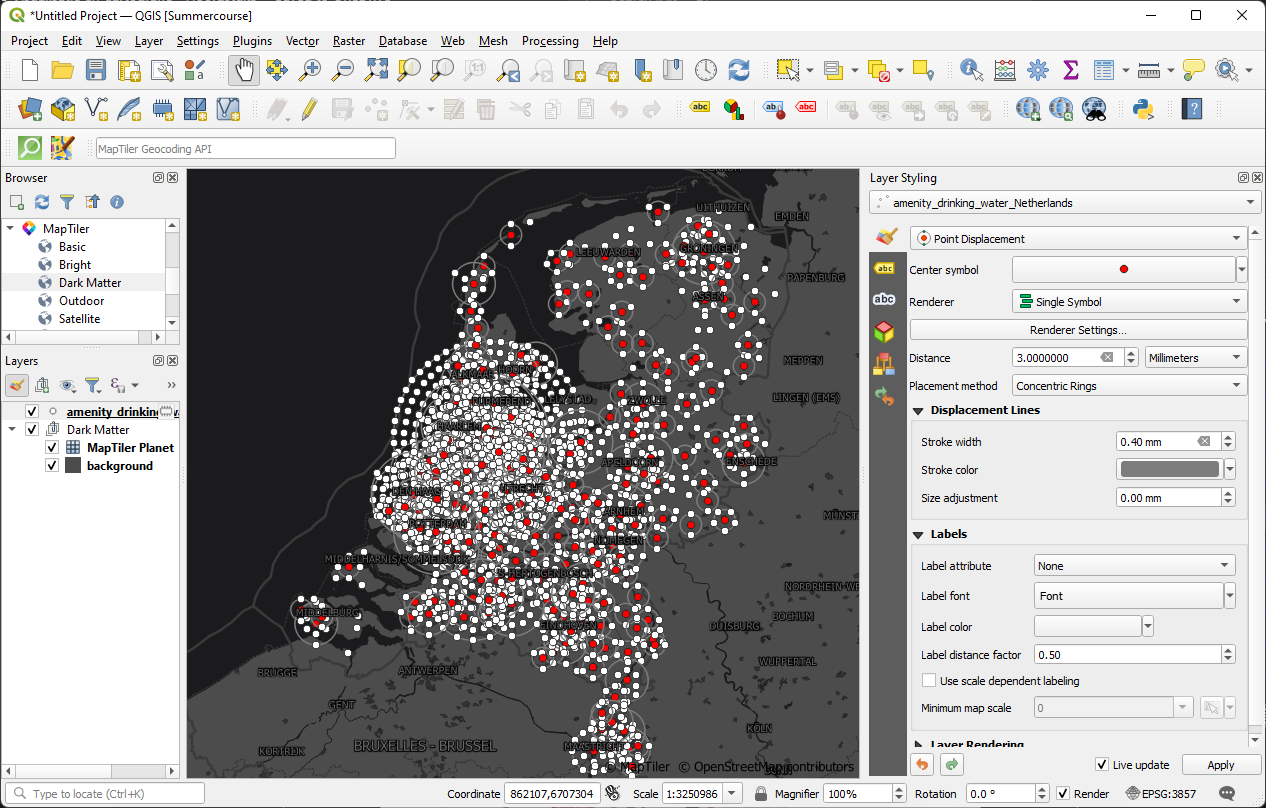
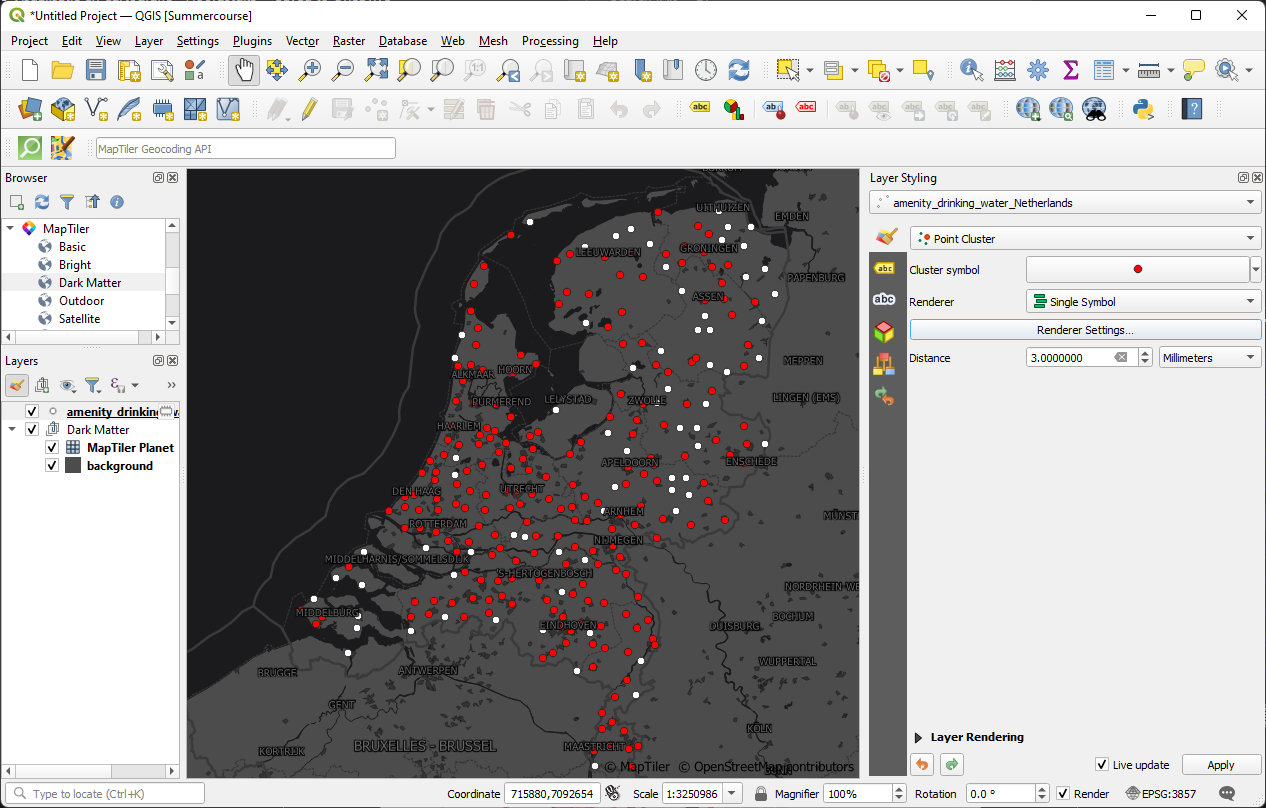
2. Change the renderer to Point Displacement.
This renderer will visualize all features of a point layer, even if they overlap. To do this, the renderer takes the points falling in a given Distance tolerance from each other and places them around their barycenter following different Placement methods:
- Ring: places all the features on a circle whose radius depends on the number of features to display.
- Concentric rings: uses a set of concentric circles to show the features.
- Grid: generates a regular grid with a point symbol at each intersection.
5. Conclusion
In this tutorial you've learned to visualize point data with different renderers and to create a heat map.
This video shows the whole exersise: