Styling Rivers and Basins
| Site: | OpenCourseWare for GIS |
| Course: | Creating data visualisations with graphs, maps and animations |
| Book: | Styling Rivers and Basins |
| Printed by: | Guest user |
| Date: | Monday, 27 July 2026, 1:52 PM |
1. Introduction
In this tutorial we're going to create a nice visualization of rivers and their basins at the continental scale.
We'll use data from HydroSHEDS. HydroSHEDS is a free dataset providing hydrographic data for global and regional applications.
2. Download Open Data from HydroSHEDS
Let's first download the open data layers that we need from HydroSHEDS.
1. Open an internet browser and go to https://www.hydrosheds.org/.

2. Click Explore the data.
3. Click on HydroBASINS.

4. Scroll down and download the data for your continent of interest. Use the dataset that is Customized (with lakes). Here we'll proceed with Europe.

5. After downloading, unzip the file to the folder on your hard drive where you're going to store the data for this project (note that file and folder names should not contain spaces, minus or other strange characters, which can cause unexpected errors).
6. Next go to the HydroRIVERS page.
7. Download the shapefile for the continent that you'll focus on. Here we'll use Europe and Middle East.

8. Also unzip this downloaded zip file to the folder where you'll work for this project.
9. Open QGIS Desktop with a new project.
10. Go to the Browser panel and drag hybas_lake_eu_lev04_v1c.shp to the map canvas.
11. Do the same for HydroRIVERS_v10_eu.shp.

Now we have the data we can start styling in the next section.
3. Style Basins with Random Colors
Let's start with styling the basins. We're going to give the basins a random color.
1. In the Layers panel, drag the basins polygon layer to the top.
2. Activate (select) the layer and click  to open the Layer Styling panel.
3. Change the renderer from Single Symbol to Graduated.
To get random colors, we're going to use an expression for Value.
4. At Value click  to open the Expression Dialog.
5. Use the search box to search for the rand function and read what it does.
6. Double-click on rand to add it to the expression.
7. Complete the expression so it reads:
rand( 0,9999 )
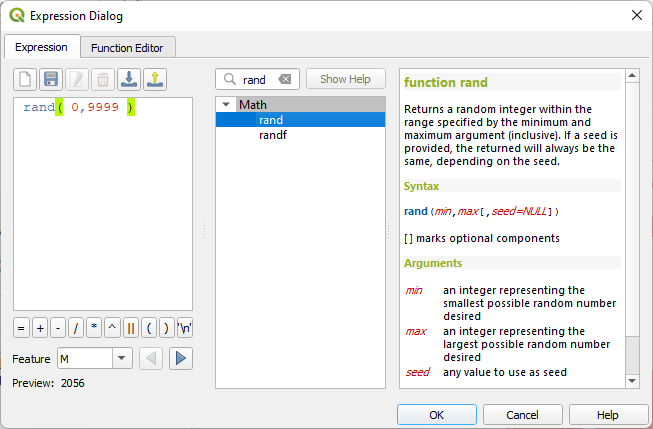
This will create for each feature a random integer number between 0 and 9999.
8. Click OK to go back.
9. At Color ramp choose Random colors.
10. Change the amount of Classes to 150.
11. Click Classify to apply the settings.
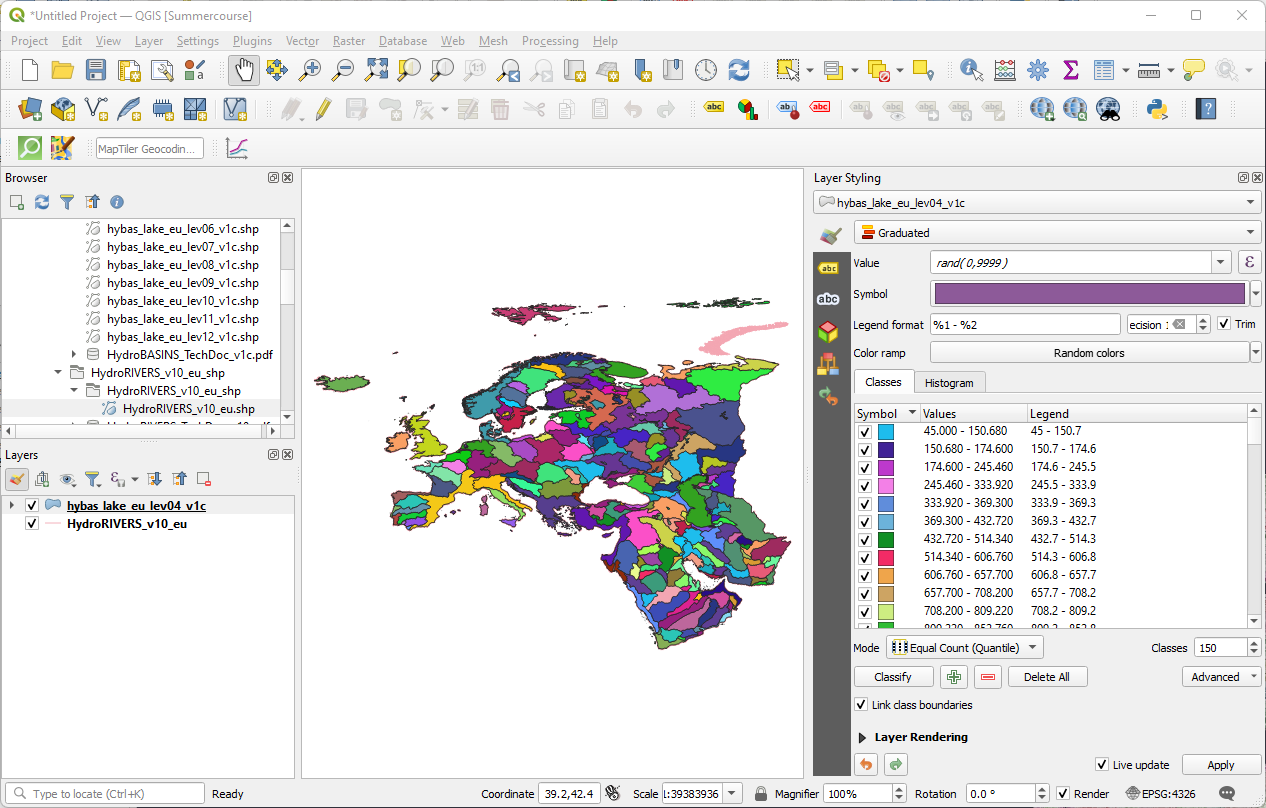
Each time you click Classify it will update the random colors. So you can do this until you're satisfied with the color distribution.
Next, we'll focus on styling the rivers.4. Style Rivers using the Interpolated Line Renderer
Now we're going to style the rivers. We would like to see the width of the lines increasing from upstream to downstream.
1. Hide the basin polygons by unchecking its box in the Layers panel.
Let's have a look at the attributes of the rivers layer. Because the attribute table is large, we're not going to open it to see the attributes. That will take a lot of time. Instead, we'll use the Layer Properties.
2. In the Layers panel right-click on HydroRIVERS_v10_eu and choose Properties... from the context menu.

3. In the Layer Properties dialog go to the Information tab and scroll down to the Fields section.

You can find the description of these fields in the PDF that came with the downloaded data. It is always important to read the metadata documents to understand the data.
We can use the ORD_STRA field, which contains the Strahler orders.
4. Click OK to close the Layer Properties dialog.
5. Go to the Layer Styling panel and verify that HydroRIVERS_v10_eu is the target layer.
6. Click on Simple Line.
7. Change the Symbol layer type to Interpolated Line.
8. In the Stroke Width section change FIxed Width to Varying Width.
9. For Start value and End value choose the ORD_STRA field.
10. Click  to automatic set the Min. value and Max. value between which it should interpolate the line width.
11. Set the Min. width to 0 and the Max. width to 1 mm.

Now we've set the varying size, but we also want to vary the color.
12. Scroll down to the Color section and change Single Color to Varying Color.
13. For Start value and End value choose again the ORD_STRA field.
14. Click to automatic set the Min. value and Max. value between which it should interpolate the line color.
It looks already nice with a blue ramp, but in the next section we're going to blend it with the basin polygons. Therefore, it is necessary to change the ramp to gray.
15. Change the Color ramp to Greys.

In the next section we're going to blend the two layers.
5. Blend the Basin Colors with the River Lines
In this section we're going to finalize the styling. We're going to blend the colors of the basin polygons with the river lines and we'll change the background color of the map canvas. Finally, we'll export the result to a PNG file.
1. Make the basin polygons visible by checking the box before the hybas_lake_eu_lev04_v1c layer in the Layers panel.
We're going to apply blending. Helen McKenzie wrote a nice blog on the different blending modes.
2. In the Layer Styling panel make sure that the hybas_lake_eu_lev04_v1c layer is the target layer. Go the Layer Rendering section and change the Blending mode for the Layer to Soft Light.
The result already looks impressive now!

The map will look nicer with a black background.
You can set the background color of the map canvas for a project in the Project Properties.
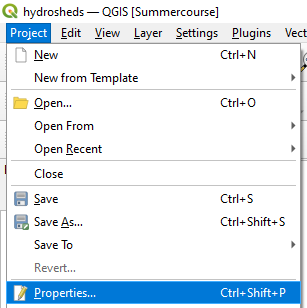
3. In the main menu go to Project | Properties.
4. In the General tab change the Background color to black.
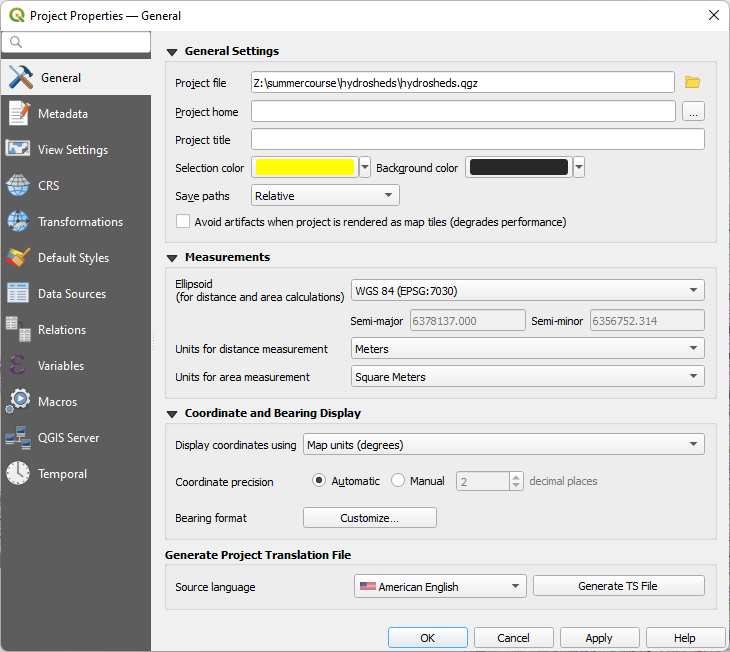
5. Click OK to apply and close the dialog.
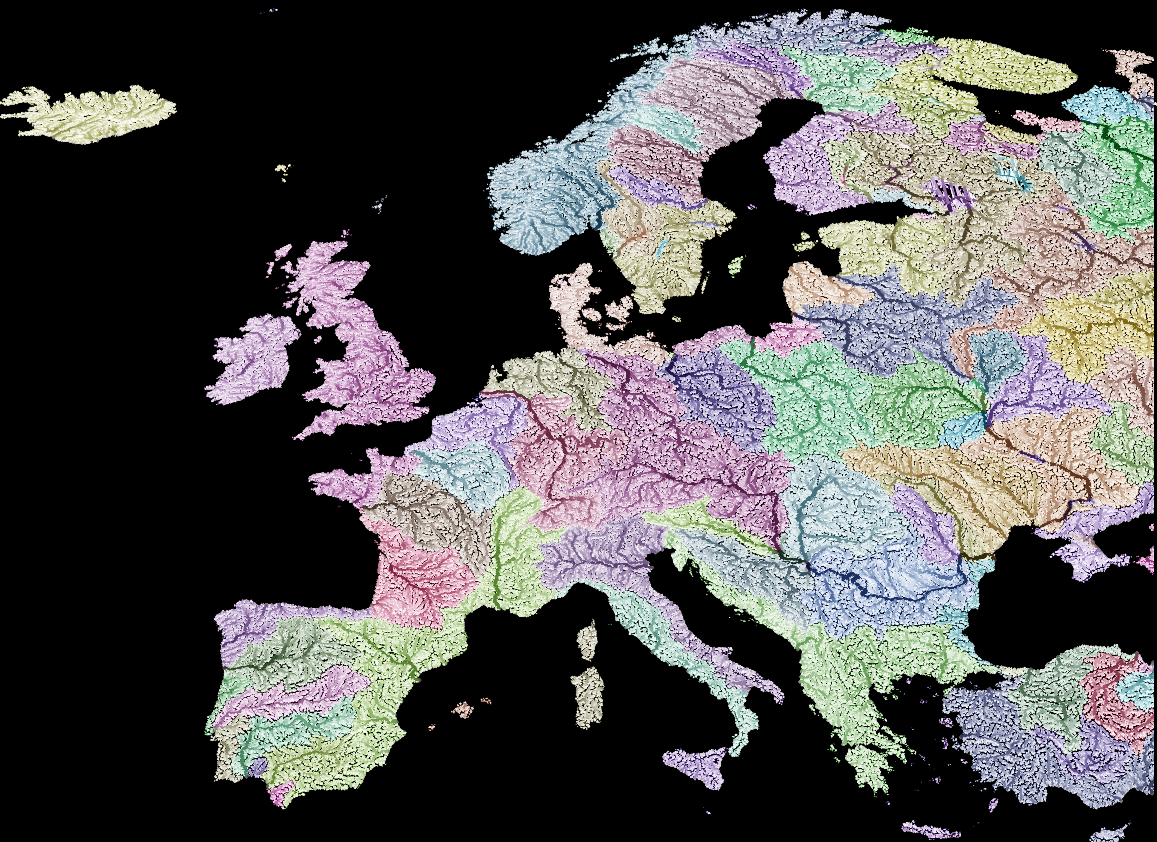
The projection is in the Geographic Coordinate System (GCS - WGS-84, EPSG:4326). Let's change it to the Equal Earth projection.
6. Click on the EPSG code on the lower right of the screen to change the projection of the project (on-the-fly reprojection) and change it to EPSG:8857.
We use EPSG:8857 here, because it is best for areas around Greenwich. Choose one of the other Equal Earth projections if your project covers a different continent.
The result should now look like this:
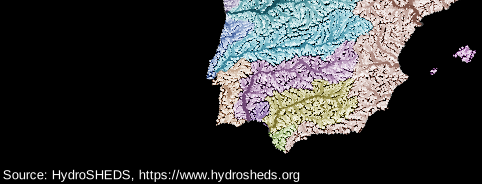
As good practice, we still need to add credits to the data source.
7. In the main menu go to View | Decorations | Copyright Label....

8. Check the box to Enable Copyright Label and replace the text with:
Source: HydroSHEDS, https://www.hydrosheds.org
9. Change the Font color to white (because we have a black background it can't be black, unless you want to use invisible ink) and change the Placement to Bottom Left, where there is space in the case of the European
map.

Now you can export the map to a PNG file.
7. In the main menu go to Project | Import/Export | Export Map to Image....
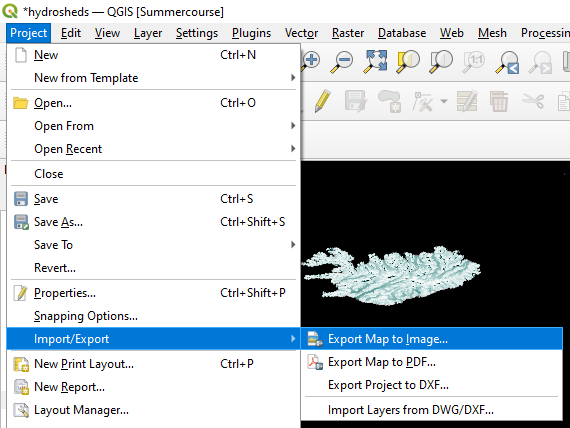
8. You can keep the defaults. Click Save, choose a filename and the PNG format.
6. Conclusion
In this tutorial you've learned to style rivers and basins from HydroSHEDS at continental scale. You've learned to apply the interpolated line renderer, random colors and blending modes.
Watch this video to check the steps: