Create Time Lapse Videos with Streamlit for Geospatial Applications
| Site: | OpenCourseWare for GIS |
| Course: | Creating data visualisations with graphs, maps and animations |
| Book: | Create Time Lapse Videos with Streamlit for Geospatial Applications |
| Printed by: | Guest user |
| Date: | Sunday, 28 June 2026, 2:14 PM |
1. Introduction
Sometimes you just want to show a timelapse of satellite images.
You can easily create a timelapse videos and animated GIF's with Streamlit for Geospatial Applications by Qiusheng Wu. It is an open source project that combines streamlit and open-source Python mapping libraries, such as leafmap, geemap, pydeck, and kepler.gl.
In this tutorial we'll look at an example for the Marker Wadden in the Netherlands, but feel free to apply it to your own area of interest.
2. Create a GeoJSON for your Area of Interest
Let's start creating the timelapse video. First we need to indicate the location of our study area.
1. In your web browser go to https://streamlit.geemap.org/.
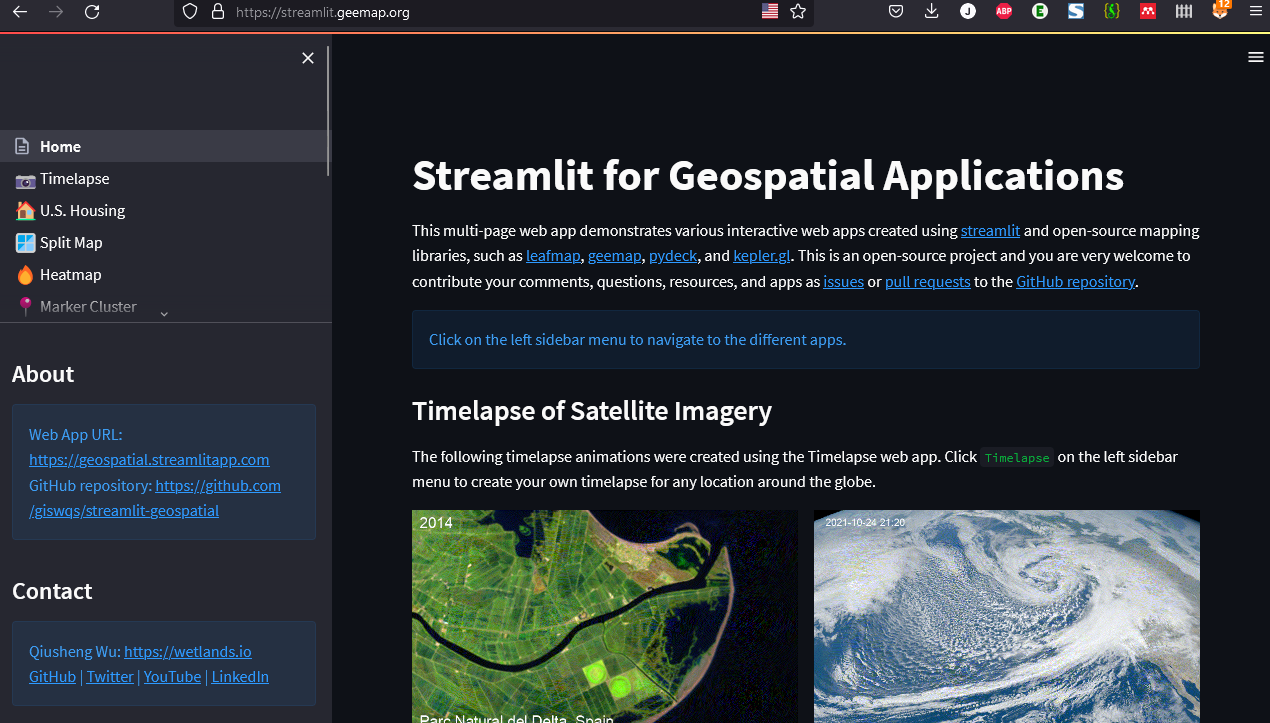
2. Choose Timelapse in the navigation menu on the left.
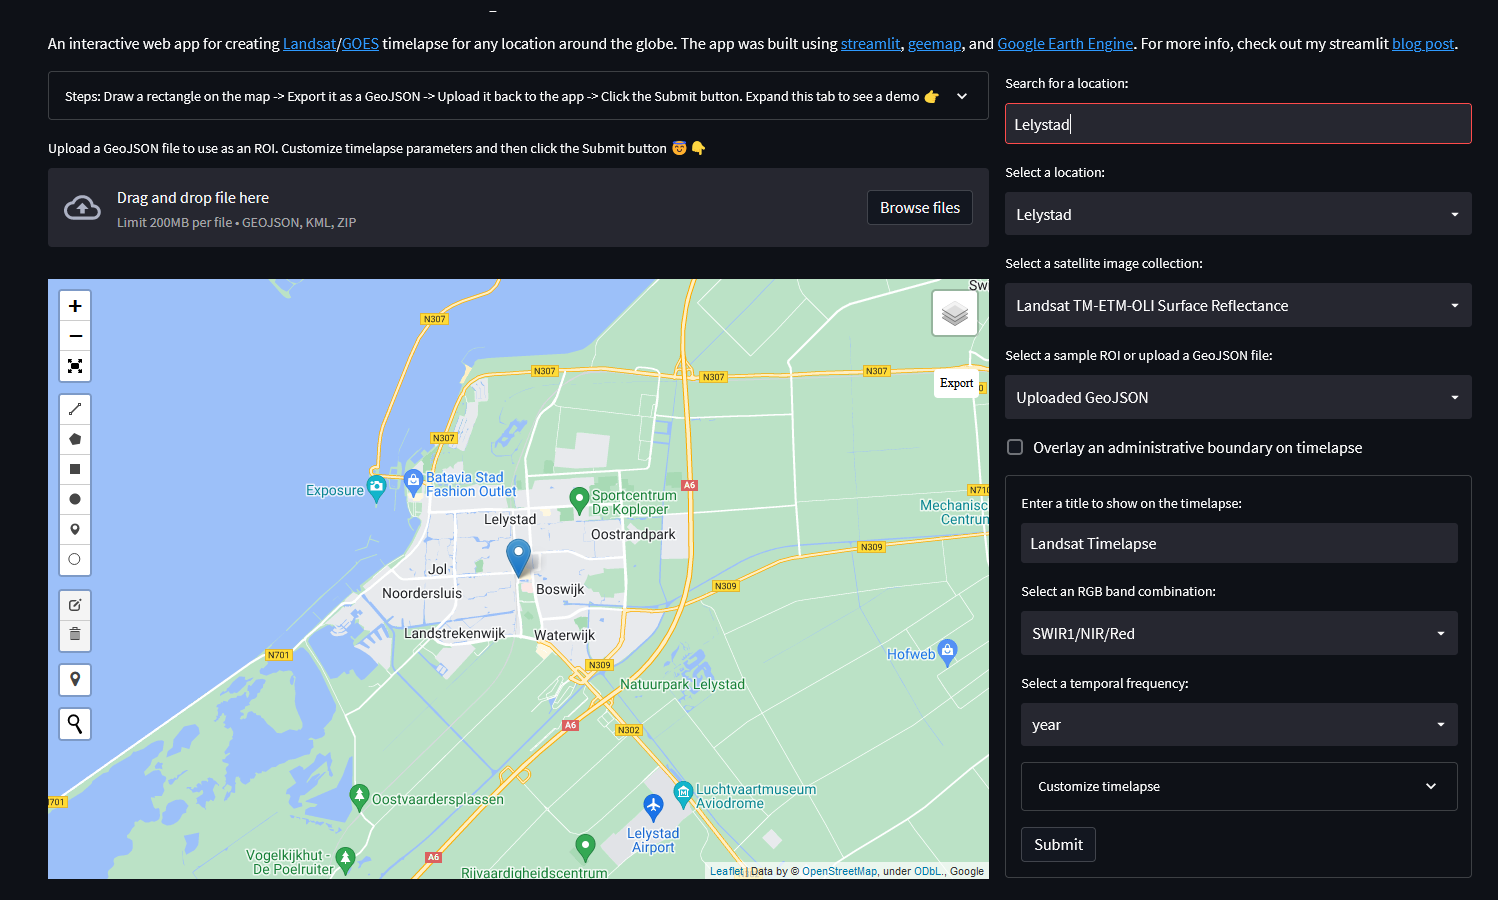
Navigate to your area of interest in the interactive map with Google Earth. You can also use Search for a location on the right side of the page.
3. Search for Lelystad, the city that is closest to the Marker Wadden. Press Enter to search.
4. When the location is found it shows up in the interactive map.
5. To find the Marker Wadden, pan to the North and locate it just a little North West of Lelystad.
6. Click the rectangle in the panel on the left and draw a rectangle that covers the area of interest.
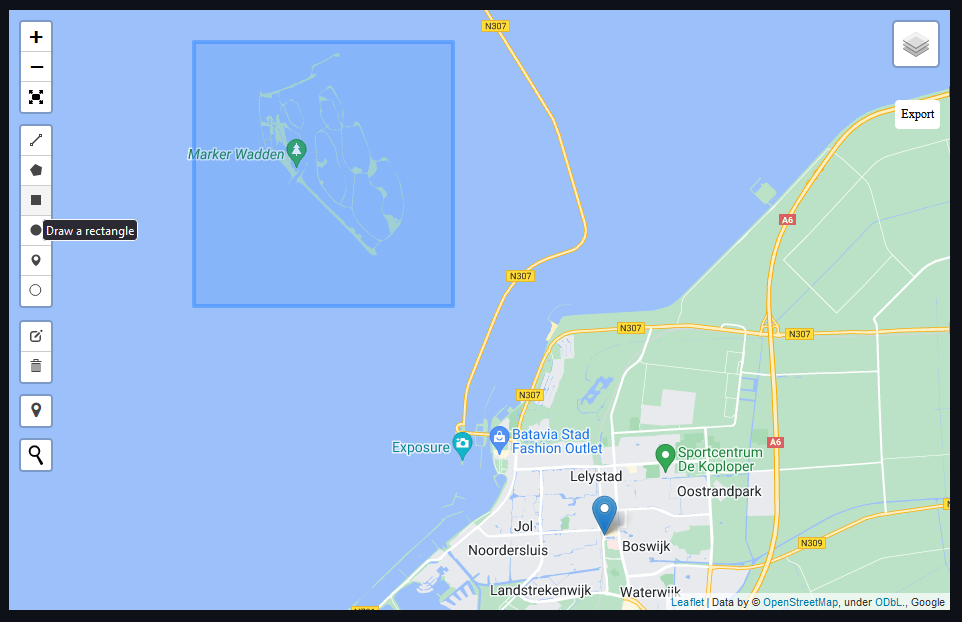
Note that when you make the area too large, it will not work and you might get errors.
7. Click Export to save the rectangle as a GeoJSON file. This is a vector format. You can also create and read GeoJSON files in QGIS.
8. Load the saved GeoJSON file by dropping it on the page or browsing to the file.
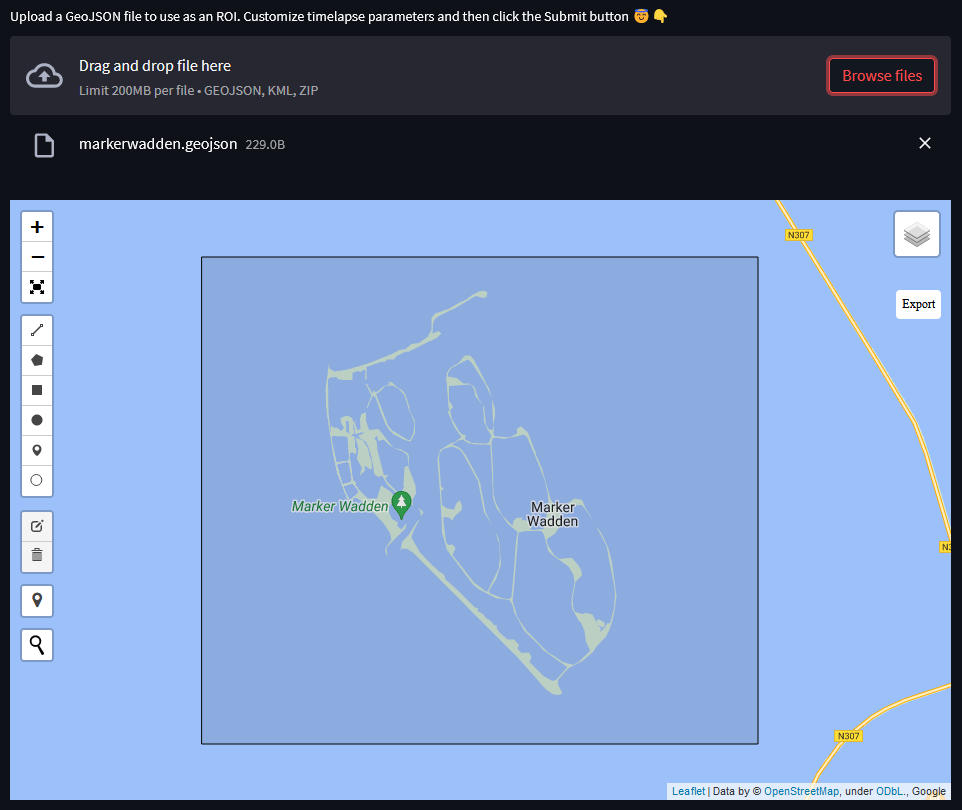
The polygon loads into the interactive map. Now the panel on the right side can be used to setup the timelapse.
3. Configure your Timelapse
In this section we'll configure the timelapse parameters in the panel on the right side of the web page.
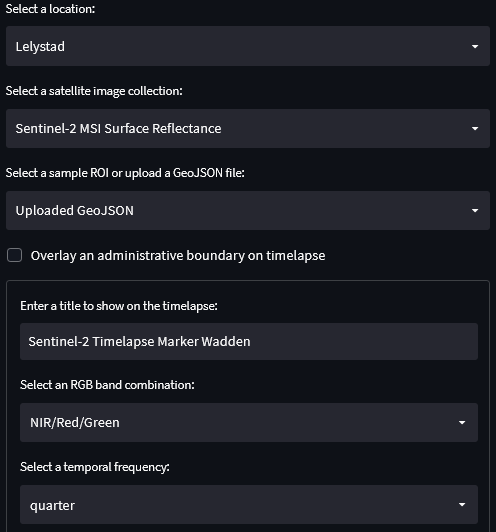
1. At Select a satellite image collection choose Sentinel-2 MSI Surface Reflectance. Landsat has a longer time series, but the Marker Wadden were constructed between 2016 and 2021, which falls within the temporal coverage of Sentinel-2, which has a higher spatial resolution.
2. At Enter a title to show on the timelapse add "for the Marker Wadden" to the existing text.
3. At Select an RGB band combination choose NIR/RED/Green. We choose NIR, because when plants start growing in the constructed wetland, they will reflect a lot in the near infrared part of the electromagnetic spectrum. Those areas will show up as red pixels.
4. At Select a temporal frequency choose quarter. With months you'll get errors that it's too big.
5. Expand the Customize timelapse section.
6. Change the Frames per second to 3.
7. Change the end year to 2021.
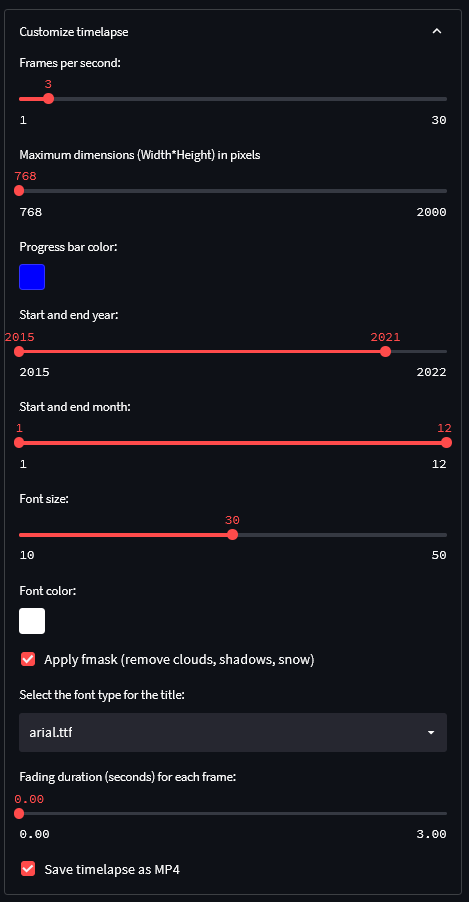
8. Leave the rest as default and click the Submit button.
9. Save the animated GIF and MP4 when it's ready by clicking right.
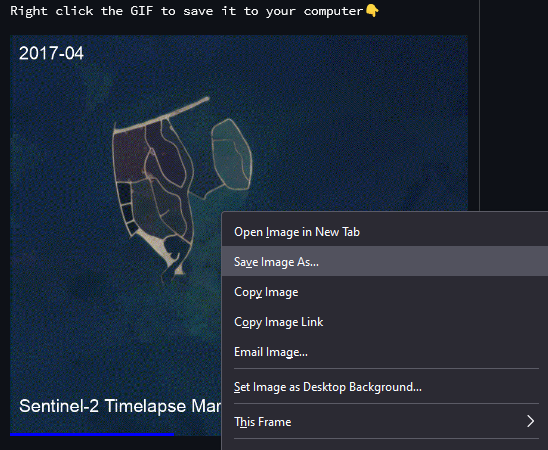
Check the result.