Tutorial: Zonal statistics and area computation
| 站点: | OpenCourseWare for GIS |
| 课程: | QGIS for Precision Agriculture |
| 图书: | Tutorial: Zonal statistics and area computation |
| 打印: | Gastgebruiker |
| 日期: | 2026年06月20日 星期六 01:31 |
1. Introduction
In this tutorial you'll learn how to use zonal statistics.
With zonal statistics you can calculate statistics of a raster layer for each polygon in a polygon vector layer.
In this tutorial you'll first download a recent Sentinel 2 image. Next, you'll calculate the Normalized Difference Vegetation Index (NDVI) from the Sentinel 2 bands, using the Raster Calculator of QGIS. Next, you'll use the parcel layer from a previous tutorial to calculate the mean, standard deviation, minimum and maximum value of NDVI for each parcel.
The tutorial concludes with adding the surface area and the perimeter of the parcel polygons to the attribute table of the parcels.
2. Download a recent Sentinel 2 image
We'll start with downloading a recent Sentinel 2 image for our study area. We'll use the red and near infrared (NIR) bands in the next section to calculate NDVI. The spatial resolution of the visual and NIR bands is 10 m.
To download Sentinel 2 bands, we'll use the STAC API Browser plugin. STAC stands for SpatioTemporal Asset Catalogs. It is a standard for sharing spatio-temporal data.
1. Open QGIS Desktop with the same QGIS project from the previous tutorial. At least make sure that you have the parcels and Luchtfoto Actueel Ortho 8cm RGB layers visible in the map canvas.
2. Install the STAC API Browser plugin from the plugins manager: in the main menu go to Plugins | Manage and Install Plugins....

3. In the Toolbar, click the  icon to open the STAC API Browser dialog.
4. Choose the Microsoft Planetary Computer STAC API, Fetch collections. Choose Sentinel-2 Level-2A.
5. Check the box to Filter by date and choose a date range of the past month.
6. Check the box for Extent and use the extent of the parcels layer that you've created before.

7. Click Search.
Now you'll see the search results.You'll see a preview of the image and a description with the acquisition date and the cloud cover percentage. If you only see clouded images, extend the date range.
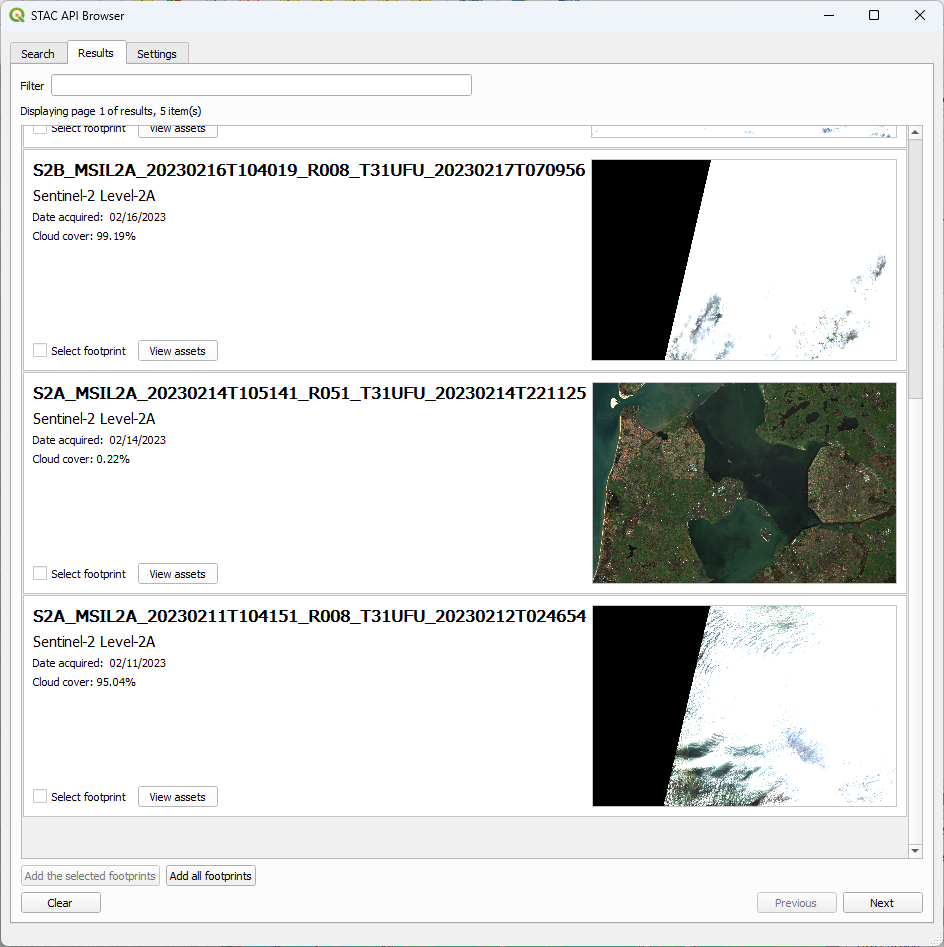
8. If you've found a useful cloudless image, click View assets.
Now you'll see the bands. For the calculation of NDVI we need the Red and Near Infrared bands, which are band 3 and 8 respectively.
9. We'll add them as temporary layers: check the boxes for Band 3 and Band 8 to Select to add as layer. Then click Add selected assets as layers (2).

10. The bands are now added to the map canvas.
Note that they are temporary layers. If you want to keep them, you should have chosen Select to download or you can make them now permanent by exporting them to a GeoTIFF on your disk.
Now we're ready to calculate the NDVI in the next section.
3. Calculate NDVI
With the Sentinel 2 bands downloaded in the previous section we can now calculate the Normalized Difference Vegetation Index (NDVI). The equation for NDVI is:

NIR is the Near Infrared band and Red is the red band. The equation results in values between -1 and 1. Values from 0 to 1 indicate an increase in green vegetation/crop cover.
We'll use the Raster Calculator to calculate NDVI.
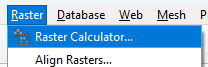
1. Open the Raster Calculator: in the main menu choose Raster | Raster Calculator....
2. In the Raster Calculator write the expression from the screenshot below and save the results to a GeoTIFF with the date in the file name.

3. Click OK to perform the calculation.
When the calculation is done, the image will show up in the map canvas.
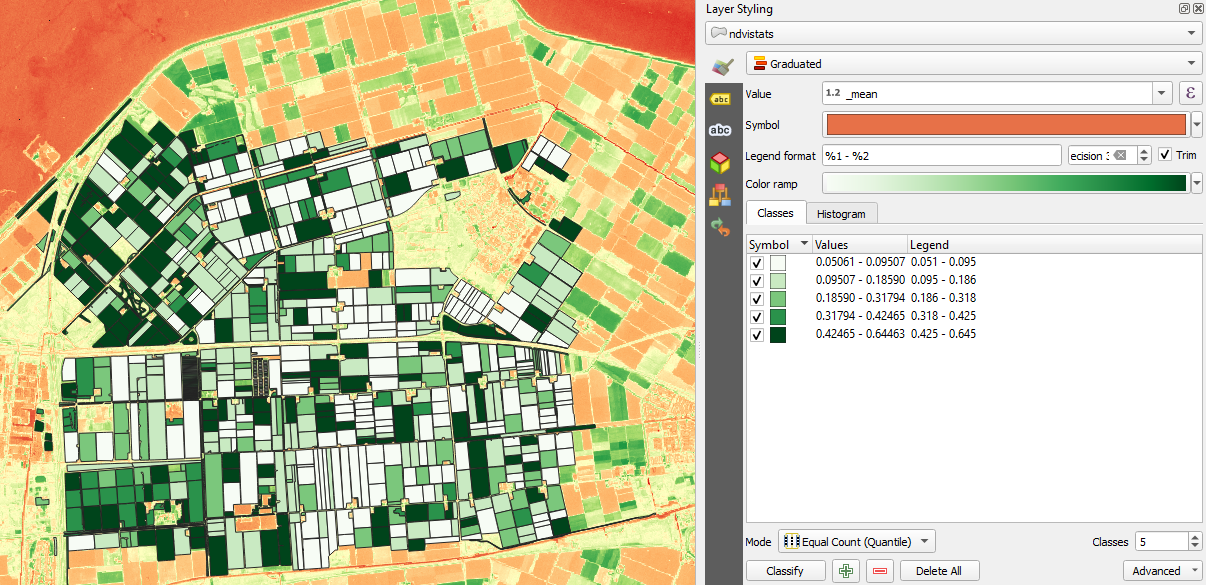
4. Go to the Layer Styling panel and use the Singleband pseudocolor renderer to assign a useful colour ramp to the NDVI values.

We can already recognise the parcels. In the next section we'll calculate the zonal statistics for the each parcel.
4. Calculate zonal statistics
In this section we'll use a tool from the Processing Toolbox to calculate the zonal statics from the NDVI layer using the parcel polygons. The Processing Toolbox
in QGIS provides a lot of tools for processing GIS data. Besides QGIS
tools, it also has tools from GDAL, GRASS, and SAGA that are very
useful.
1. You can activate the Processing Toolbox by choosing Processing | Toolbox from the main menu.
Now the Processing Toolbox panel shows up.
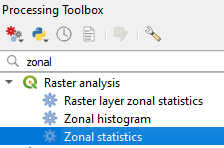
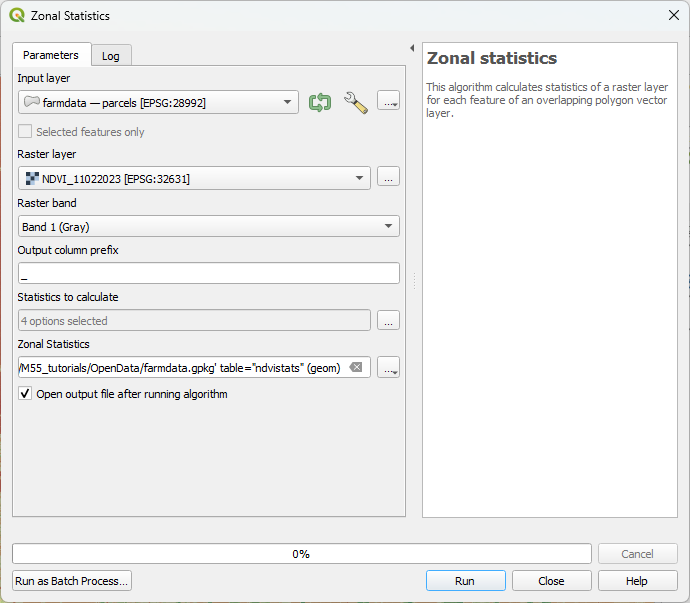
2. In the Processing Toolbox click on Raster analysis | Zonal statistics (you can use the search box to search for it):
3. In the dialogue choose parcels as Input layer and NDVI_11022023 as Raster layer. We leave the Output column prefix as default.
You can use the Output column prefix if you want to add the zonal statistics of other raster layers later. Then you want use here NDVI_ and if you do it for the DEM, you'll use DEM_. In this way you can distinguish the results in the attribute table.
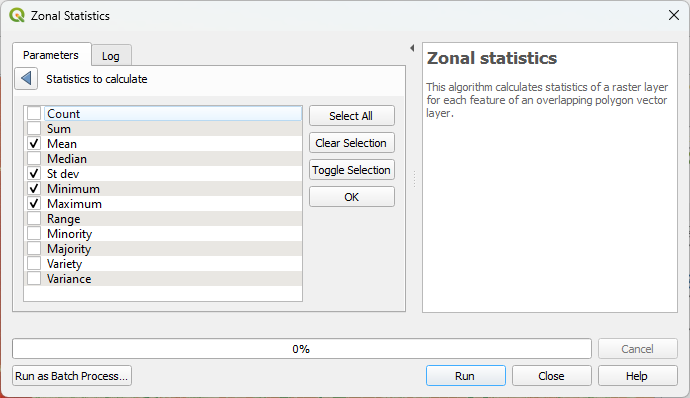
4. Click on  to choose the statistics that you want to calculate. Here choose Mean, St dev, Minimum and Maximum and click OK to return.
5.
At the Zonal Statistics field use the dropdown menu to choose Save to
GeoPackage. There browse to the GeoPackage of this project and indicate
in the popup that you want to use ndvistats as the layer name.
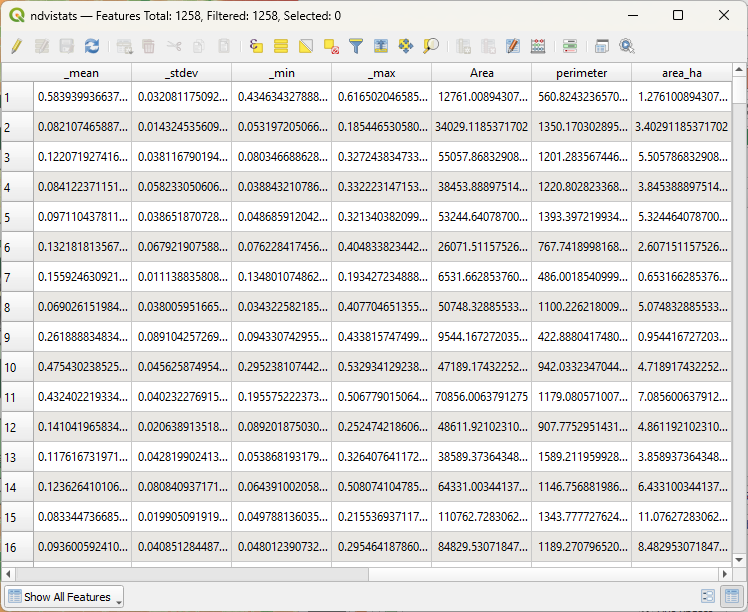
5. Calculate area and perimeter of parcels
Often it's useful to know the area and the perimeter of agricultural fields. In this section we'll add the area and perimeter to the attribute table. We'll also convert the area units.
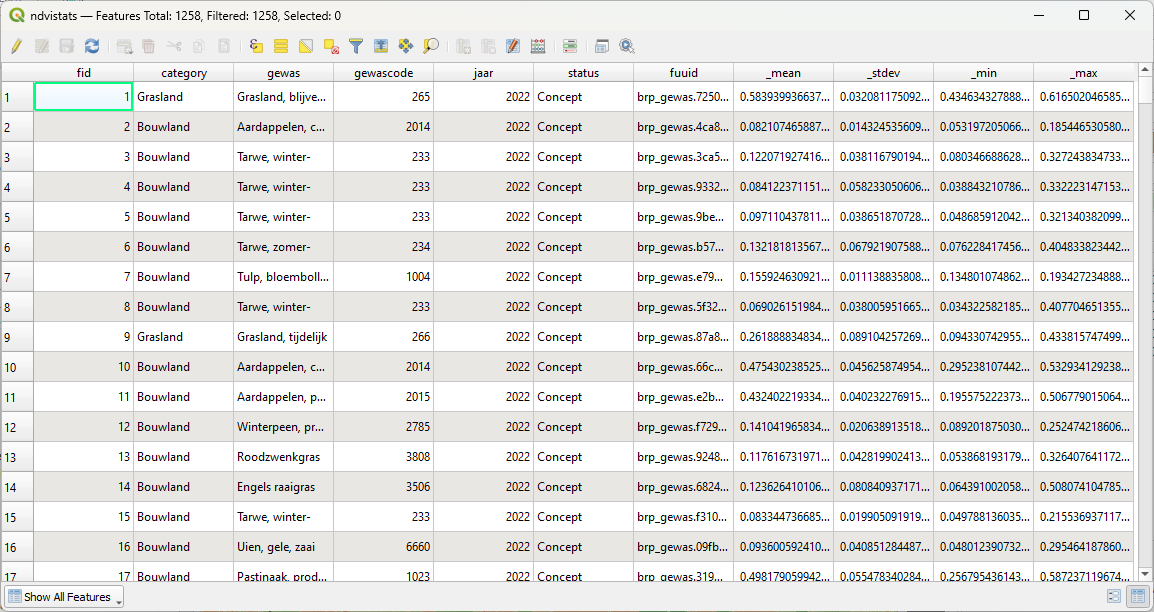
1. Open attribute table ndvistats layer
2. Click  to open the Field Calculator dialog.
3. Type Area at Output field name and choose Decimal number (real) for Output field type.
4. In the middle section, expand the Geometry functions and double-click on $area to add it to the expression. You can read the help string on the right side of the dialog.
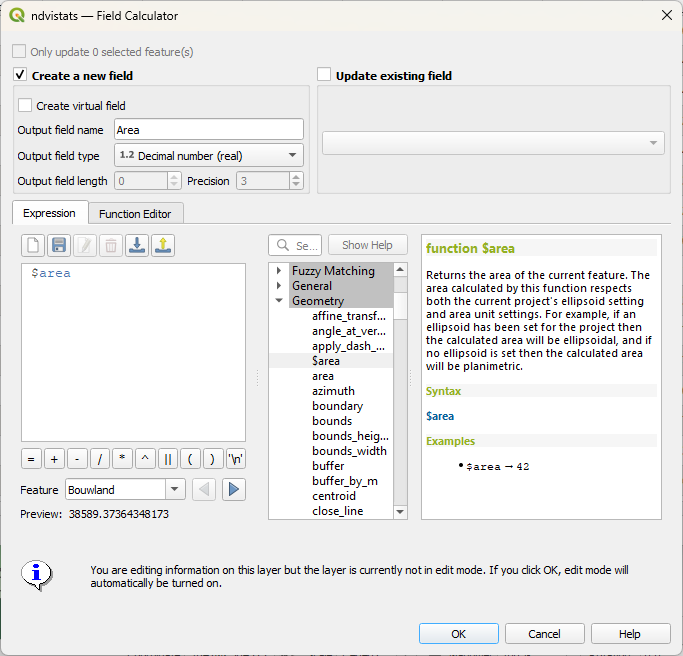
5. Click OK.
6. Check the new Area attribute.
7. Repeat the steps to add the perimeter. You can use the $perimeter function in the expression.
- What are the units of the calculated area and perimeter?
6. Conclusion
In this tutorial you've learned to:
- Download a recent Sentinel 2 image using the STAC API Browser plugin
- Calculate NDVI using the Raster Calculator
- Calculate statistics per parcel using Zonal Statistics
- Add the area and perimeter of parcels to the attribute table using the Field Calculator
If you would like to learn more about zonal statistics, please check the GIS OpenCourseWare platform.