Tutorial: Create a field data collection app with Mergin Maps
| Site: | OpenCourseWare for GIS |
| Cursus: | QGIS for Precision Agriculture |
| Boek: | Tutorial: Create a field data collection app with Mergin Maps |
| Afgedrukt door: | Visitante |
| Datum: | zaterdag, 20 juni 2026, 02:54 |
Inhoudsopgave
- 1. Introduction
- 2. Install the Mergin Maps app and create an account
- 3. Configure the Mergin Maps plugin for QGIS
- 4. Create a new Mergin Maps project
- 5. Add online background layers
- 6. Add offline background layers
- 7. Setup the survey layers
- 8. Create Map Themes
- 9. Setup the Project Properties
- 10. Synchronise the QGIS project with Mergin cloud service
- 11. Synchronise the Mergin Maps project with a mobile device
- 12. Using the Mergin Maps app for field surveys
- 13. Synchronise the survey in QGIS
- 14. Monitor the project in the Mergin Maps dashboard
- 15. Conclusion
1. Introduction
In this tutorial we're going to use Mergin Maps to create a field data collection app. With Mergin Maps you can setup a field mapping project in QGIS, synchronize the project with the cloud and with your mobile phone. The Mergin Maps app is available on Android, iOS and Windows.
You can use the app with online and offline maps in the field. It also allows you to collaborate in field survey projects and takes care of the version management.
After data collection, you can synchronize the project in QGIS and use the data for further processing.
This tutorial will guide you through the steps for creating a field data collection app for crop mapping.

The tools are open source. Here we'll use the free plan for the cloud service provided by Mergin Maps, which offers 100 MB storage. If you need more, you can install the service on your own server or choose a paid plan.
2. Install the Mergin Maps app and create an account
Before we start our mapping project, we'll install the Mergin Maps app on our mobile phone and create an account. The steps below are from the Mergin Maps documentation.
1. Download Mergin Maps to your Android device, iPhone or iPad. You can find it in the app store of your platform:

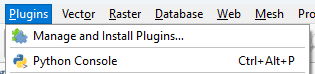
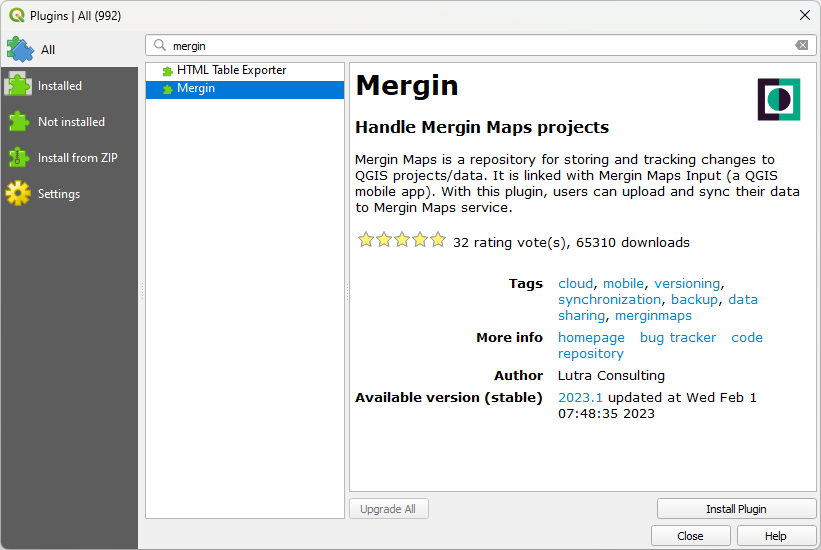
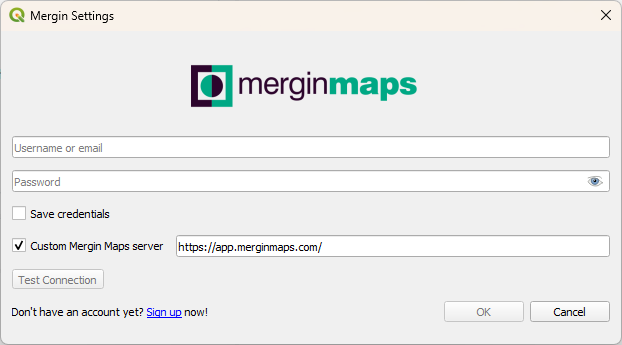
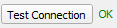
3. Configure the Mergin Maps plugin for QGIS
The next step is to install the Mergin plugin in QGIS. With the plugin we can:
- Initialize a field survey project for Mergin Maps
- Synchronize the project with the Mergin cloud service

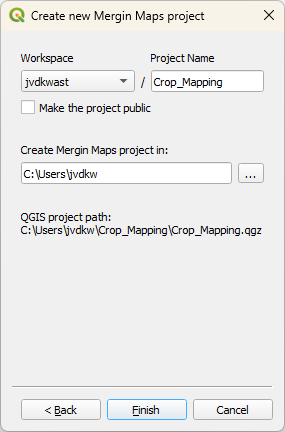
4. Create a new Mergin Maps project
 .
.
5. Add online background layers
For our crop mapping survey it's useful to add some layers to orient ourselves.
We're going to add from the PDOK Services plugin:
- Aerial photograph RGB: Luchtfoto Actueel Ortho 8cm RGB (WMTS)
- Aerial photograph Infrared: Luchtfoto Actueel Ortho 25cm Infrarood (WMTS)
- Soil map: Bodemvlakken (WMS)
- Parcels: BRP Gewaspercelen (WMS)
6. Add offline background layers
In the previous section we've added online background layers to our survey project. Sometimes we don't have internet in the field. For those cases we can create offline layers from the online layers and we can add other layers that we need. Note that the storage in the free plan of Mergin Maps is 100 MB, so you can't have too many detailed offline layers.
Let's create an offline layer of the Luchfoto Actueel Ortho 8cm RGB layer.
1. Make sure that in the Layers panel only the Luchfoto Actueel Ortho 8cm RGB layer is visible.
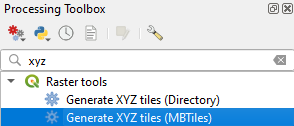
2. Go to the Processing Toolbox.
3. Go to Raster Tools | Generate XYZ tiles (MBTiles).
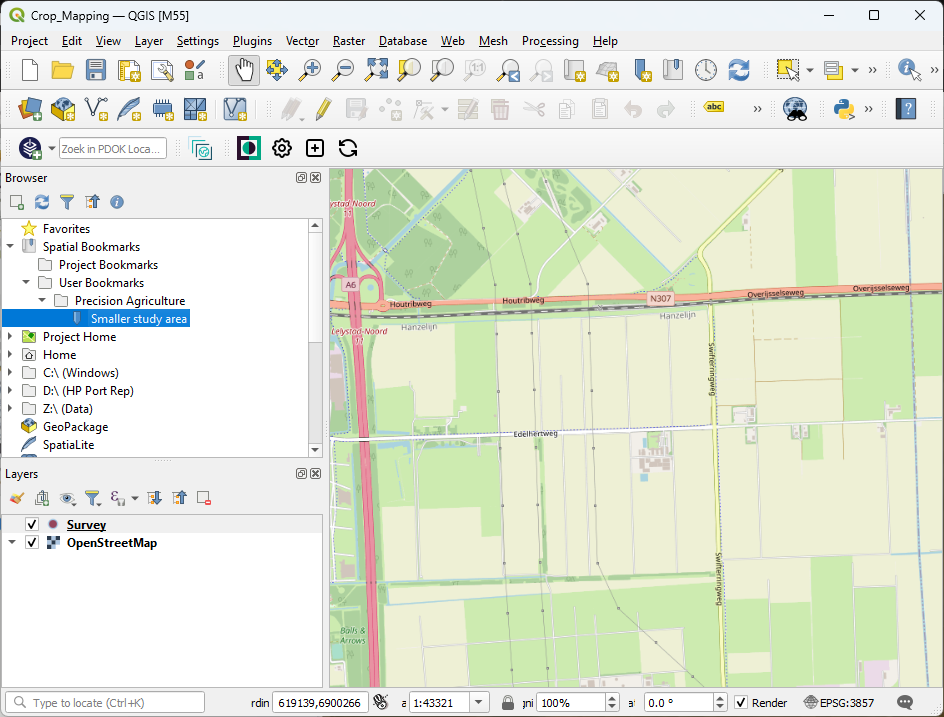
4. In the Generate XYZ Tiles (MBTiles) dialog choose the Map Canvas Extent as Extent (make sure you're still zoomed to the Spatial Bookmark of the Smaller study area!).
5. Here we keep the Minimum zoom and Maximum zoom level at 17. You can give a range, but then also the file size will increase.
6. Save the result (orthophoto.mbtiles) to the same folder as your Mergin Maps project. Only then it will be later synchronized.
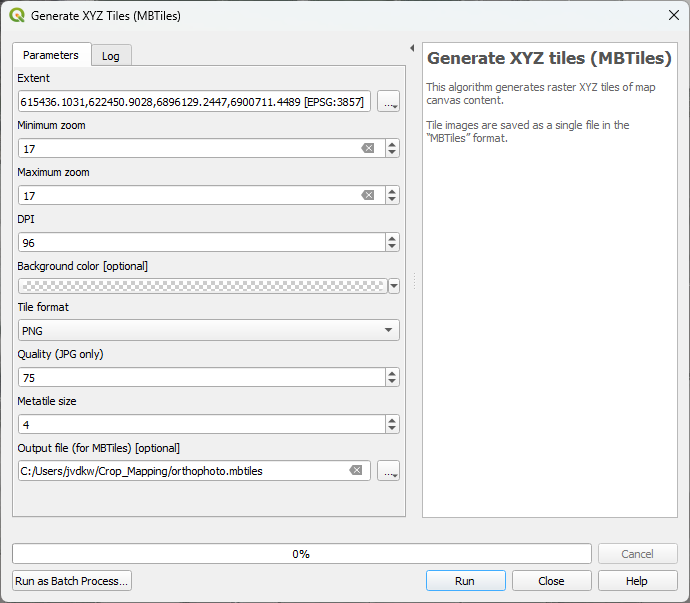
7. Click Run.
8. Click Close to close the dialog after the processing has completed.
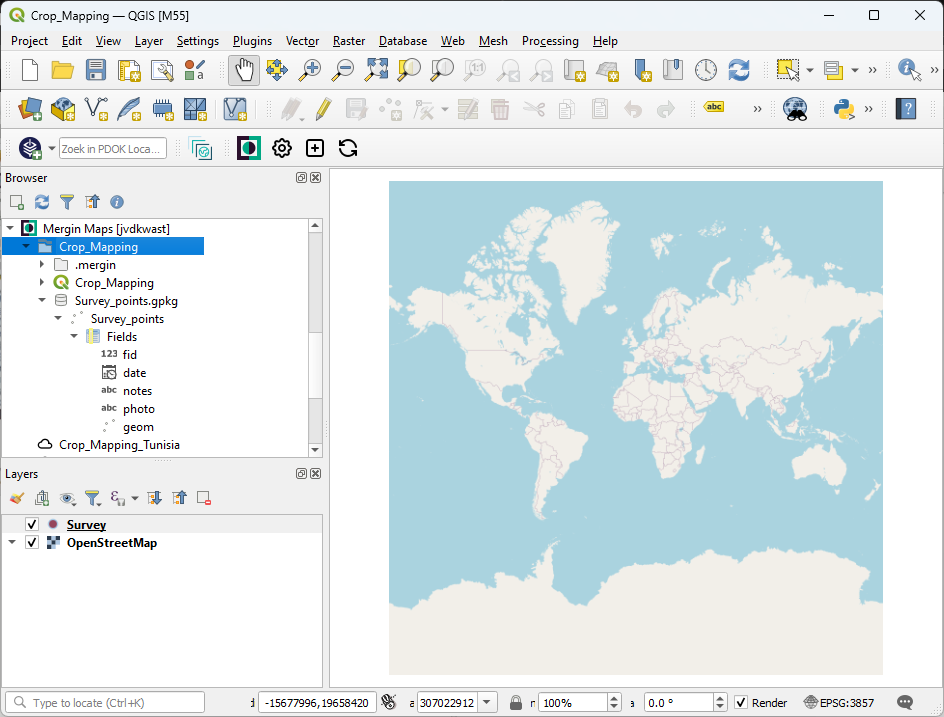
9. In the Browser panel go to Project Home to see all the files in your project folder and drag the orthophoto.mbtiles layer to the map canvas.
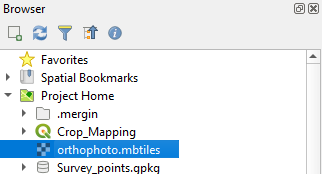
10. Check the result.
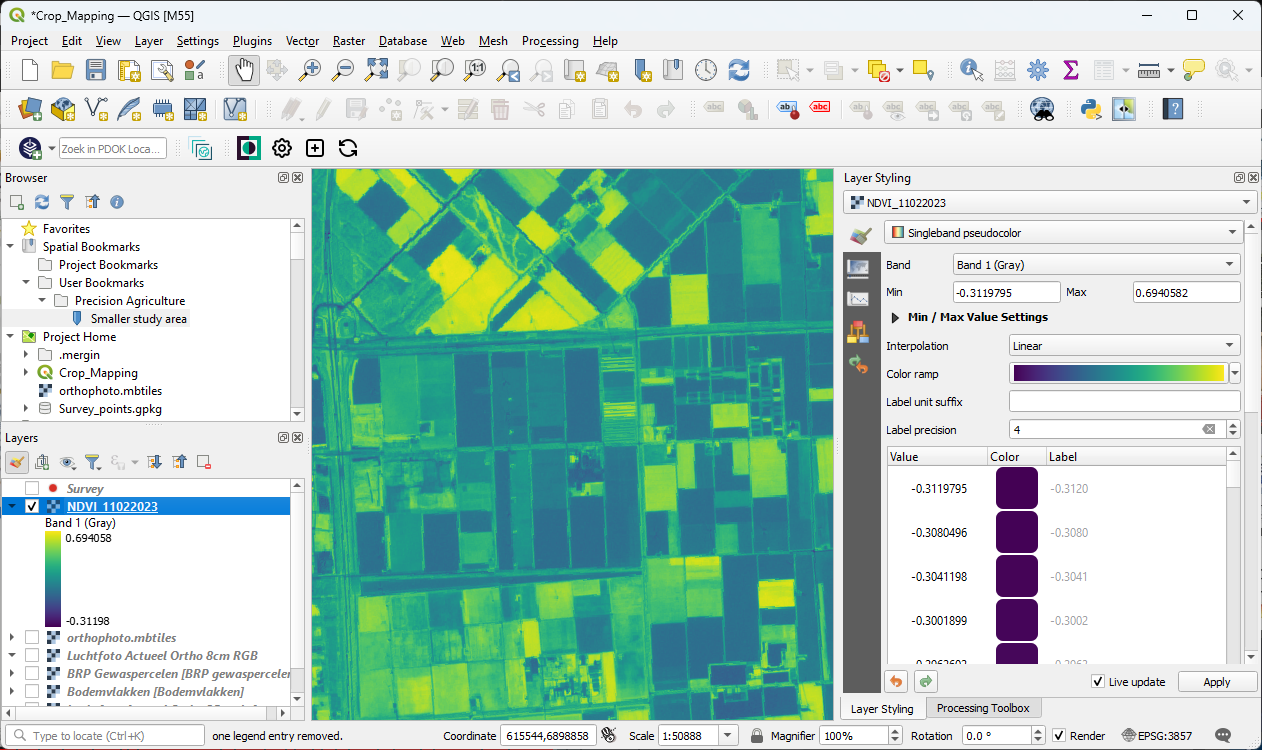
Of course we can also add existing raster layers to our project. Here we'll add the recent NDVI layer that we've created in a previous tutorial.
11. Locate the NDVI_11022023.tif layer in the Browser panel and drag it to the map canvas.
12. Because the layer is not in our project folder, you need to first export the layer: in the Layers panel right-click on NDVI_11022023 and choose Export | Save as... from the context menu.
13. Save the layer as a GeoTIFF in the correct folder and choose the map canvas extent for the extent (make sure you're still zoomed in to the Smaller study area).
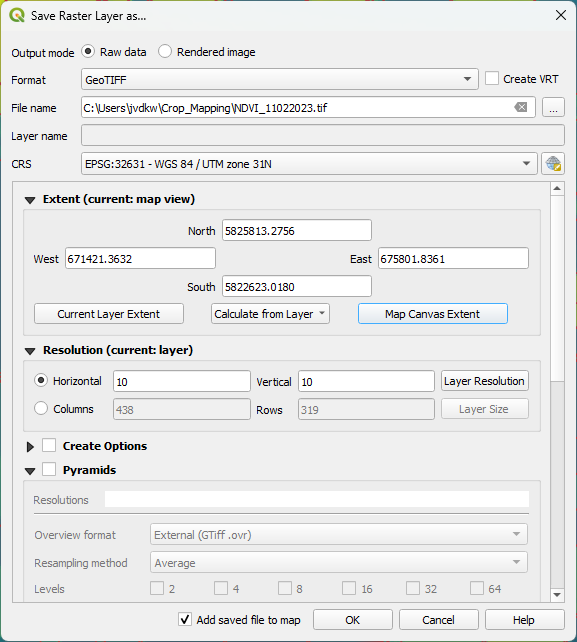
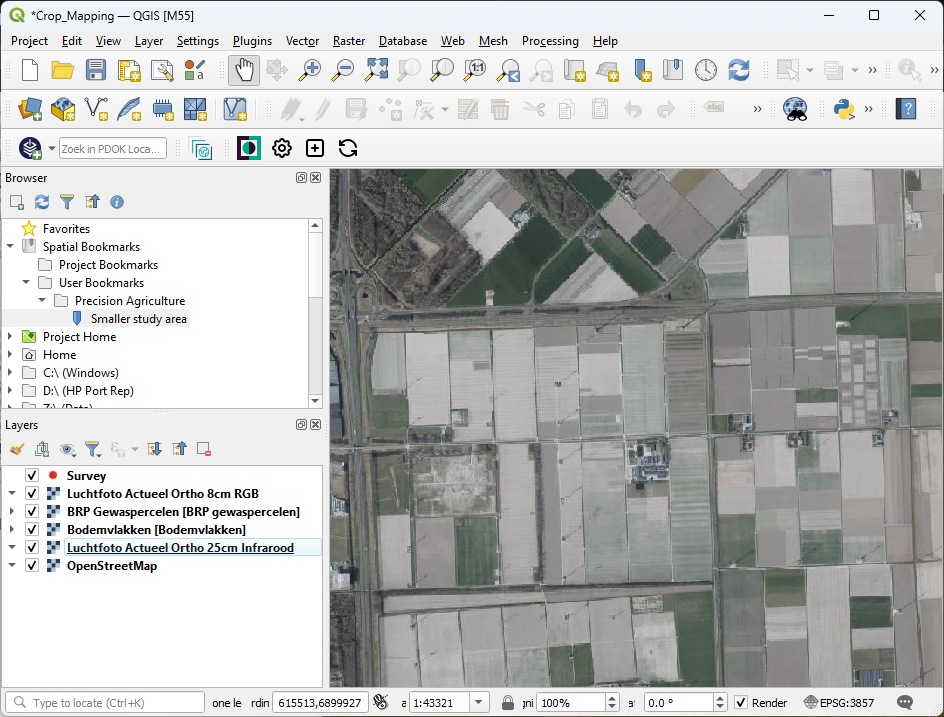
14. Use the Layer Styling panel to style the NDVI layer with a color ramp.
Next, we'll setup the survey layers.
7. Setup the survey layers
We're going to setup two survey layers:
- The Survey point layer
- A parcels polygon layer to update the crop type
7.1. Setup the Survey point layer
The default project already has a Survey point layer. You can use any vector layer for surveying, but here we'll add fields to the existing Survey point layer.
1. Open the attribute table of the Survey layer: in the Layers panel right-click on the Survey layer and choose Open Attribute Table from the context menu.
You can see that it already has some attributes: fid, date, notes, photo. Let's add a few more, related to crop mapping.
2. Click  to switch to editing mode.
3. Click  to add a new field.
Let's add a field for an observation number.
4. In the Add Field dialog type Obs for the Name, use Text (string) for type (in that way we can add alphanumeric codes for our observation numbers) and use a Length of 5 characters.
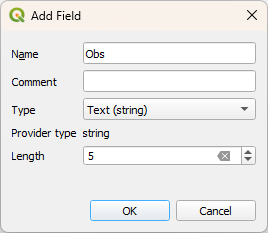
5. Click OK to add the new field to the attribute table.
6. Repeat this for the following attributes:
| Field name |
Type | Length |
|---|---|---|
| Name | Text (string) |
50 |
| LandCover | Text (string) |
50 |
| Crop | Text (string) |
50 |
| WaterSource | Text (string) | 50 |
| IrriMethod | Text (string) |
50 |
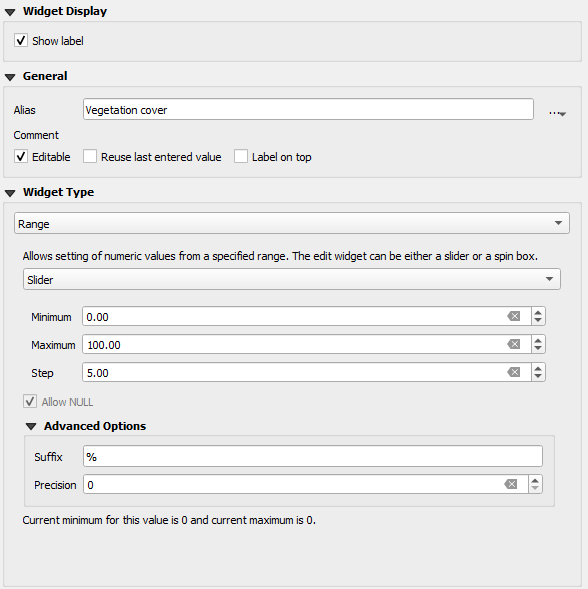
| Coverage | Decimal number (real) |
3 |
7. Click
to toggle off editing and save the changes.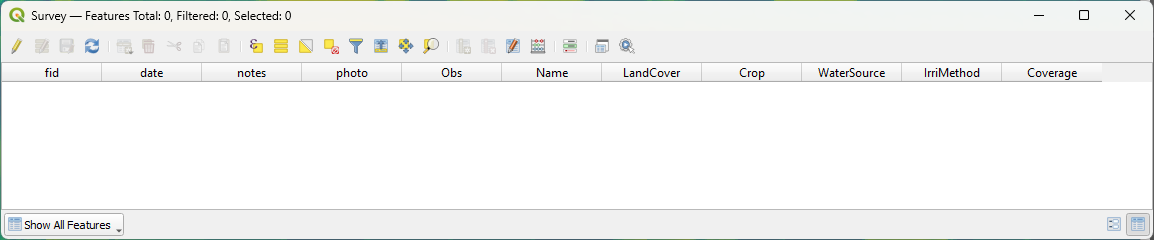
Now let's create the widgets for the observation form.
Mergin Maps supports many widgets. You can check them here.
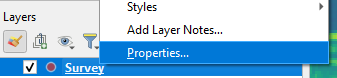
8. To setup the Form Widgets, right-click on the Survey layer in the Layers panel and choose Properties... from the context menu.
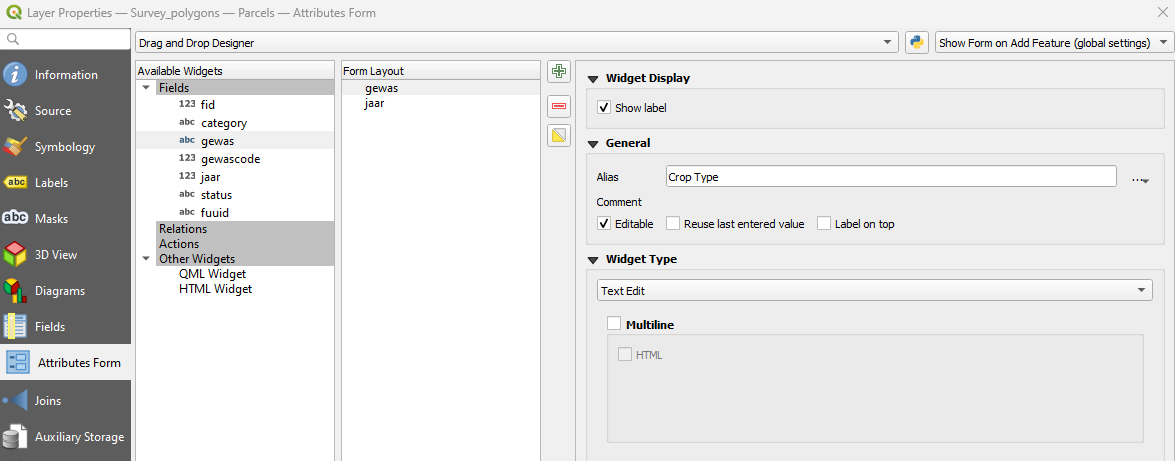
9. In the Layer Properties dialog go to the Attributes Form tab and choose Drag and Drop Designer from the drop-down menu.
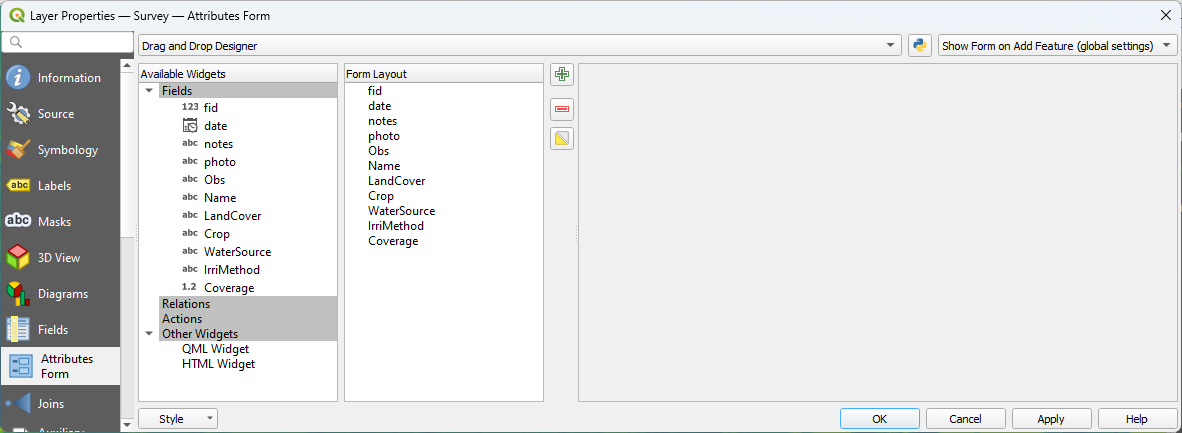
In this dialog we can interactively create our field form with the widgets.
10. First, we don't want to use the fid field. Select fid from the Form Layout panel and click the  icon.
icon.
11. Lets rearrange the items. You can drag and drop the items rearrange. Here we use this order:

Now we'll configure the form widgets.
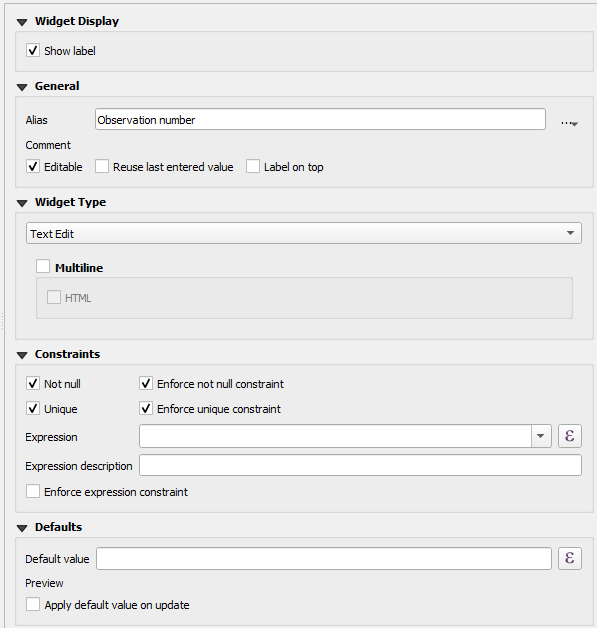
12. Click on Obs in the Form Layout panel.
Now you can see the widget settings in the right panel of the dialog.
13. We can give more human readable names to the fields using and alias. In the Alias field of Obs type Observation number.
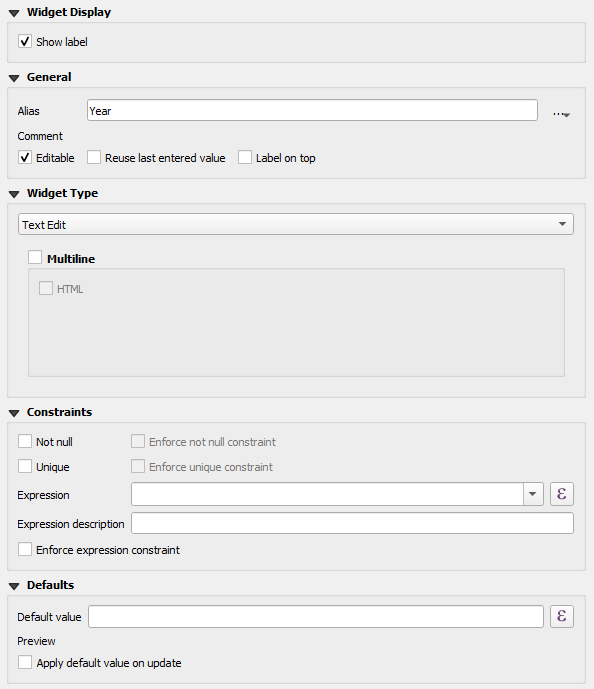
14. Under Constraints we check the boxes for Not null and Unique, to make sure that a value is filled in and that the code is unique. Also check the boxes to enforce the constraints. Keep the rest as default.
15. Now click the date field in the Form Layout panel.
16. For Alias type Date/Time.
17. For Widget Display choose Custom and type dd-MM-yyyy HH:mm:sss for the format You can see the result in the Preview.
18. Set the Contraints to Not null.
19. Under Defaults we can set an expression so the current date and time are used. Type
$now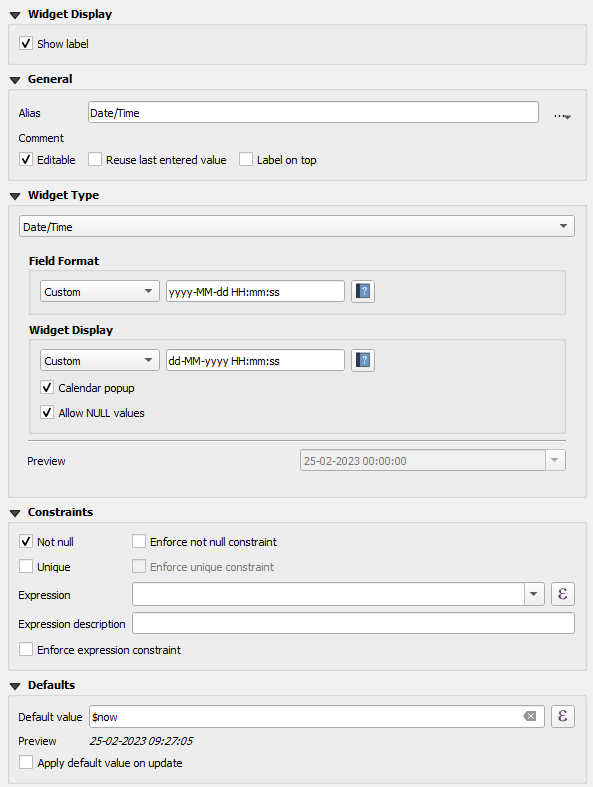
20. Now choose Name from the Form Layout. Use the following settings: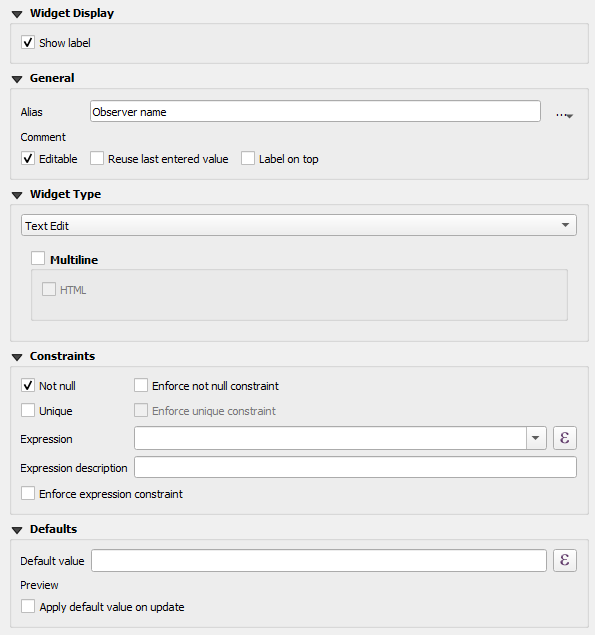
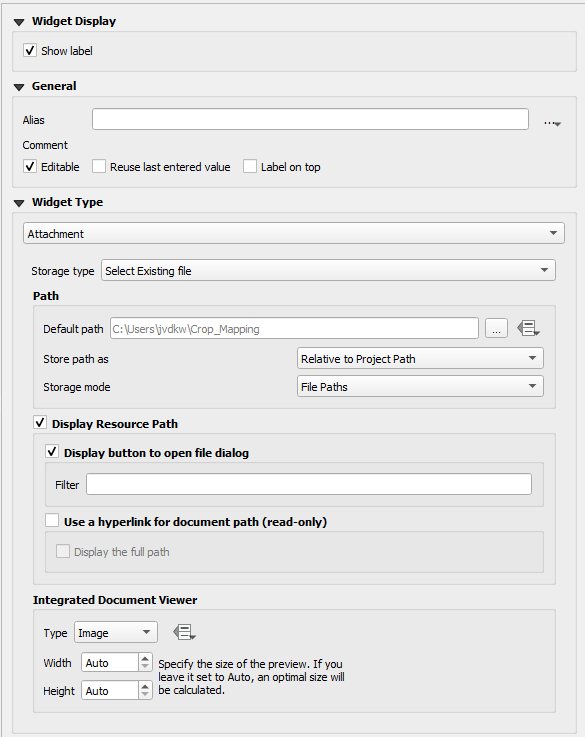
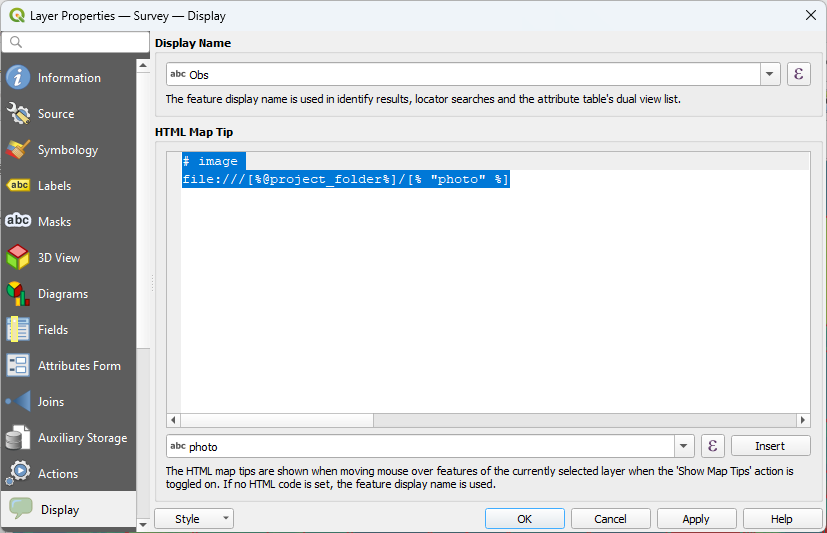
21. For the photo field we should keep the default settings, so the relative path to the picture is stored and the Integrated Document Viewer is used to show the image. Only type Picture at Alias.
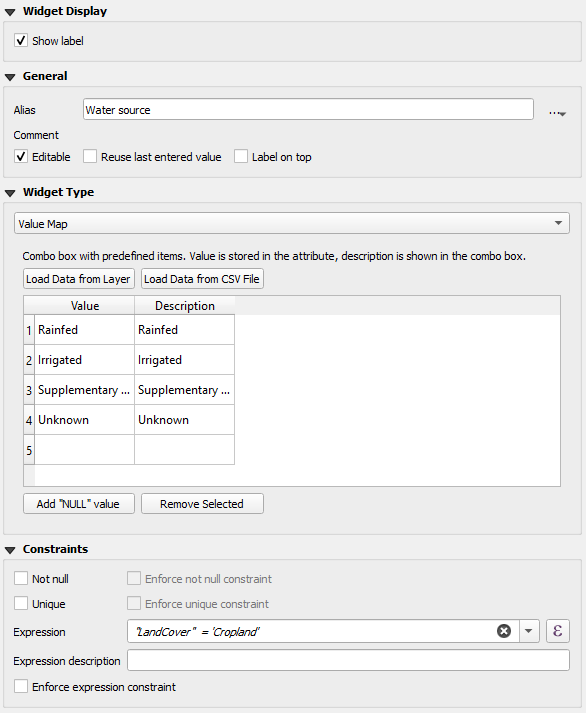
22. For LandCover type the Alias Land cover type.
For the land cover types we would like to use a drop-down menu. We can define that with the Value Map widget.
23. Under Widget Type choose Value Map and use the following Value/Description combinations:
| Value | Description |
|---|---|
| Cropland | Cropland |
| Tree Cover | Tree Cover |
| Shrubland | Shrubland |
| Grassland | Grassland |
| Wetland | Wetland |
| Artificial | Artificial |
| Bare soil | Bare soil |
| Fallow land | Fallow land |
| Seasonal water | Seasonal water |
| Permanent water | Permanent water |
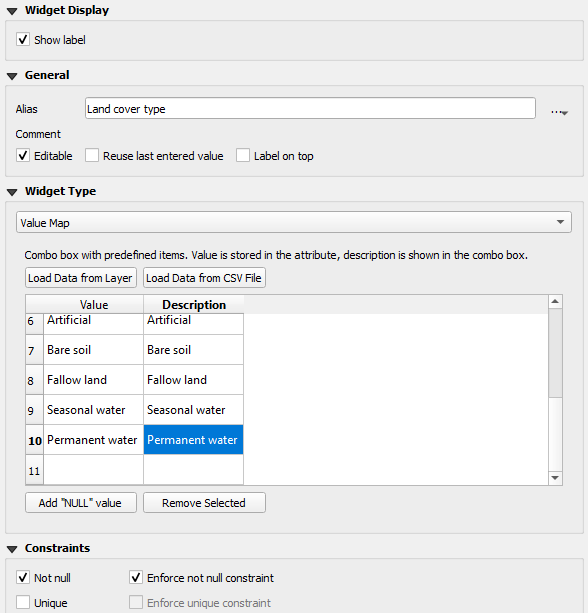
24. Use the Not Null Constraint.
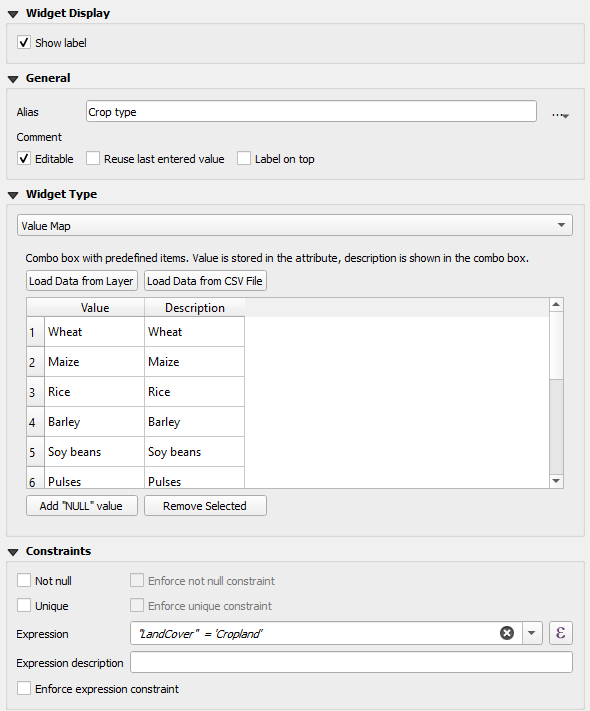
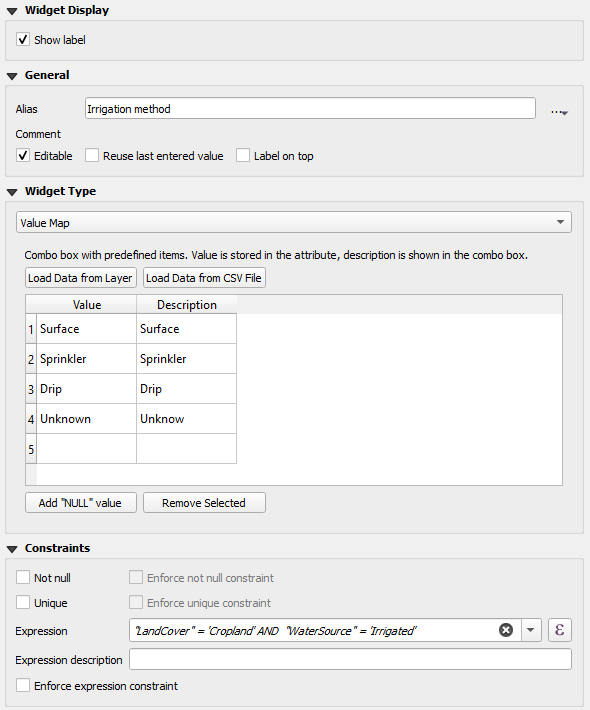
25. For Crop use the Alias Crop type.
26. Also here use the Value Map widget. Use the following Value/Description combinations:
| Value |
Description |
|---|---|
| Wheat | Wheat |
| Maize | Maize |
| Rice | Rice |
| Barley | Barley |
| Soy beans | Soy beans |
| Pulses | Pulses |
| Cotton | Cotton |
| Potatoes | Potatoes |
| Alfalfa | Alfalfa |
| Sorghum | Sorghum |
| Other | Other |
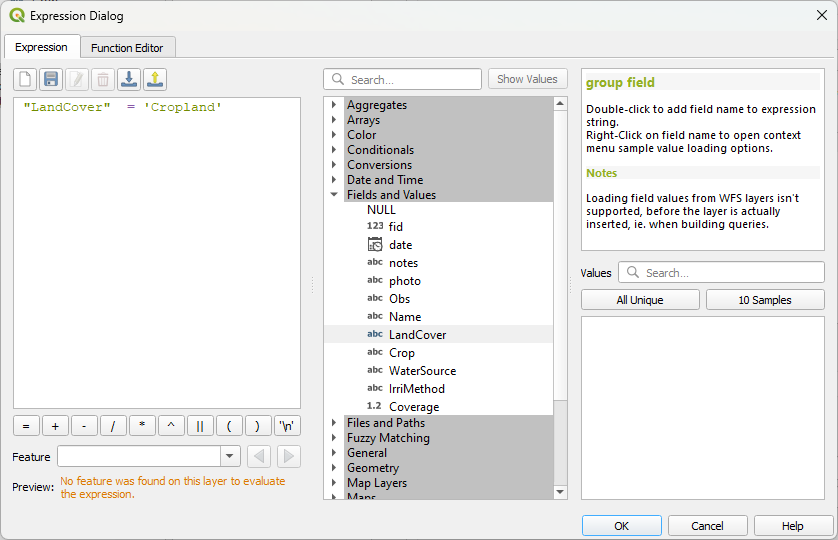
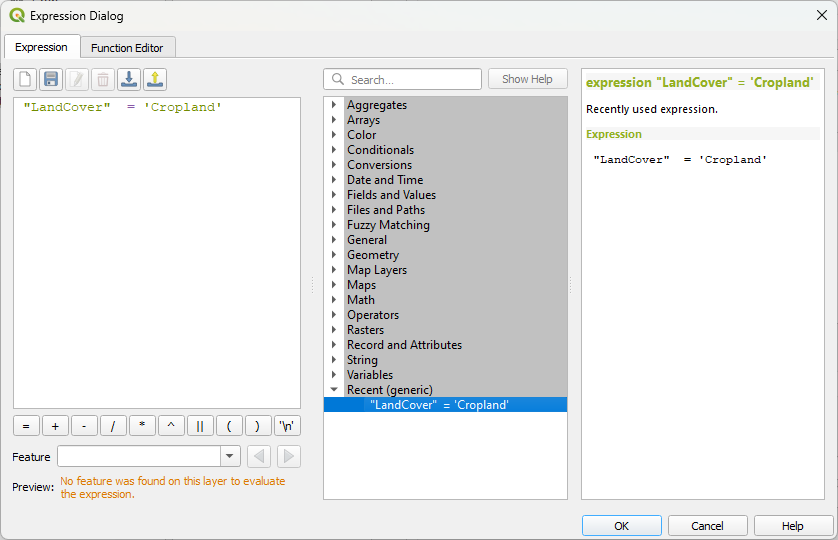
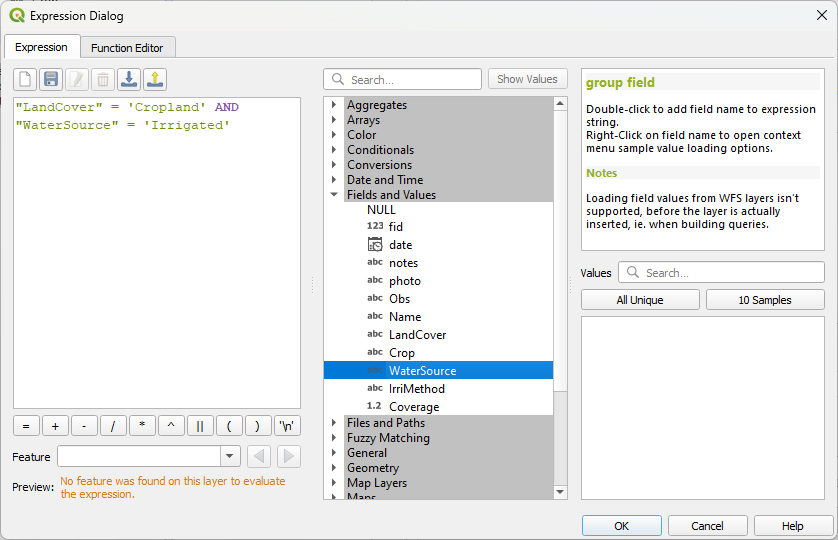
 to open the Expression Dialog.
"LandCover" = 'Cropland'

# image
file:///[%@project_folder%]/[% "photo" %]
7.2. Setup the Parcels polygon layer
We'll add a second survey layer with the parcel polygons, so we can update the crops with our field obervations.
1. Make sure you're zoomed to the study are (use the Smaller study area Spatial Bookmark if necessary).
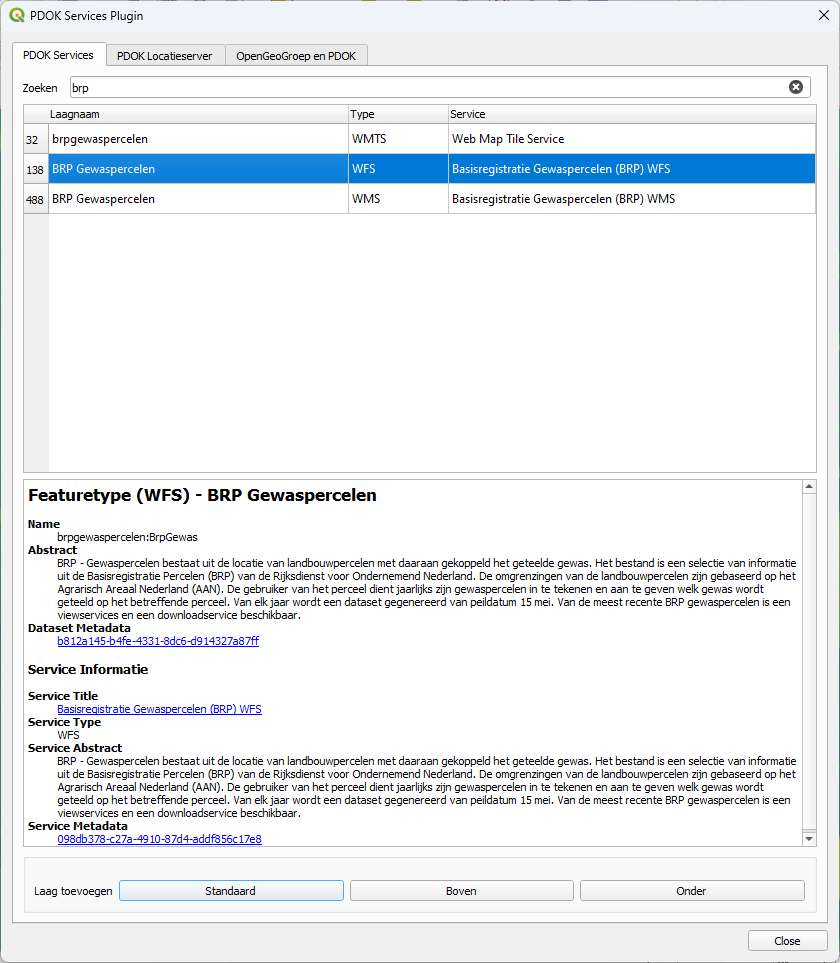
2. From the PDOK Services plugin add BRP Gewaspercelen in the WFS format to your project. Use Boven to add it to the top of the Layers panel.
We would like to edit the layer, so we'll save it as new GeoPackage layer. It is good practice to add a separate GeoPackage for each survey layer. For more good practice information check this page.
3. In the Layers panel right-click on the BRP Gewaspercelen layer and choose Export | Save Features As... from the context menu.
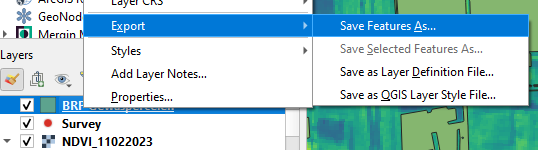
4. In the dialog, make sure that the Format is GeoPackage. Use  to browse to the folder of your project and save the new GeoPackage with the name Survey_polygons.gpkg and type Parcels as Layer name. For Extent click Map Canvas Extent, so only the parcels in the study area will be exported.
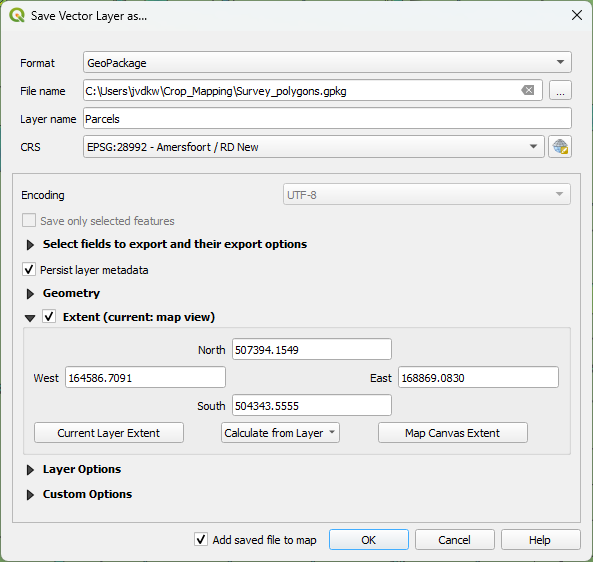
5. Click OK and wait until the Parcels layer is added to the map canvas. Then close the dialog.
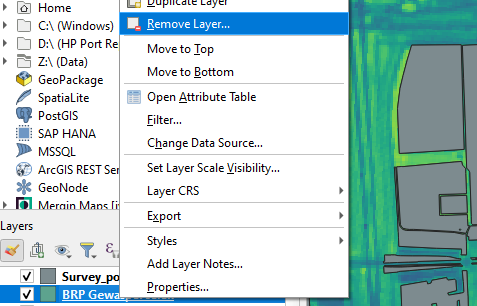
6. Remove the BRP Gewaspercelen WFS layer from the Layers panel: right-click on BRP Gewaspercelen and choose Remove Layer... from the context menu. Click OK to confirm.
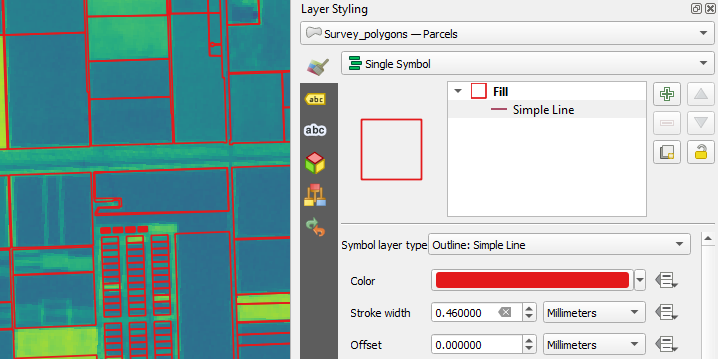
Mergin Maps will use the same style as defined in QGIS. Let's style the Parcels polygons with an outline colour.
7. Go to the Layer Styling panel and make sure that the Parcels layer is active.
8. Keep the Single Symbol renderer, but change the Symbol layer type from Simple fill to Outline: Simple Line. Choose a red colour with a Stroke width of 0.46 mm.
Also for this layer we can setup the widgets.
9. Go to the Layer properties of the Parcels layer.
10. At the Attributes Form tab, choose the Drag and Drop Designer from the drop down menu.
11. Remove all fields, except gewas and jaar.
12. For gewas use the following settings:
13. For jaar use the following settings:
14. Click OK to apply and close the dialog.
8. Create Map Themes
In Mergin Maps, you can use different map themes. This is ideal for switching between different background maps (e.g. cartography map and aerial photography). The map themes should be first set up in QGIS.
Let's start with making a map theme with the aerial photograph RGB in the background.
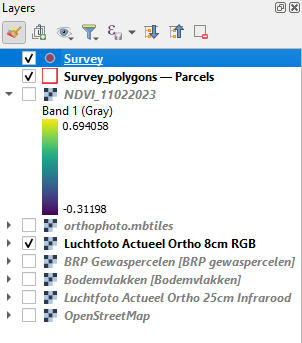
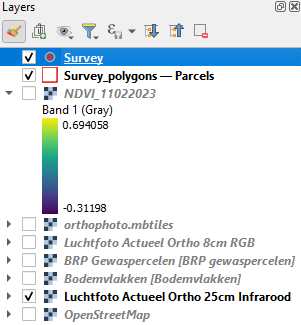
1. Make sure both the Survey and Parcels layers are visible (box checked) in the Layers panel. In all map themes these layers need to be checked.
2. Hide all other layers except the one we want to show as a backdrop. Here we check the box for Luchtfoto Actueel Ortho 8cm RGB.
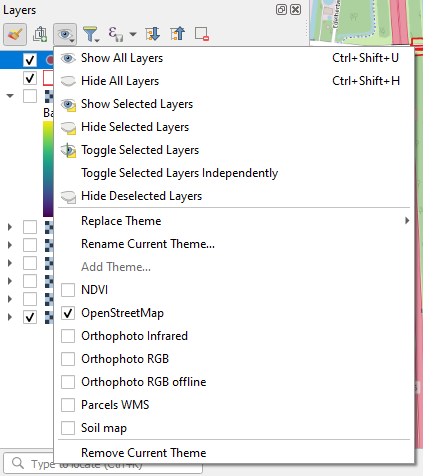
3. Click the Manage Map Themes  icon and choose Add Theme... from the context menu.
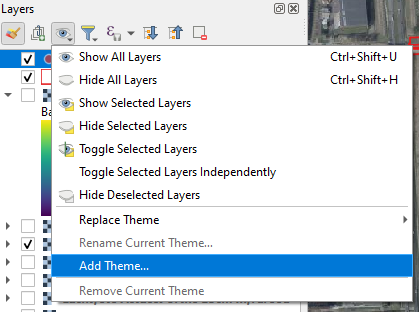
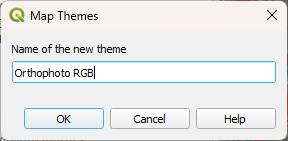
4. In the Map Themes popup call the the new theme Orthophoto RGB and click OK.
5. Now hide (uncheck the box) for Luchtfoto Actueel Ortho 8cm RGB and check the box for Luchtfoto Actueel Ortho 25cm Infrarood.
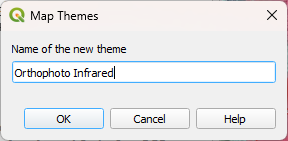
6. In the same way now create a Map Theme with the name Orthophoto Infrared.
Now you can find both themes :
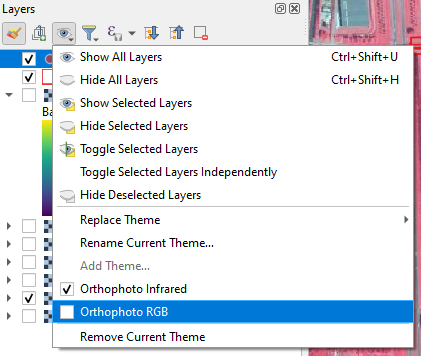
7. Switch between the two Map Themes and check the result.
8. In the same way add the following Map Themes:
| Visible layer name |
Theme name |
|---|---|
| orthophoto.mbtiles | Orthophoto RGB offline |
| NDVI_11022023 | NDVI |
| BRP Gewaspercelen |
Parcels WMS |
| Bodemvlakken | Soil map |
| OpenStreetMap | OpenStreetMap |
In the end you'll have the following Map Themes:
In the next sections we'll do some final project settings.
9. Setup the Project Properties
Now the survey layers have been defined, we need to change some settings in the Project Properties to indicate that these layers are survey layers. We can also set there the spatial extent of the project and some synchronisation options.
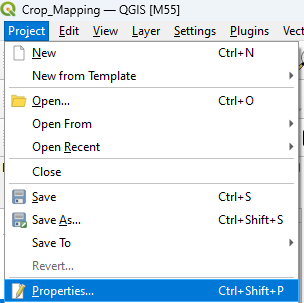
1. In the main menu go to Project | Properties....
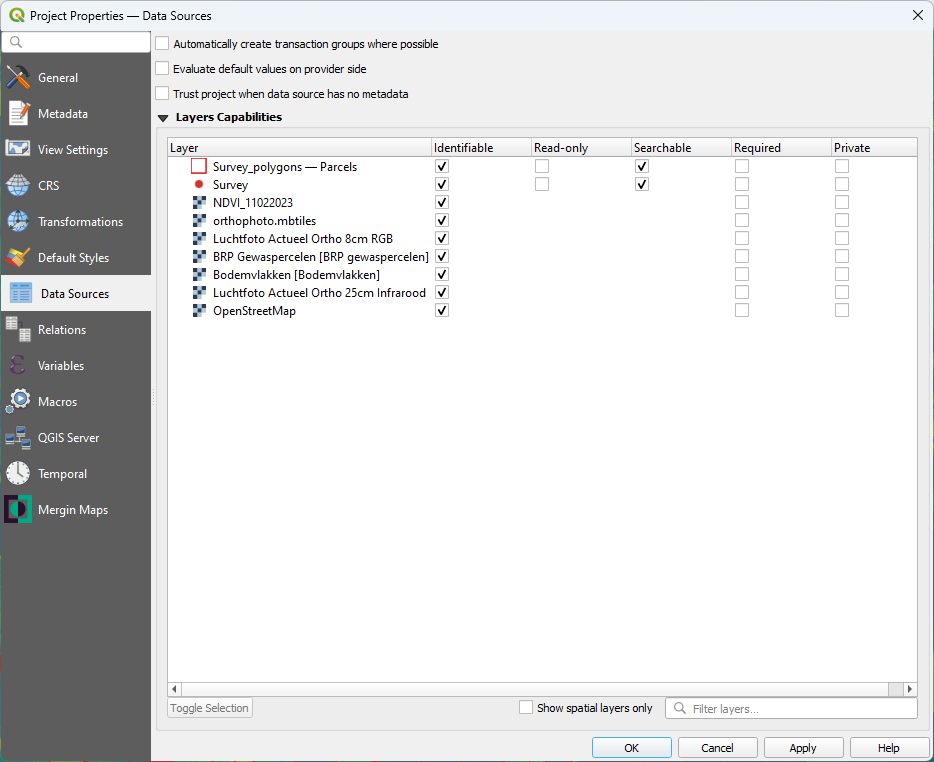
2. Go to the Data Sources tab. There you have to make sure that the survey layers are not set to Read-only. Layers set to Read-only can not be edited in the field and will be visible as background layers.
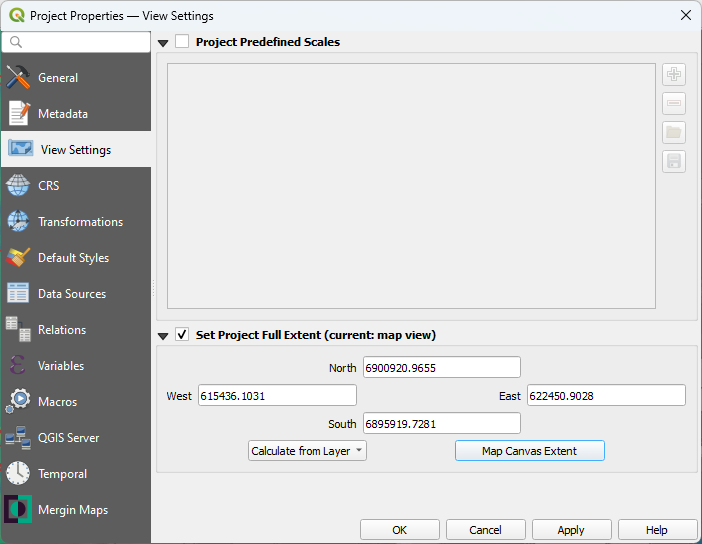
3. Next go to the View Settings tab.
Here you can set the spatial extent of the project. That will determine the extent when you zoom to full extent.
4. Check the box to Set Project Full Extent. And choose the Map Canvas Extent (make sure you're still zoomed in to the extent of the Smaller study area).
5. Finally, you can go to the Mergin Maps tab.
We'll not change anything here. However, if you have limited space on your phone or bandwidth is a challenge, you can enable Selective sync here or reduce the size of pictures.
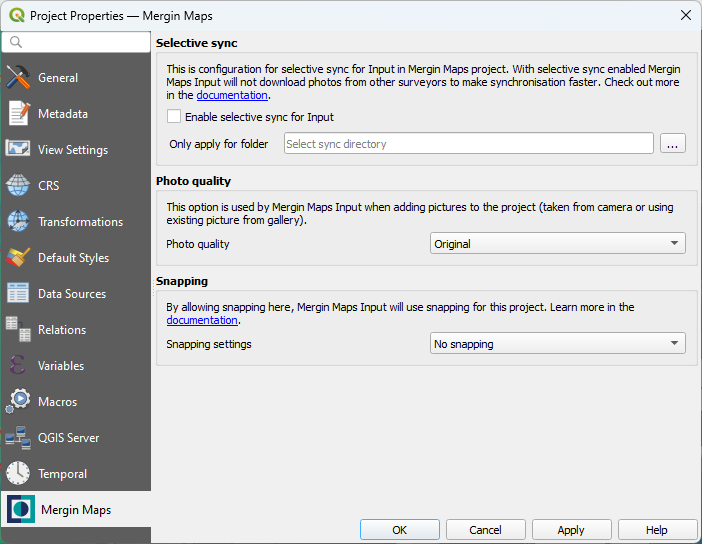
6. Click OK to apply the settings and close the dialog.
10. Synchronise the QGIS project with Mergin cloud service
Now our project is setup, we're ready to synchronise it to the Mergin cloud service and then our mobile device. Let's first synchronise the project with the Mergin cloud service.
1. Save your project
2. Click the Synchronise Mergin Maps Project  icon in the Toolbar.
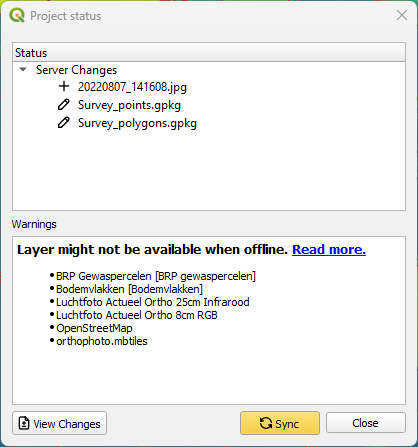
A popup with the status of your project appears:
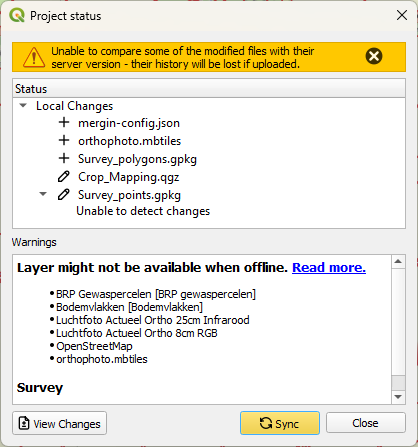
You can ignore the warning. It shows the warning, because we use online web map services, which can't be stored.
3. Click the Sync button.
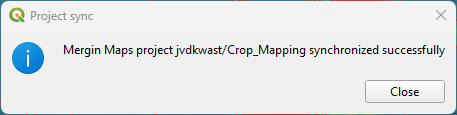
After a while you'll see the popup with the message that the syncronisation was successful.
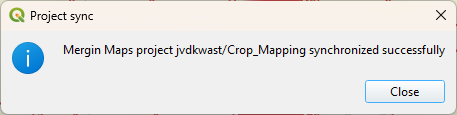
4. Click Close.
Now your project is in the Mergin cloud.
In the next section we'll synchronise the project from the cloud with our mobile device.
11. Synchronise the Mergin Maps project with a mobile device
Now we can synchronise the project with our mobile device and use it for field data collection.
1. On your mobile device go to the Mergin Maps app.

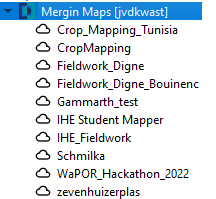
2. Go to the Projects tab.
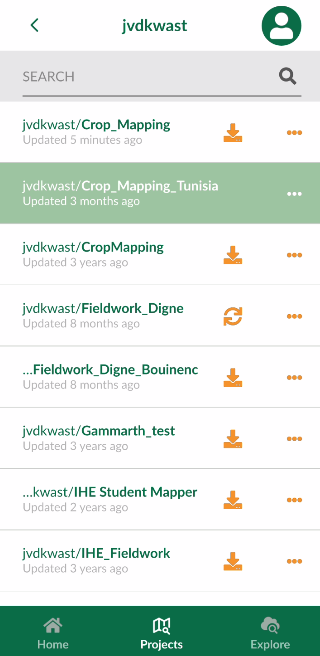
3. There look for the new Crop_Mapping project and tap  to download the project to your mobile device.
4. After downloading, go to the Home  tab and tap the Crop_Mapping project to open it.

Now you'll see the project on your mobile device.

In the next section we'll cover how to use the app for surveying in the field.
12. Using the Mergin Maps app for field surveys
In this section we're going to use the Mergin Maps app on our mobile device for field data collection.
Make sure you see the project on the screen of your device:
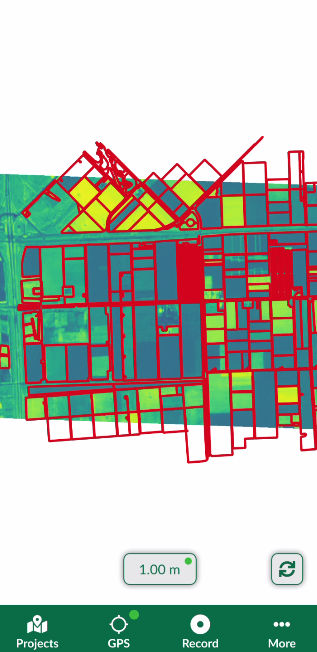
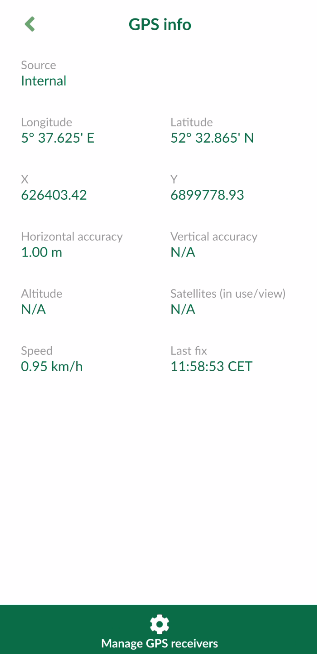
You can see the GPS accuracy. Make sure it's good enough for your purpose.
1. Tap the GPS accuracy value. This will give you the GPS reading.
2. Go back to the project by tapping  .
.
3. Tap the GPS  icon to zoom in on your location.
4. Use two fingers to zoom in further.

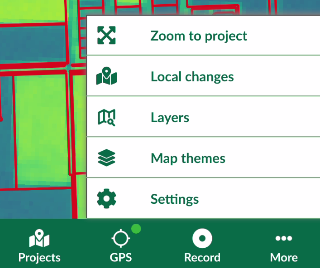
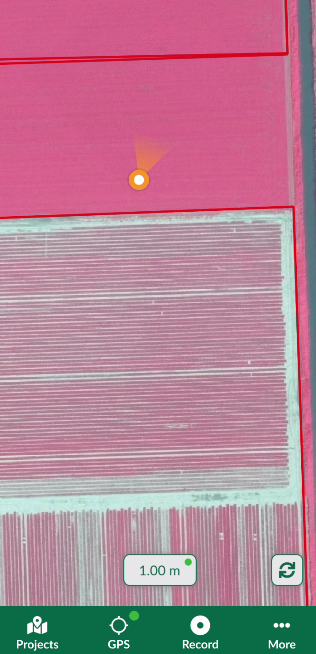
5. Tap the  icon and choose Map themes.
6. Try different Map Themes.
Let's take an observation point.
7. Tap Record  .
.
8. The GPS locator changes into a crosshair. You can move the crosshair with your fingers to the location that's representative for your observation. This is particularly useful if you don't have access to a parcel due to fences.

9. If you're okay with the location, tap the layer name and choose Survey.

10. To add the point and fill in the field form, tap  .
.
11. Fill in the form.
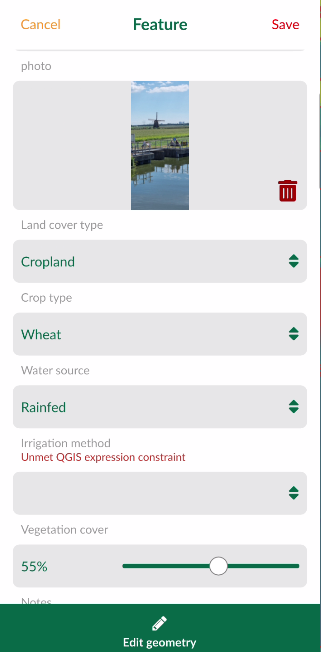
12. Tap Save to save the observation. Tap Edit geometry if you still want to move your point.
The point is now put on the map with the style from the project. If you tap it you can also see the preview:

With the  icon you can navigate to the point. With the
 icon you can edit the point.
Let's now update a crop of a parcel.
13. Tap on a parcel and tap  to go to the form.

14. Change the crop type and the year and tap Save.

14. Tap  to synchronise your changes with the cloud.
Now we'll go back to QGIS to check our project.
13. Synchronise the survey in QGIS
Back in the office we want to check the data and further process it in QGIS.
1. Open the Crop_Mapping project in QGIS.
2. Click the synchronise icon  in the Toolbar.
A popup shows the changes.
3. Click Sync.
After synchronisation a popup will show that the synchronisation was successful.
4. Click Close.
You can now see the survey points on the map.
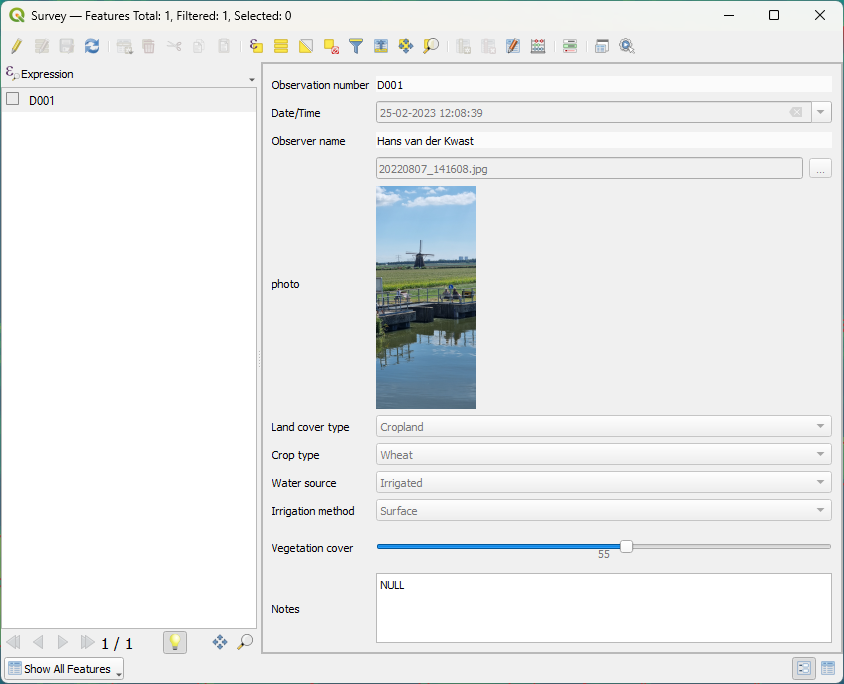
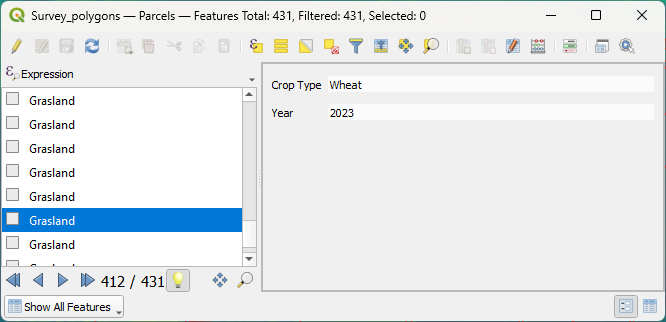
5. Open the attribute table for the Survey layer.
6. In the lower right of the attribute table swith to Form View by clicking the  icon.
icon.
Now you can see your observations also with the form widgets.
7. Do the same for the Parcels layer.
You can now use this for further analysis.
In the final section of this tutorial you'll learn how to see changes in the dashboard of the cloud service.
14. Monitor the project in the Mergin Maps dashboard
Mergin Maps keeps track of all transaction with the cloud service. You can also work together on a project or create a work space for your organisation. Let's have a look at the dashboard.
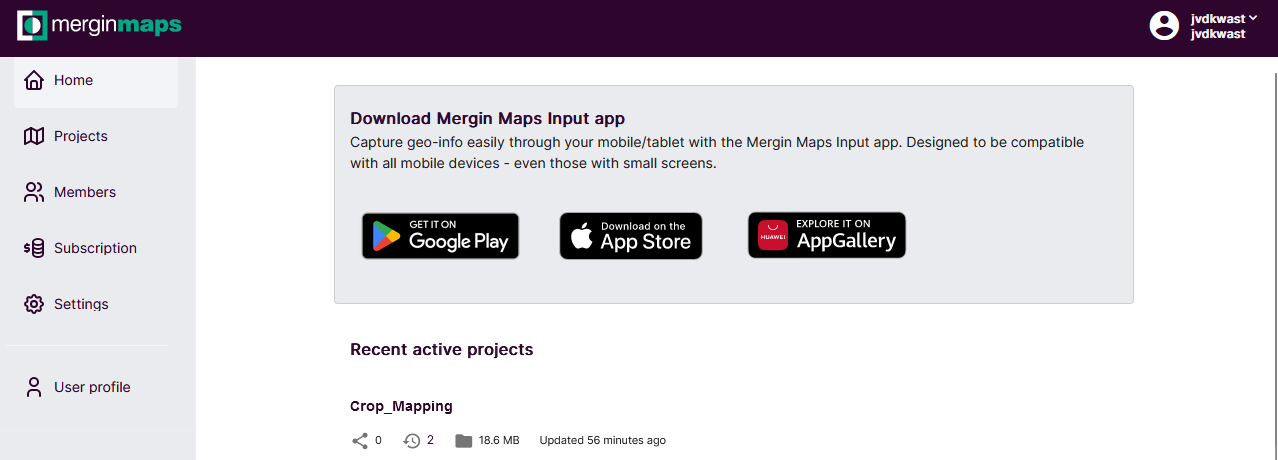
1. Go to the Mergin Maps website and login with your credentials.
There you'll see your projects with their size and how many versions are stored.
2. Click on the Crop_Mapping project.
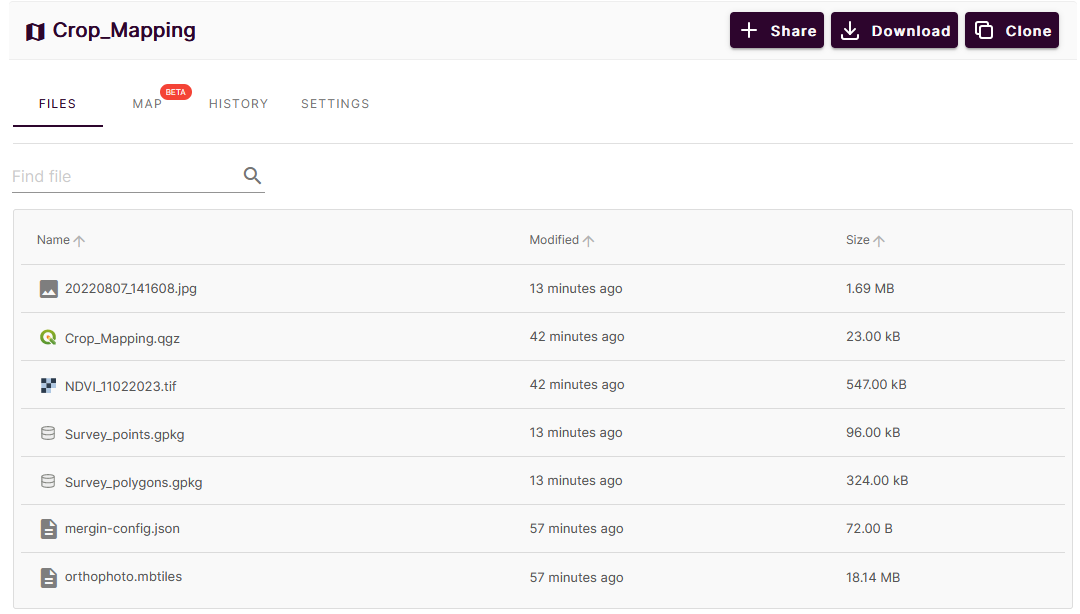
In the Files tab it shows all files of the project.
3. Go to the History tab.
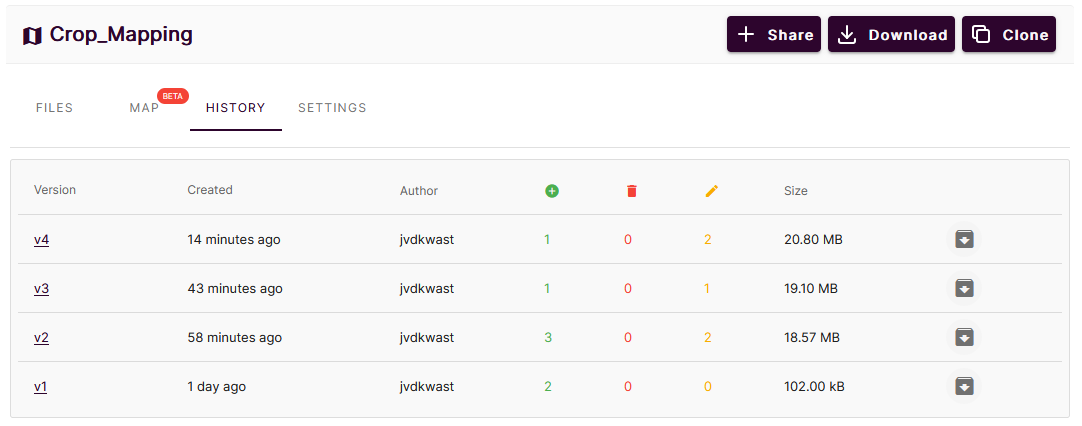
There you can find all versions, when they were created, which user made the changes and what the changes were. You can download previous versions from here too.
4. Click on a version number.
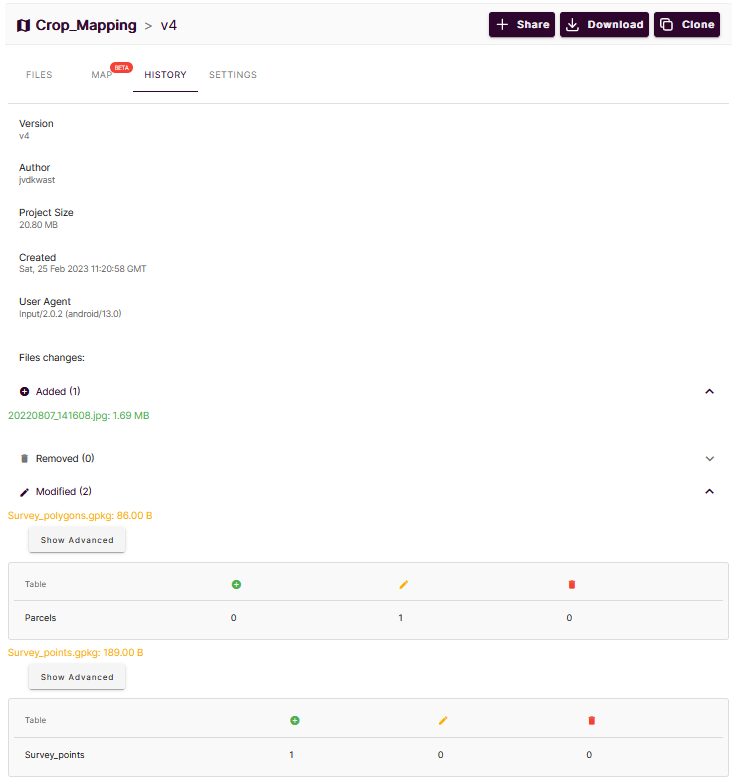
Mergin Maps will show here all changes.
5. Click Show Advanced.
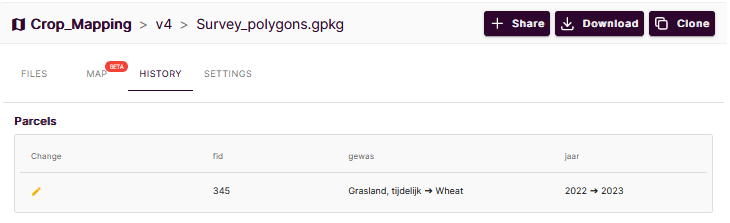
Mergin Maps now shows the changes in the attributes.
For more information on the dashboard, please check the documentation.
15. Conclusion
In this tutorial you've learned to setup a field data collection app with QGIS and Mergin Maps.
This webinar shows a similar application: