Hand in Hand Tutorial
| Site: | OpenCourseWare for GIS |
| Course: | Monitor spatial and temporal trends in agricultural water productivity with WaPOR open data |
| Book: | Hand in Hand Tutorial |
| Printed by: | Guest user |
| Date: | Thursday, 23 July 2026, 1:20 PM |
1. Introduction
Hand-in-Hand Initiative
Hand-in-Hand (HIH) is an initiative led by the Food and Agriculture Organization (FAO) of the United Nations. The program aims to help countries improve their agriculture and food systems to reduce poverty, hunger, and inequality. It uses advanced technology and partnerships to make farming more efficient, increase incomes, and improve nutrition for poor and vulnerable populations.
The program focuses on countries with high poverty and hunger rates, limited resources, or facing challenges like natural disasters. It supports activities such as developing better ways to grow and sell crops, improving water management, using digital tools in farming, reducing food waste, and dealing with climate change and weather risks.
![]()
Hand-in-Hand (HiH) Geospatial Platform
The Hand-in-Hand (HiH) Geospatial Platform is a tool that helps the HiH Initiative by providing useful data for agricultural projects. It includes information about food security, agriculture, land, water and other relevant statistics from various organizations. The platform is created and expanded by the Digitalization and Informatics Division to meet the data needs of the HiH Initiative.
2. Tutorial on Utilizing WaPOR Data in the HiH Geospatial Platform
The WaPOR database is now accessible on the HiH platform. In this demonstration, we will showcase some of the platform's functionalities and highlight how the database can be utilized to evaluate water productivity, differentiate between rain-fed and irrigated agricultural production, irrigation optimization, measure water consumption, and other related metrics.
2.1. Portal Navigation
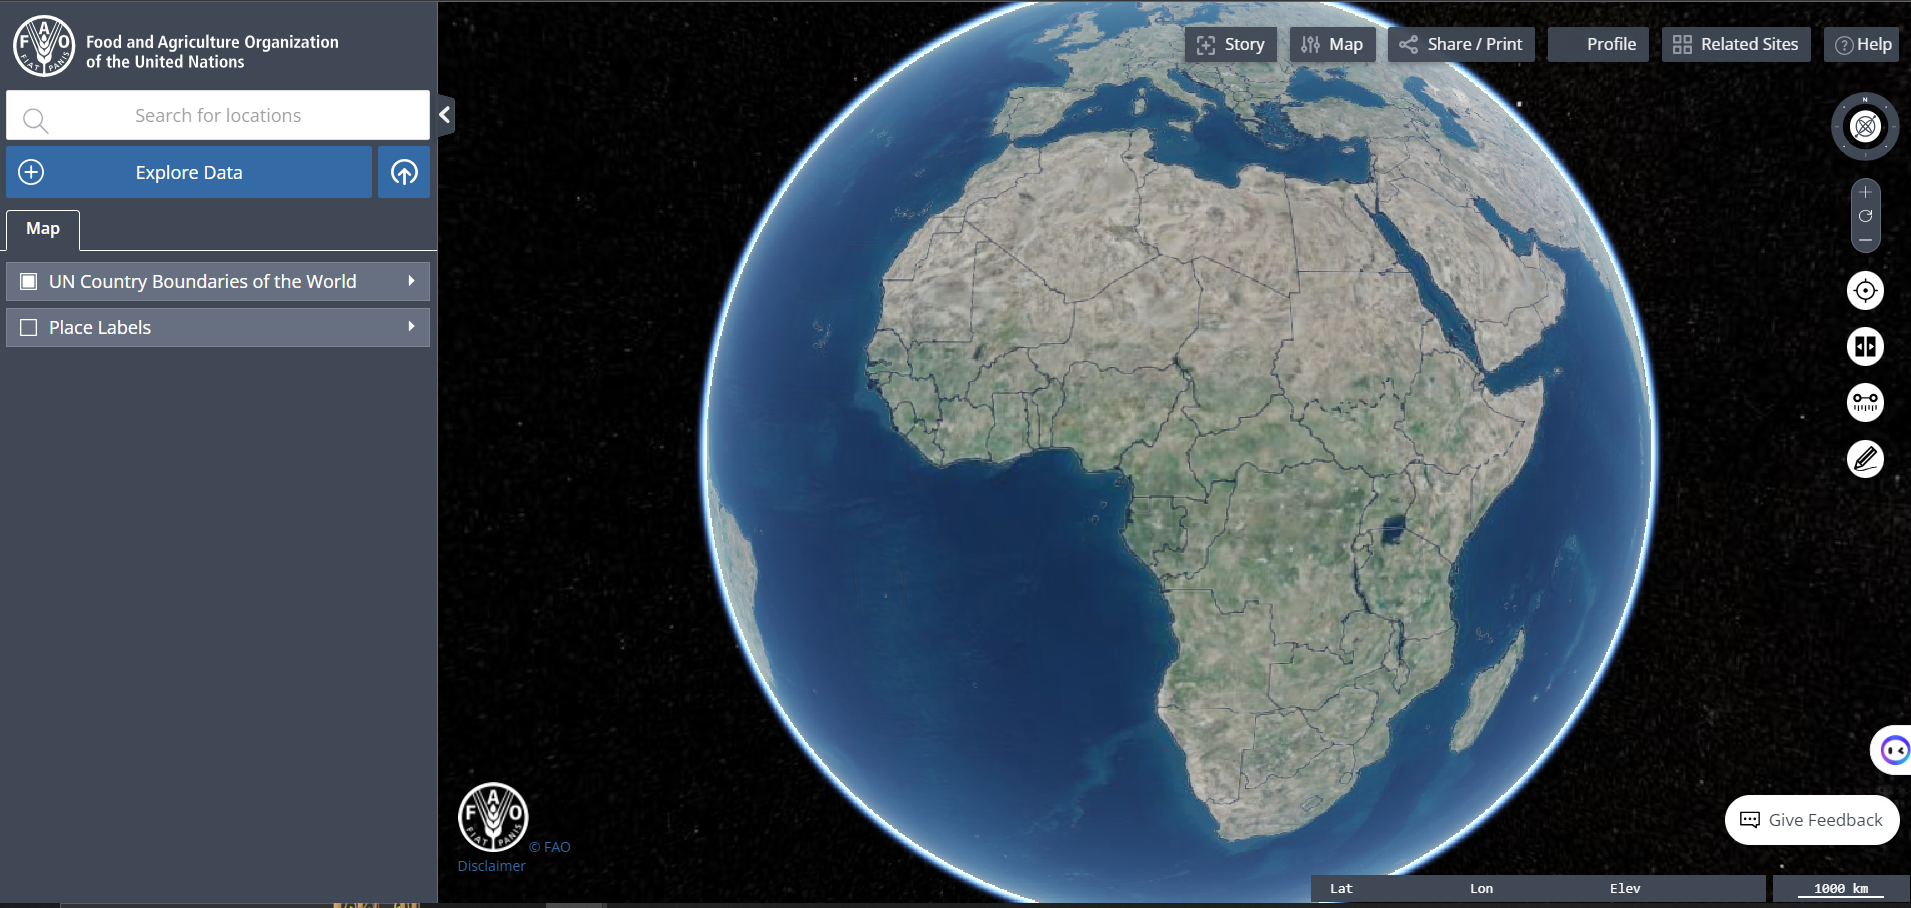
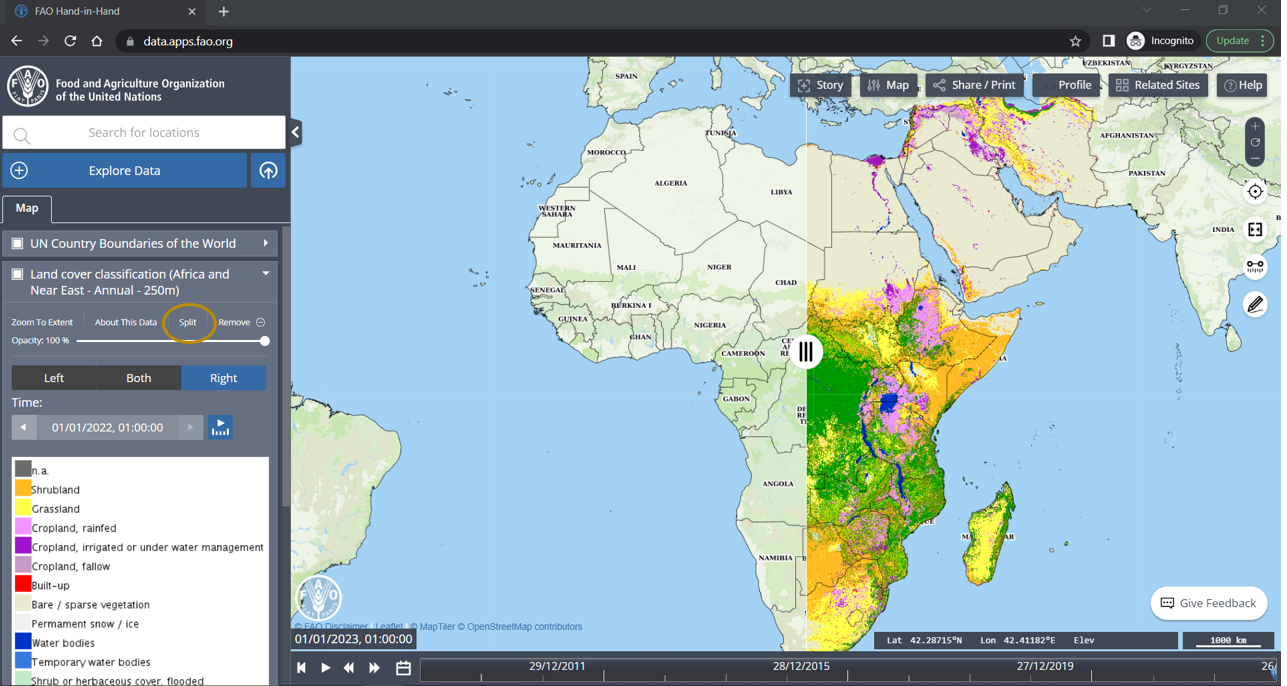
Go to the website data.apps.fao.org, and the website will appear as shown below.
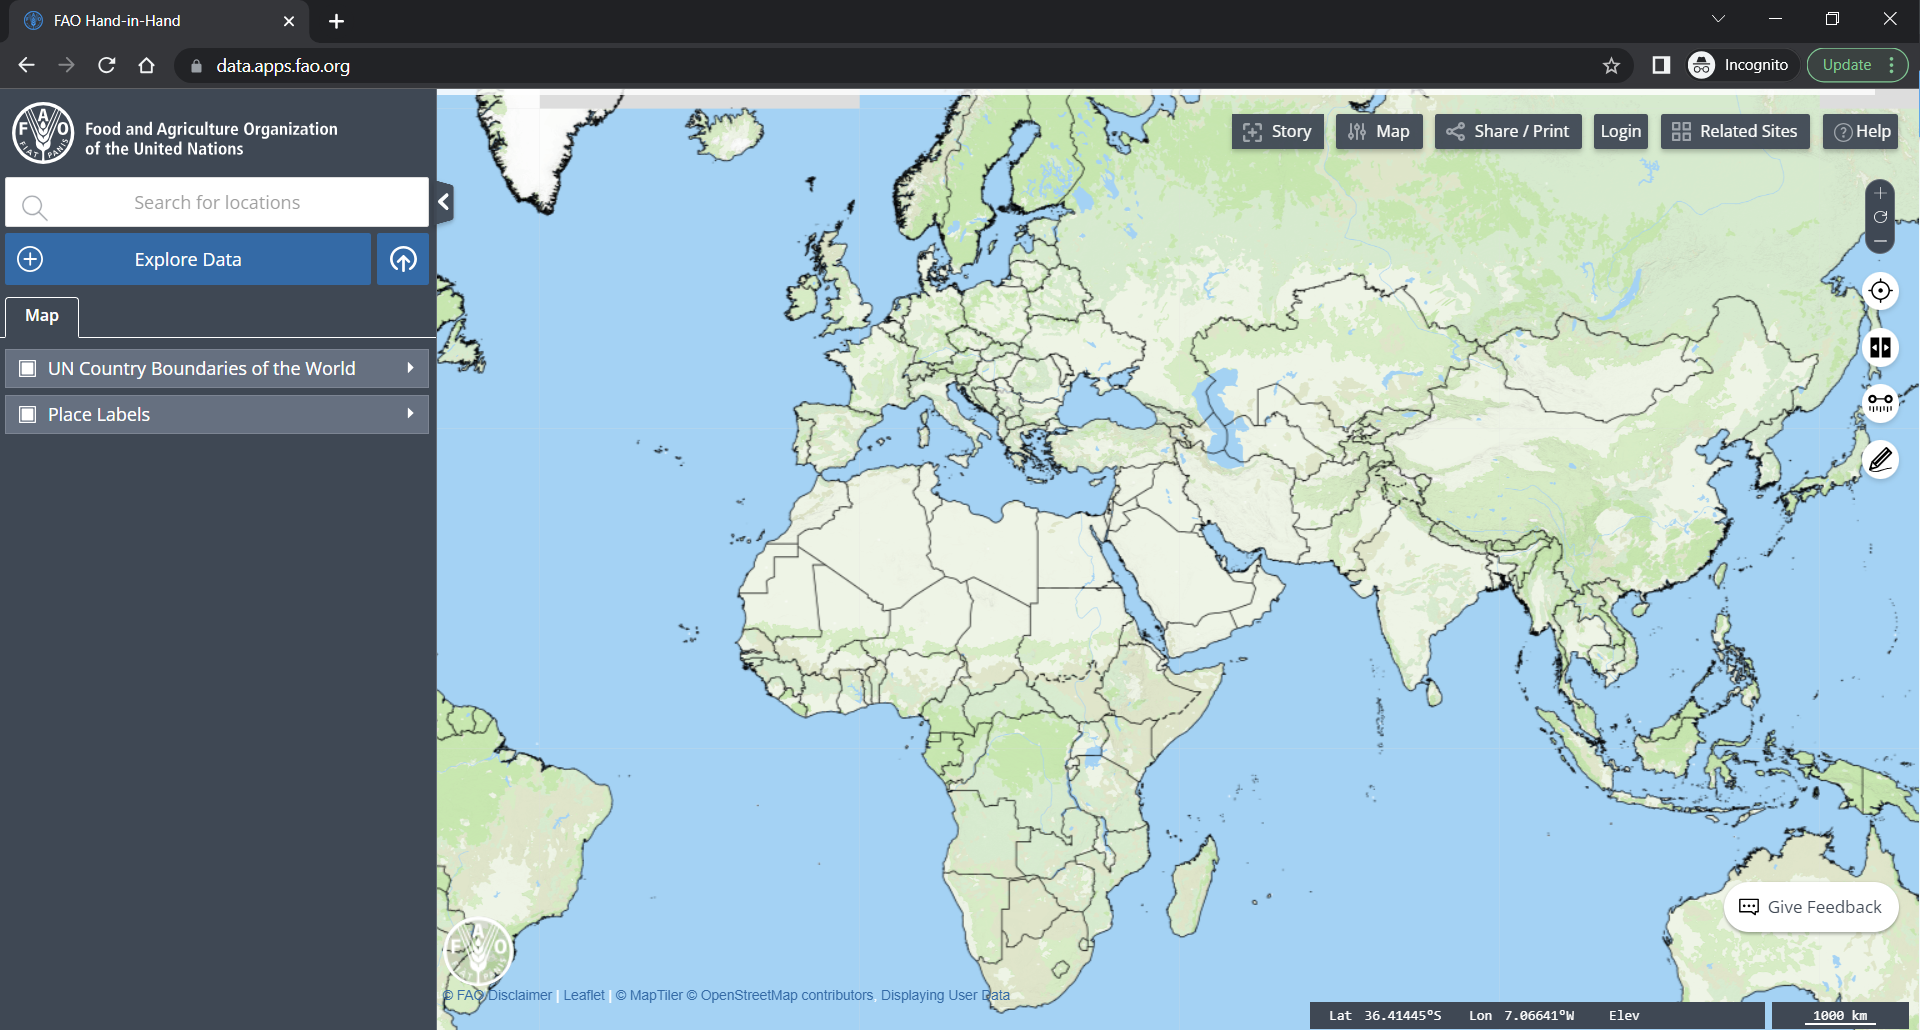
Using the options on the right, you can customize the map, add a story, and log in or create an account to save your data for future use.
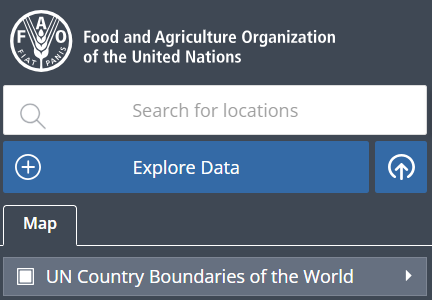
You can find the Explore Data option on the left side of the page, along with the search bar to look for specific locations.
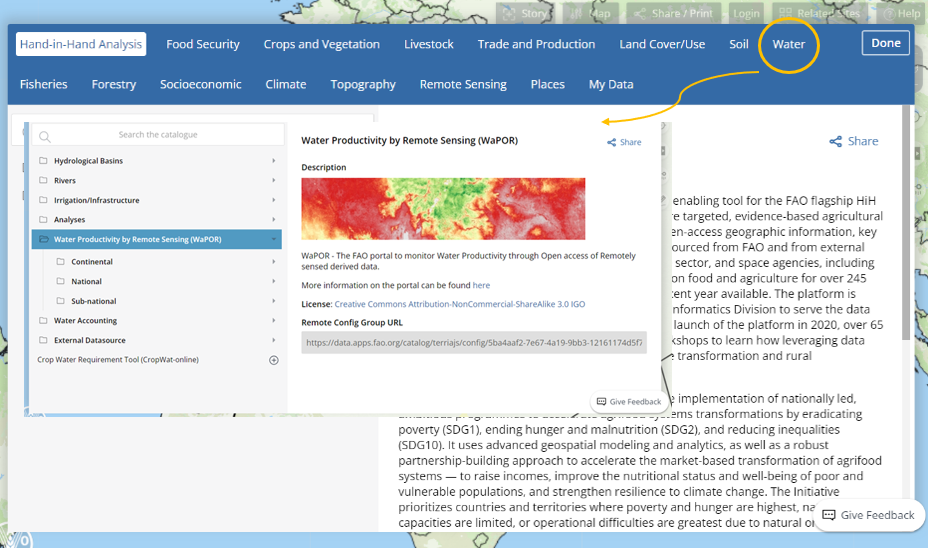
The WaPOR database is accessible through this platform at three distinct levels: Continental (250m), National- (100m) , and Sub-national (30m) that can be utilized to retrieve water productivity data.
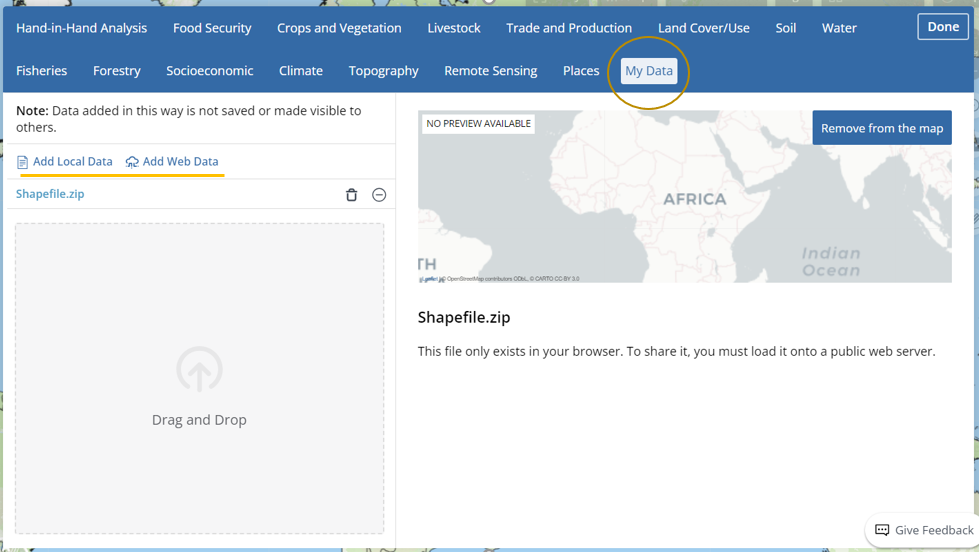
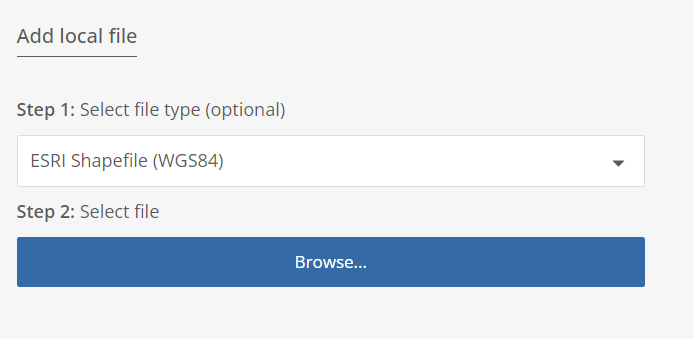
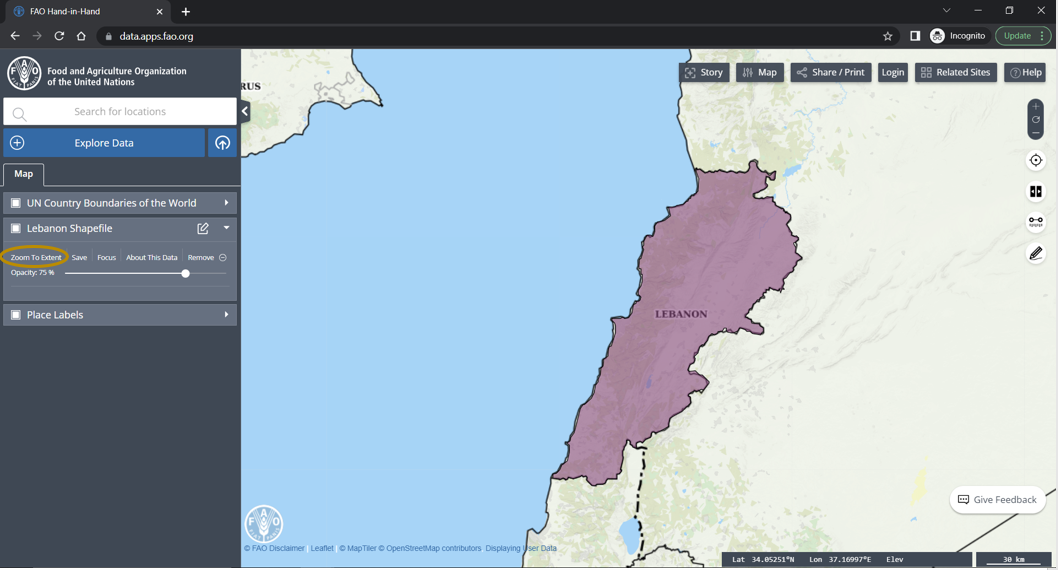
To upload a local file, please select the appropriate category and upload it from your personal computer. As an example, I have uploaded the country Shapefile of Lebanon, which is displayed on the map.
To view the uploaded shapefile, click on "Zoom to Extend".
The "Split" option shown below is an useful tool that allows for easy comparison of maps.
With the option ![]() you can measure the distance between location.
you can measure the distance between location.
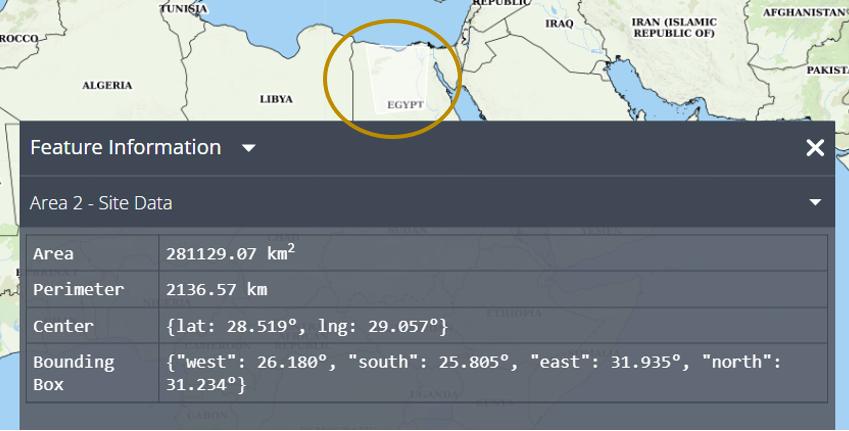
This option![]() allows you to draw and measure an area that can be saved and utilized for future analysis.
allows you to draw and measure an area that can be saved and utilized for future analysis.
Please refer to the video below for step-by-step instructions.
2.2. Data Analysis Tool
In this chapter three types of analysis will be presented, including Point Time Series, Area Time Series, area and Land Cover Classification.A. Point Time Series
To get started, import the data layer you wish to analyze for the given point. For example, here the monthly precipitation data from WaPOR was imported.
Click on the point where you want to analyze the data and the Feature Information tab will opened.
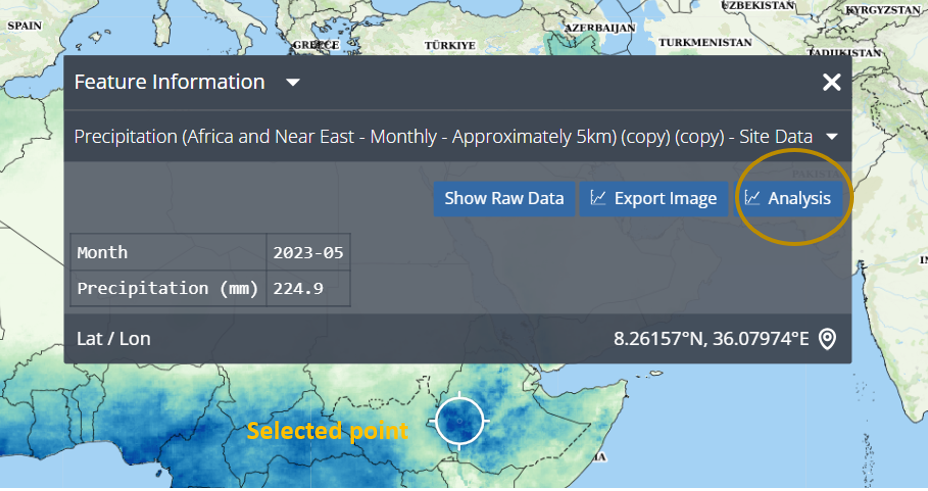
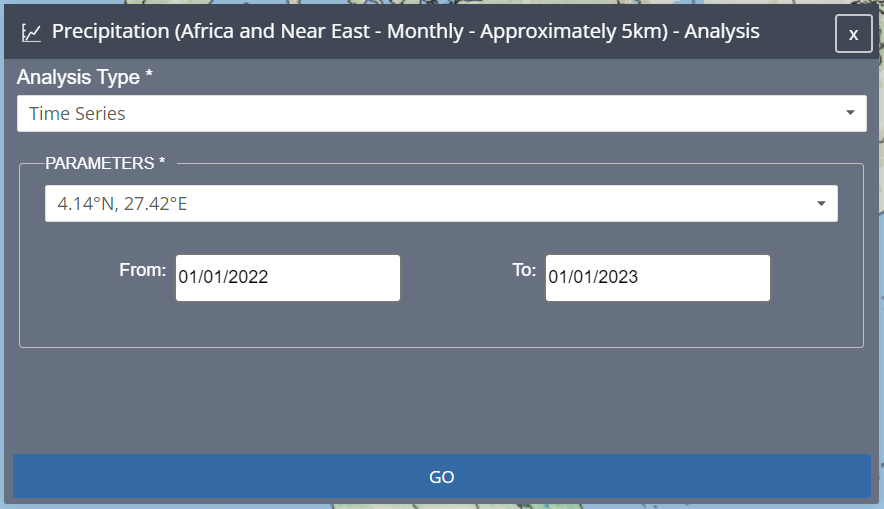
Under the Analysis option, there are three types of analysis available; Deviations from Average, Time Series, and Cumulative Time Series. For example, Precipitation data over time is displayed by selecting the Time Series option.
Also, choose the time frame you want to analyze and then click on the "Go" button.
Once you have selected the point, analysis type and give a time frame for analysis , you will be able to view the Chart Tab which displays the graph of time series. From there, you can download the data directly to your local computer.
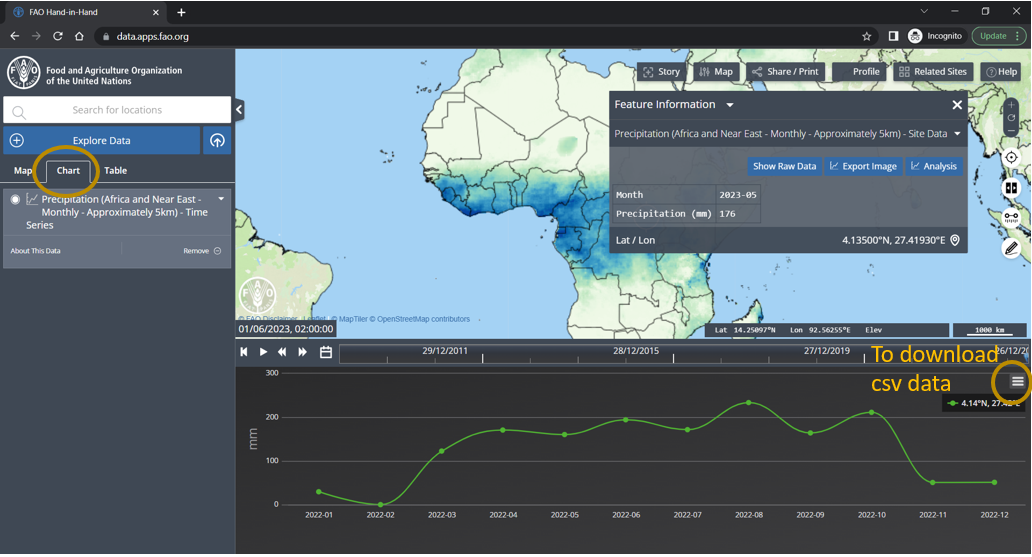
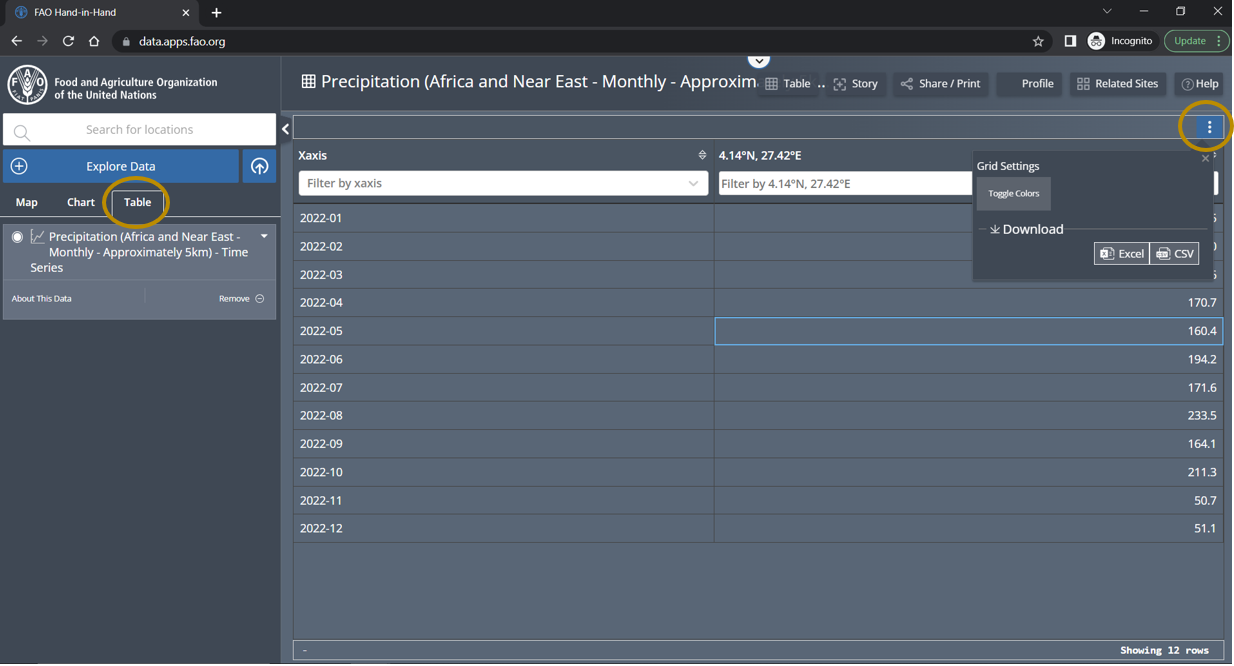
You can access the data table on the Table Tab and choose to download it in either Excel or CSV format. This allows you to work with the data in a way that best suits your needs. Refer to the image below for guidance.
B. Area Time Series
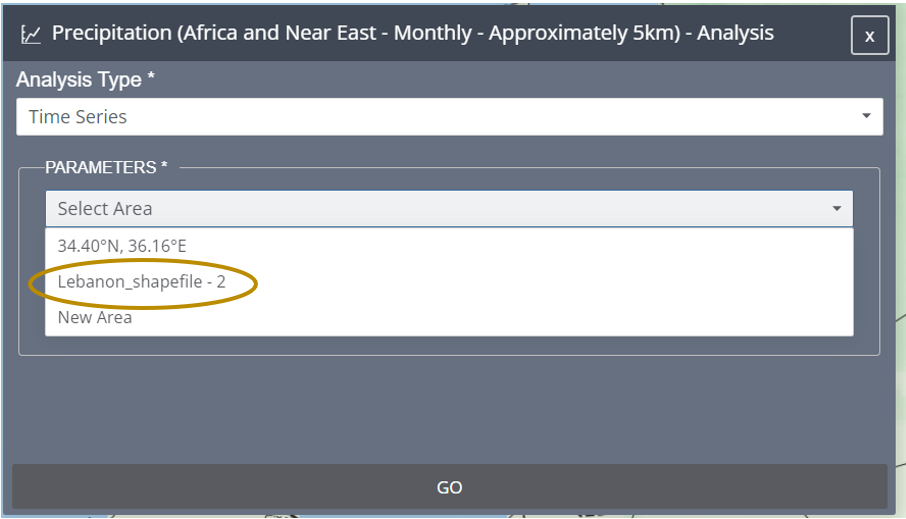
To do the Area Time Series analysis, we have 2 options: draw an area or upload a file.
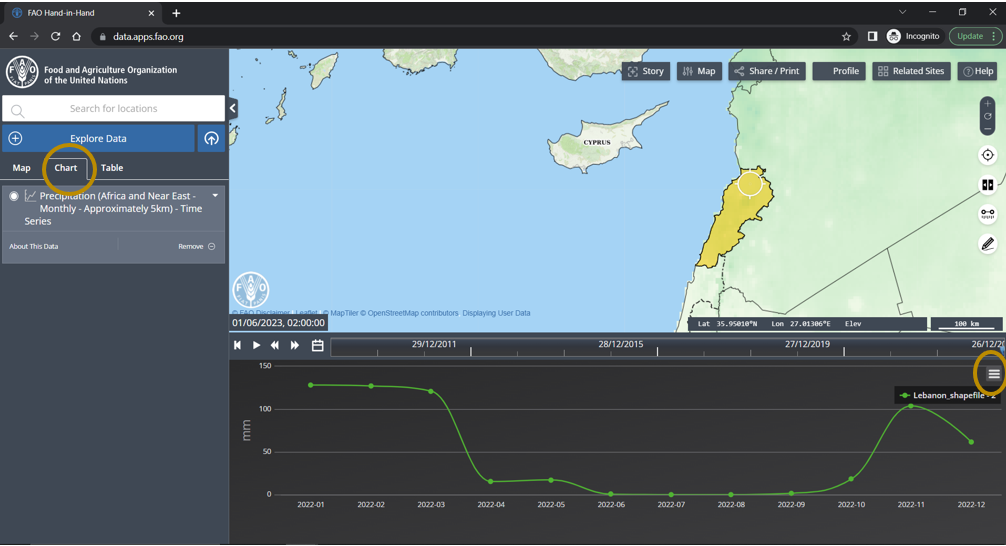
Here, the uploaded Lebanon shapefile has been used for the analysis as shown in the figure below.
Next, choose the time period for the analysis.
The graph and table can be retrieved and downloaded, similar to the point time series.
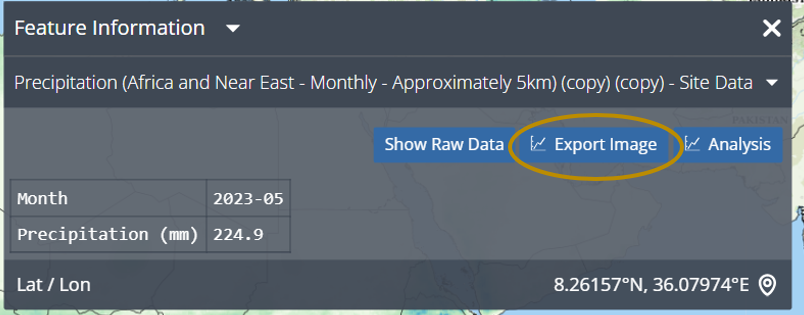
With Export Image option the Precipitation can be clipped to the selected area and downloaded as .TIF to be used for further analysis in QGIS.

C. Land Cover Classification
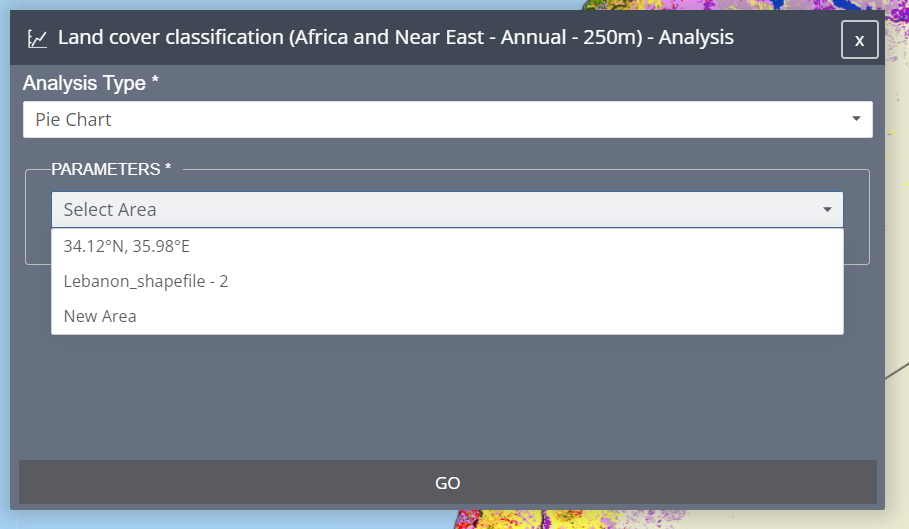
Import the Land Cover Classification map from the Data Tab and select the area.
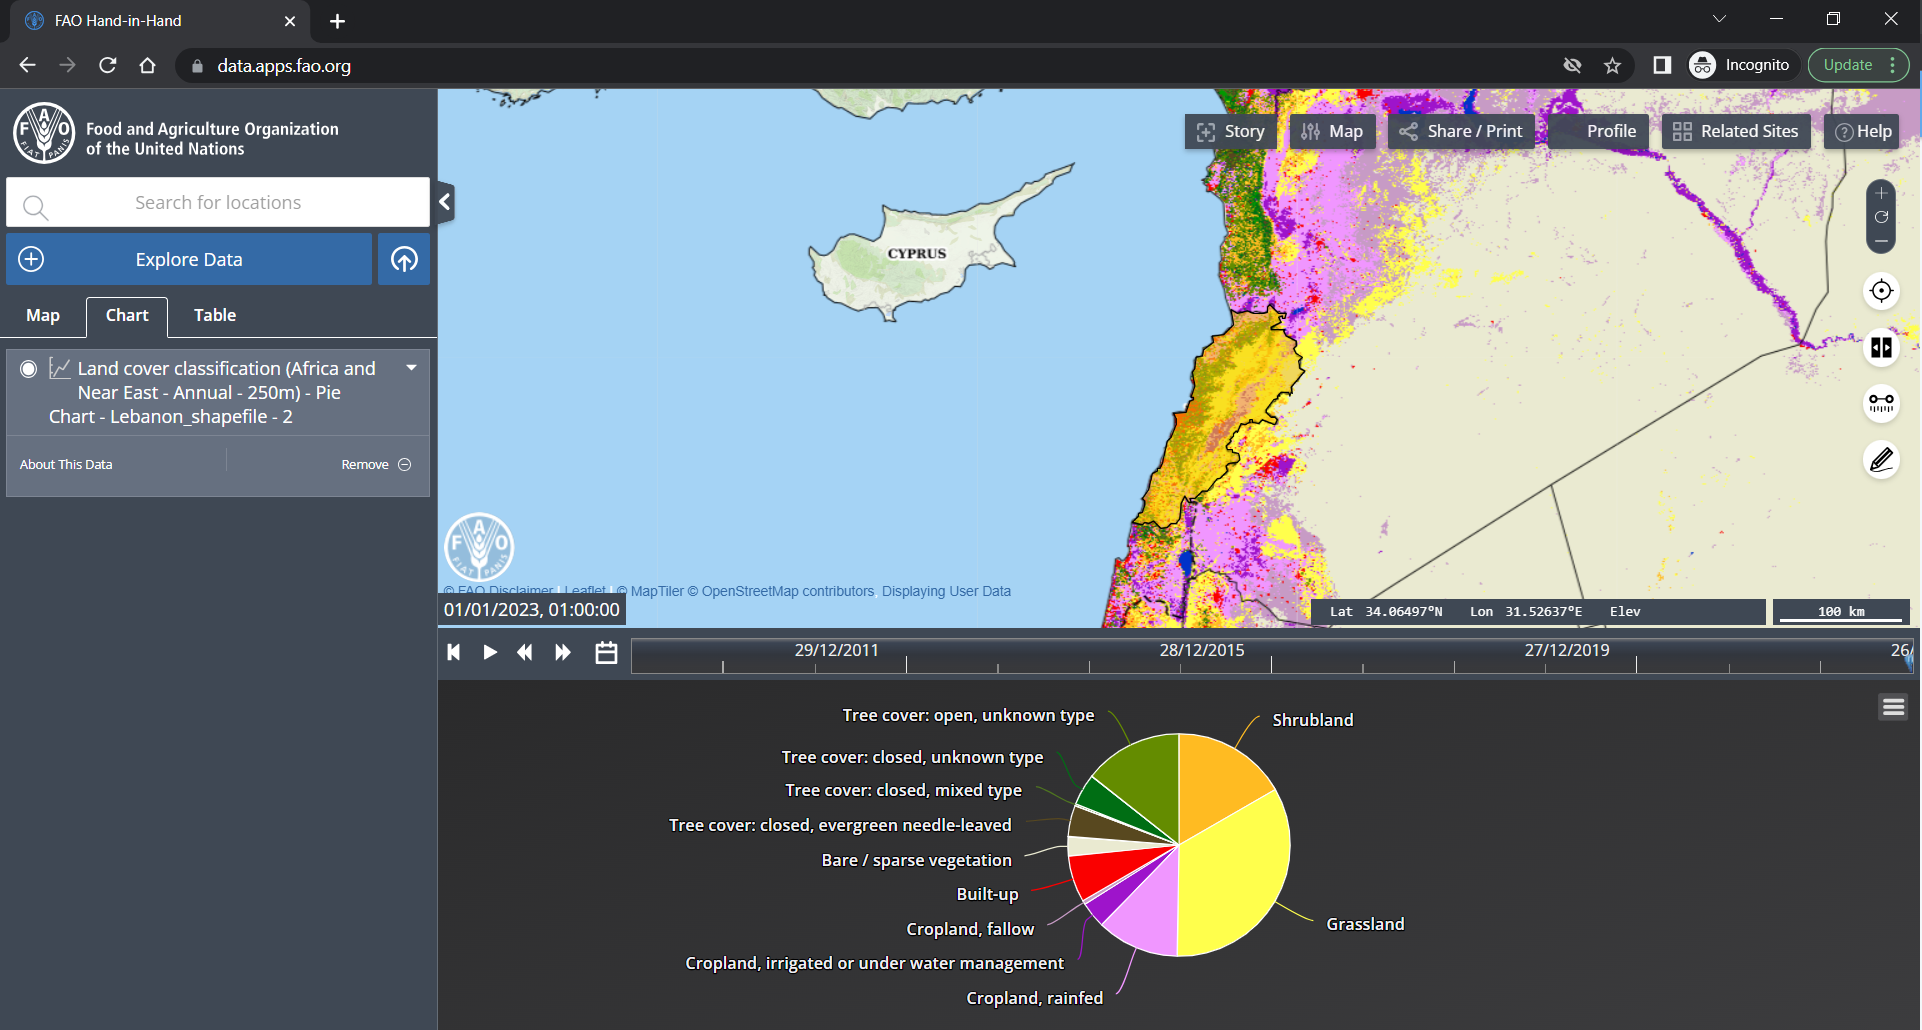
The results will be generated as an illustration of Pie chart as shown bellow.
The results will be generated as an illustration of Pie chart as shown bellow.
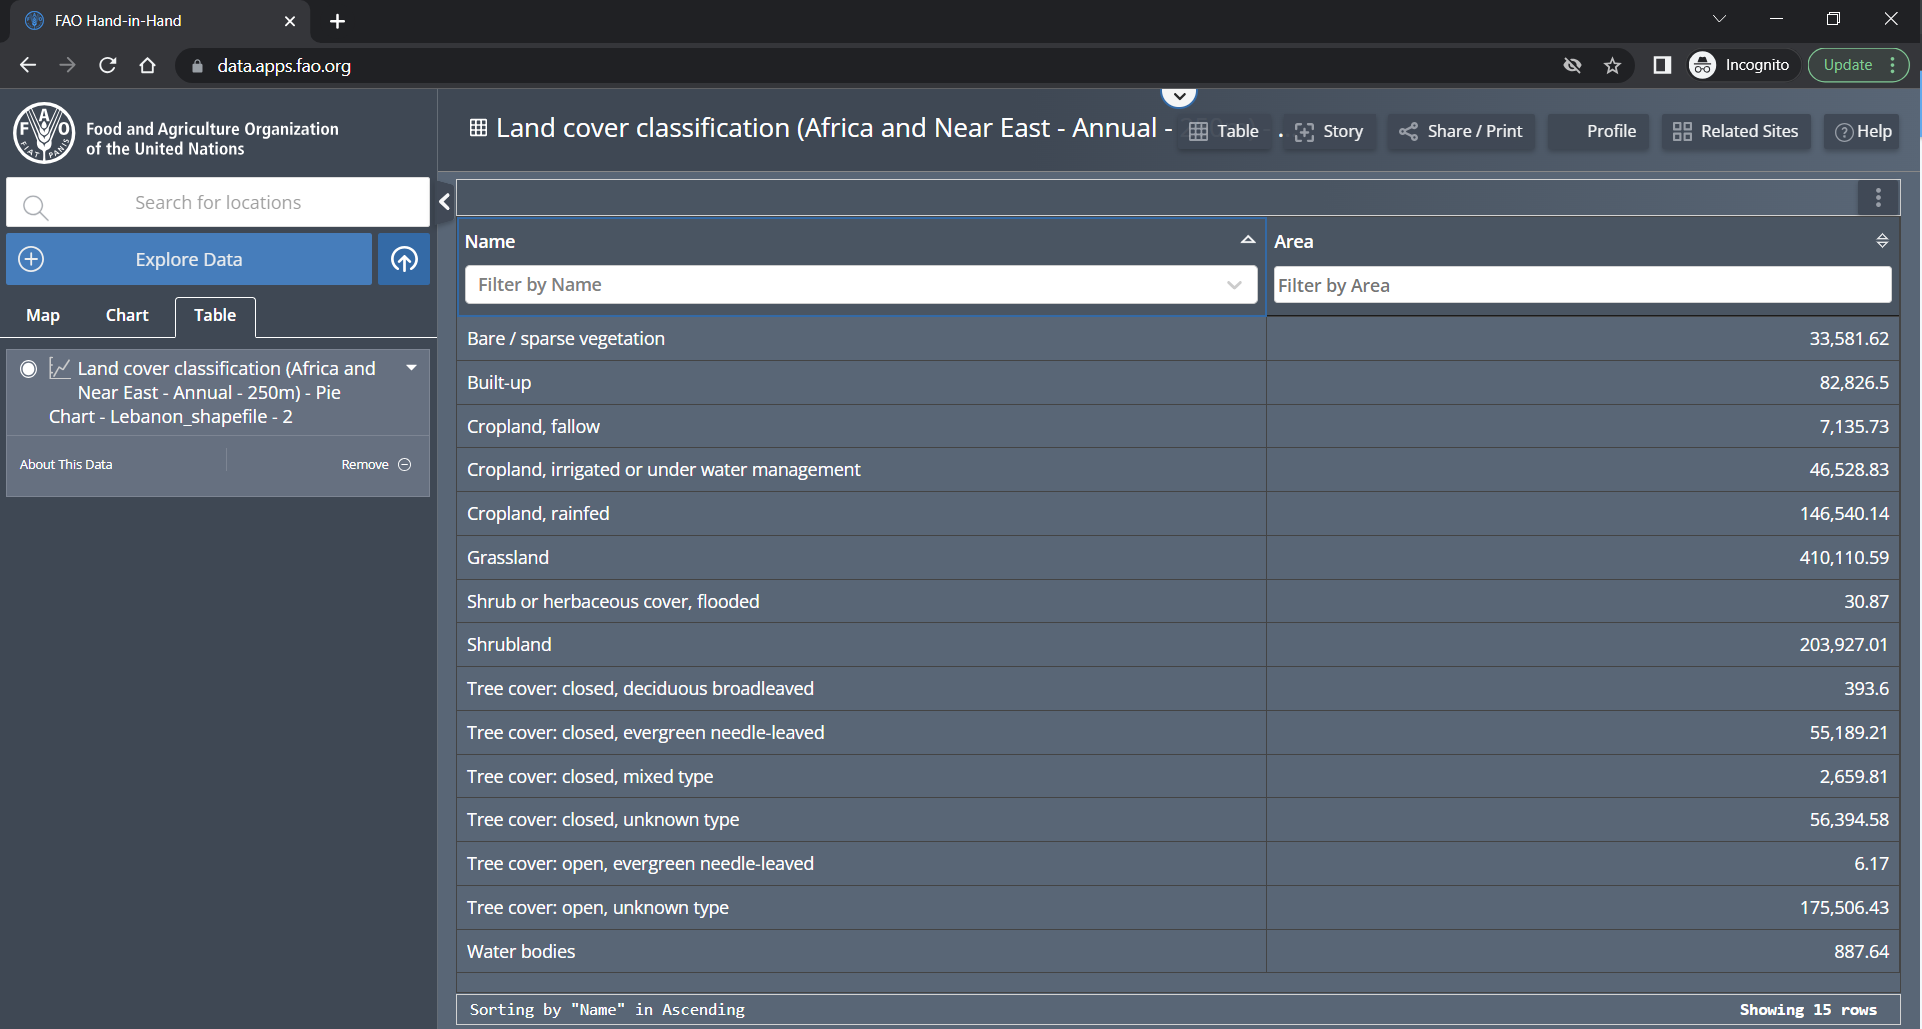
The Table generated from the data shows the area of each class and can be downloaded for further analysis.
Please refer to the video below for step-by-step instructions.
3. Exercise
This exercises focuses on map analysis and data exploration using the Hand and Hand FAO Geospatial platform. The objective is to familiarize yourself with the features and functionalities of the platform while analyzing geographic data.
1. Land Cover Map
- Select Bing Maps Aerial as the base map
- Import the Land Cover Classification Map
- Search for Wenji, Ethiopia in search bar
- Split the Land Cover map to compare and analyze the Irrigated Cropland.
2. Actual Evapotranspiration and Net Primary Production correlation
- Import the Actual Evapotranspiration and Net Primary Production layers with a resolution of 250m and a Dekadal temporal resolution.
- Split the maps and display them side by side.
- Analyze the correlation between ETa and NPP.
3. Point time series analysis to determine the crop season
- Perform the time-series analysis for two points from two different fields using the imported Net Primary Production layer between the time period of 01/01/2022 and 01/01/2023.
- Can you determine the crop season for the two selected points?
4. Water productivity
- Import the Gross biomass water productivity (Annual-250m)
- Conduct a time series analysis for 2 points and compare the changes in Gross Biomass Water Productivity over time.