The FAO Downloader Plugin
| Site: | OpenCourseWare for GIS |
| Course: | Monitor spatial and temporal trends in agricultural water productivity with WaPOR open data |
| Book: | The FAO Downloader Plugin |
| Printed by: | Guest user |
| Date: | Monday, 13 July 2026, 3:18 PM |
Description
1. Introduction
The FAO Downloader plugin for QGIS allows users to access FAO data. By taking advantage of the FAO API system users can access 26 different datasets. Users can take select a polygon layer from their QGIS projects and download the necessary data through an easy-to-use graphical user interface. Users can que up downloads of thousands of rasters at once by defining which rasters they require and the time period in which they are interested in. The program will automatically download, crop, and apply correction factors to the rasters.
This plugin was made by Brenden Vissers with assistance from Celray James Chawanda. Some Python code was adapted from the work done by Bich Tran on the "Water Productivity and Water Accounting using WaPOR” project (https://github.com/wateraccounting/WAPOROCW).
This tutorial will get you easily started with the plugin.
2. Installation
The FAO Downloader plugin is not yet available through the QGIS Plugins Manager. In the following steps, you'll learn how to install the plugin from a ZIP file.
1. Go in your web browser to the GitHub repository of the FAO Downloader plugin: https://github.com/bvissers/FAO-Downloader
2. Click on the green Code button.
3. Choose Download ZIP from the menu.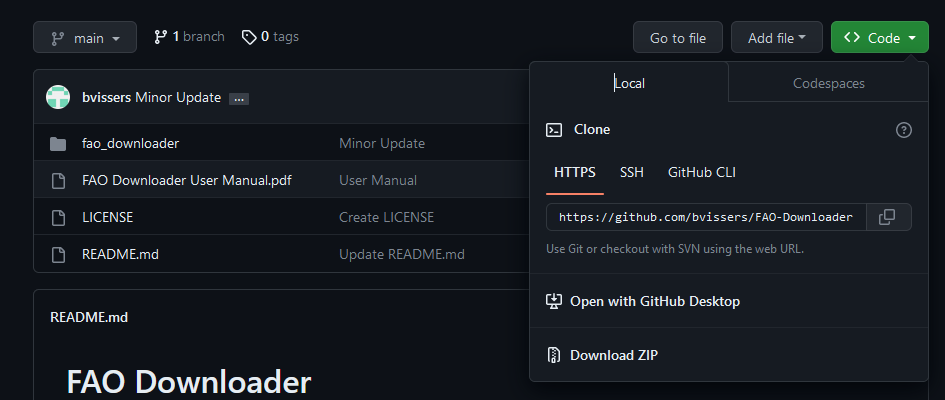
4. Download the file to a temporary folder (e.g. your Downloads folder).
5. Go into the FAO-Downloader_main.zip file and copy the fao_downloader folder into the temporary folder.
6. Now compress the fao_downloader folder to a zip file (fao_downloader.zip). This is folder has the data for the plugin.
Steps 5 and 6 are easily done with the Windows 11 Explorer. You can also use 7-Zip or other software to extract FAO-Downloader_main.zip, find the fao_downloader folder and zip that folder.
7. Start QGIS Desktop.
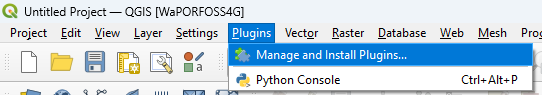
8. In the main menu go to Plugins | Manage and Install Plugins....
9. In the dialog, go to the Install from ZIP tab.
10. Browse to the fao_downloader.zip file using the  button.

11. Click Install Plugin.
A popup will warn you now that installing a plugin from an untrusted source can harm your computer. In this case you can trust the source.
12. Click Yes to continue.
After successful installation, you'll see the green message in at the top of the dialog that the Plugin installed correctly.
13. Click Close to close the dialog.
Now we're ready to use the plugin, but in the next chapter we'll first add a background map and define our study area.
3. Add a backdrop Google Satellite layer
To make orientation easy, we're going to add a Google Satellite backdrop, using the QuickMapServices plugin.
1. In the main menu go back to Plugins | Manage and Install Plugins....
2. Go to the All tab.
3. Search for the QuickMapServices plugin.
4. Click Install Plugin and click Close to close the dialog after installing.
You can now find the plugin in the web menu, but it lacks a lot of useful services. Let's fix that.
5. In the main menu go to Web | QuickMapServices | Settings.
6. In the QuickMapServices Settings dialog, go to the More Services tab and click Get contributed pack.
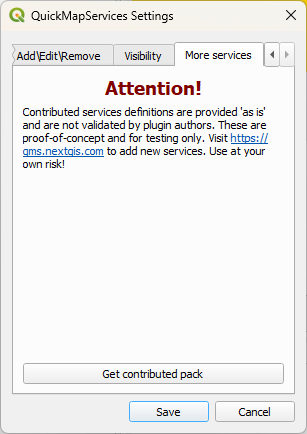
7. After installing click Save to close the dialog.
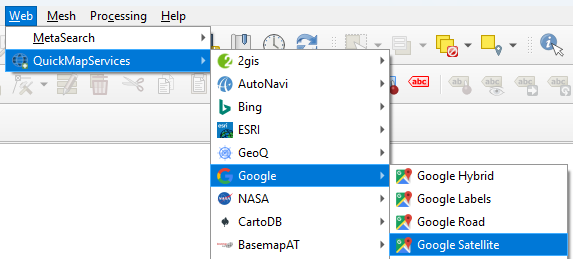
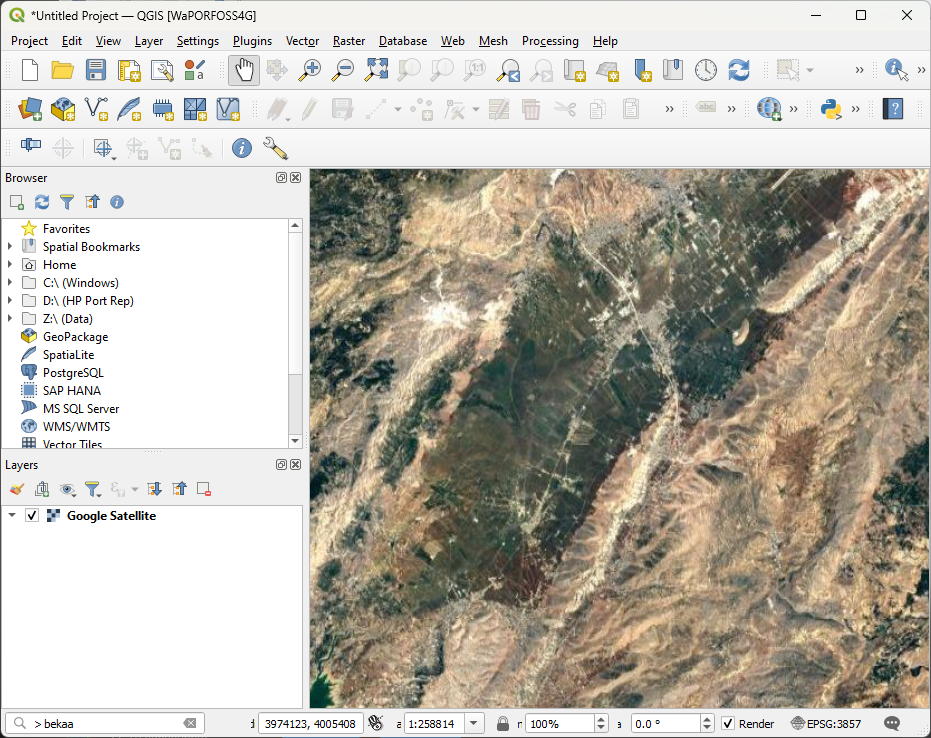
8. In the main menu go to Web | QuickMapServices | Google | Google Satellite.
9. Zoom in on the area of your interest.
Tip: you can use the Locator bar in the lower right of the QGIS window to find a location. Start the search with > and a space, e.g.:
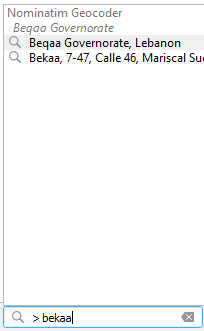
Then double click on the location to zoom in.
In the next chapter we'll digitize a polygon of our study area. If you already have a polygon, you can proceed with chapter 5.
4. Digtize a polygon for your study area
Before using the plugin, we need a polygon with the extent of our study area for which we want to download the FAO data.
In this chapter you're going to digitize a polygon.
1. In the toolbar click the New GeoPackage Layer  icon.
icon.
2. Use the Browse  button to choose a folder and filename for the GeoPackage, e.g. Z:\FAO_data\WaPOR_data.gpkg.
3. For Table name write Study area.
4. For Geometry type, choose Polygon from the drop down menu.
If needed you can change the projection and add attributes. Here we'll keep the defaults.
5. Click OK to create the empty GeoPackage layer.
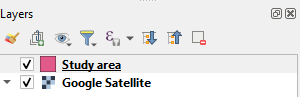
6. Make sure that in the Layers panel, the Study area layer is at the top.
7. In the toolbar click  to toggle to editing mode.
8. Click  to add a feature.
9. Digitize the polygon of your study area. With each left click you add a vertex. With backspace you can delete the last vertex. By clicking right you can close the polygon.
10. Click OK to add the polygon to the layer.
11. Click to toggle off editing mode. Click Save in the popup.
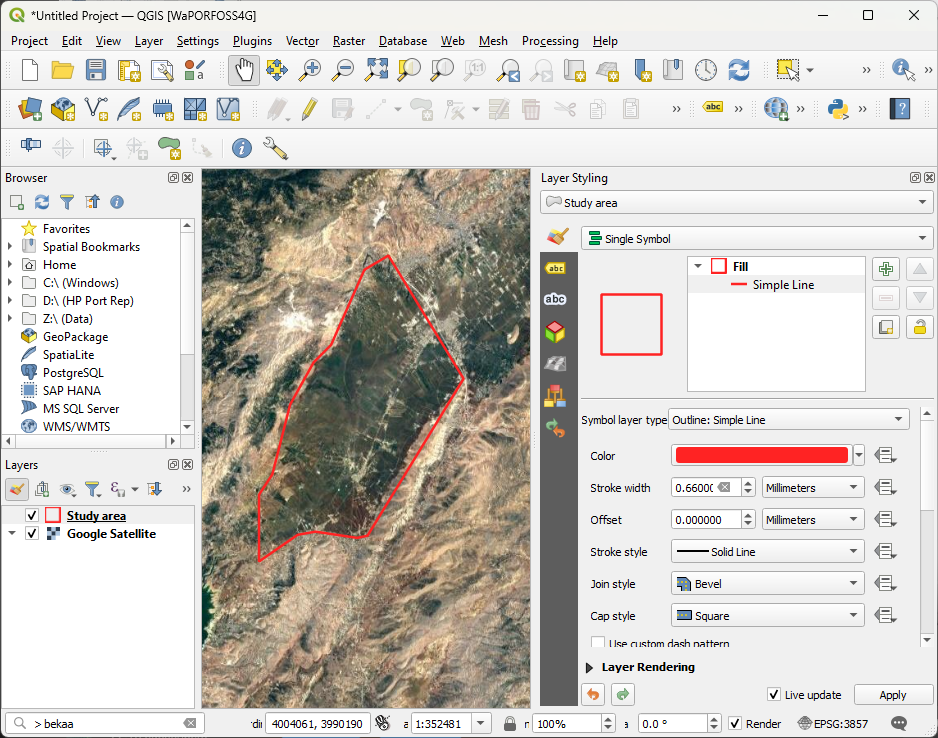
Now the Study are polygon has a random style. Let's change the style, so we only have a red outline.
12. In the Layers panel, click  to open the Layer Styling panel.
13. There, click on Simple Fill.
14. Change the Symbol layer type from Simple Fill to Outline: Simple Line.
15. Click on the Color.
16. Choose a red color. Click  to go back.
17. Increase the Stroke width to 0.66 mm.
Now we have are study area ready for downloading WaPOR data.
5. Setup the FAO Downloader plugin
The first time when you use the FAO Downloader plugin, you need to configure it, so it can download data through the FAO API.
1. In the toolbar click the FAO Downloader  icon.
icon.
2. In the Settings tab of the FAO Downloader plugin you need to fill in your token.
If you don't have a token or you have forgotten your token, click Get Token. That brings you to the WaPOR login page.
- Login with your credentials or make an account.
- Go to My WaPOR.
- Go to My Profile
- Under API Token create a new token or revoke a forgotten one before creating a new one.
- Copy the token and paste it in the FAO Downloader plugin.
 to browse to the folder where you want to store the downloaded FAO data.
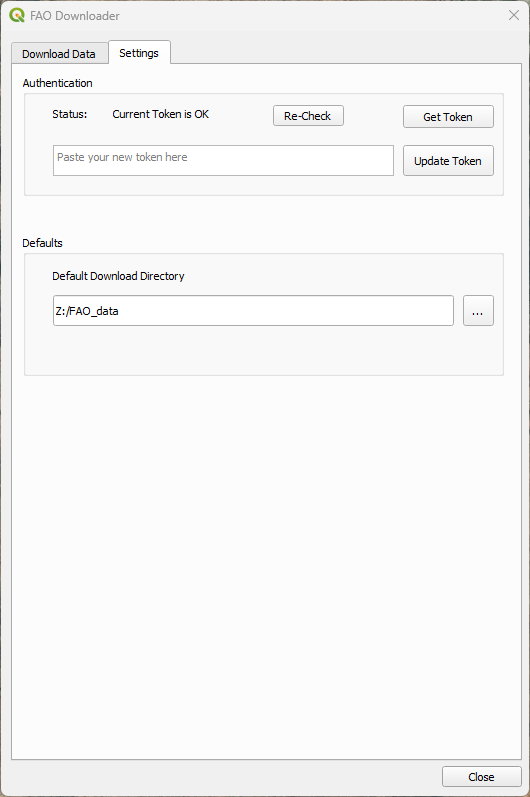
6. Download data
Now we have access to the FAO API, we are ready to download data.
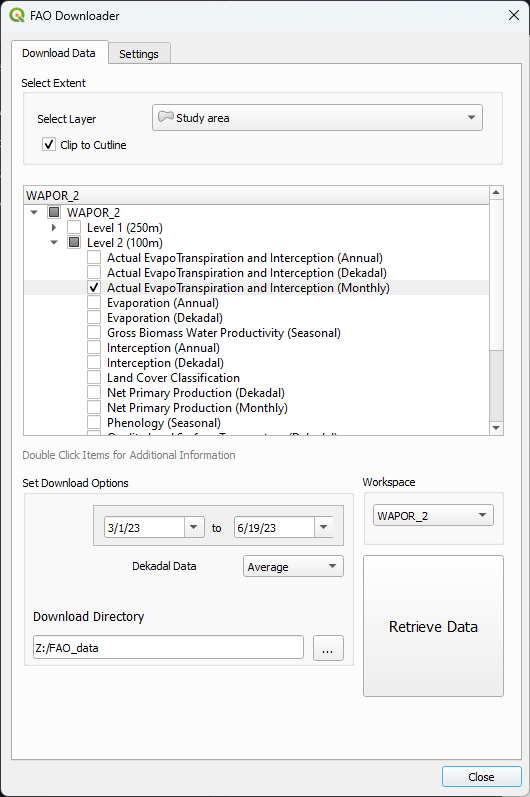
1. In the FAO Downloader plugin dialog go to the Download Data tab.
2. Under Select Extent, select the Study area polygon layer. This must be a single polygon layer.
3. Keep the Clip to Cutline checkbox checked. In this way the downloaded raster will be clipped to the study area polygon. When you uncheck the box, a rectangular raster will be downloaded.
You can download data from different FAO repositories. These are called workspaces.
4. Select the WAPOR_2 Workspace from the drop down list if it's not chosen by default.
5. Expand the tree of checkboxes in the center of the dialog to select which datasets you want to download.
6. Expand Level 2 (100m) and double click on Actual EvapoTranspiration and Interception (Monthly).
This will show you the metadata, including the units of the raster layer.
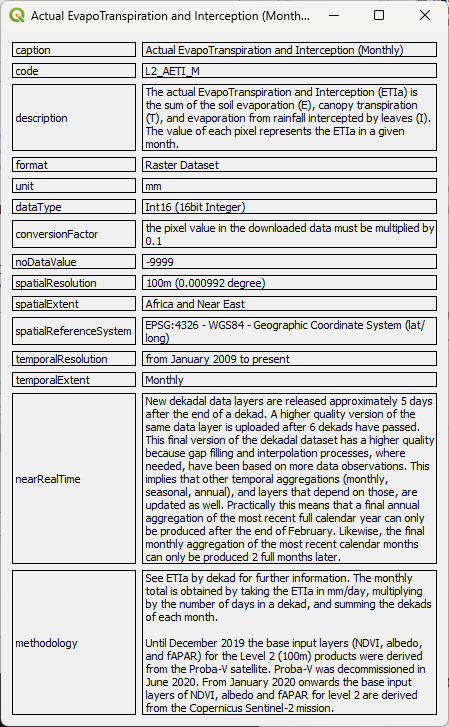
7. Close the metadata popup and check the box of the Actual EvapoTranspiration and Interception (Monthly) layer.
8. Define the date range. Here we choose from 1 March 2023 - 19 June 2023.
Note that for Dekadal data we need to define the format. By default, FAO supplies this data as average. You can change it to cumulative values if needed.
If you want to use the default Dowload Directory set under the Settings tab, you don't need to add a Download Directory here.
9. Click Retrieve Data to download the rasters.
The plugin shows the progress of the download.
10. Click Close to close the dialog.
In the next chapter we'll inspect the downloaded data.
7. Inspect the downloaded data
The downloaded rasters are stored in a subfolder within your set download folder.
1. Use the QGIS Browser panel to check the folder.
2. Right-click on the download folder (FAO_data) and choose Add as Favorite to have easier access to the contents of the folder.
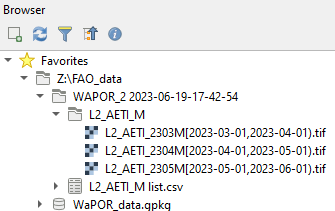
You can see that there's now a subfolder with the Workspace name and the data/time. Under that folder, there's a subfolder with the name of the product. Within that folder are the three rasters with the monthly AETI.
There's also a CSV file.
3. Drag the CSV file and the 3 rasters to the map canvas.
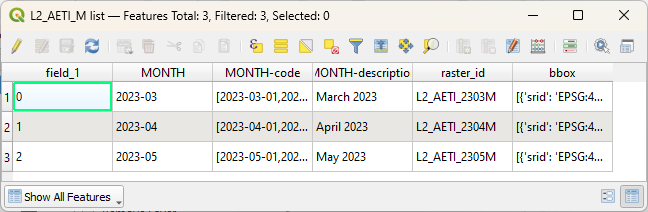
4. In the Layers panel, right-click on L2_AETI_M_list and choose Open Attribute Table from the context menu and inspect the contents of the CSV file.
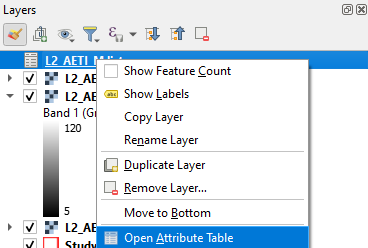
The attribute table show the downloaded months, raster ID's and the bounding box:
Let's style the raster layers and compare them.
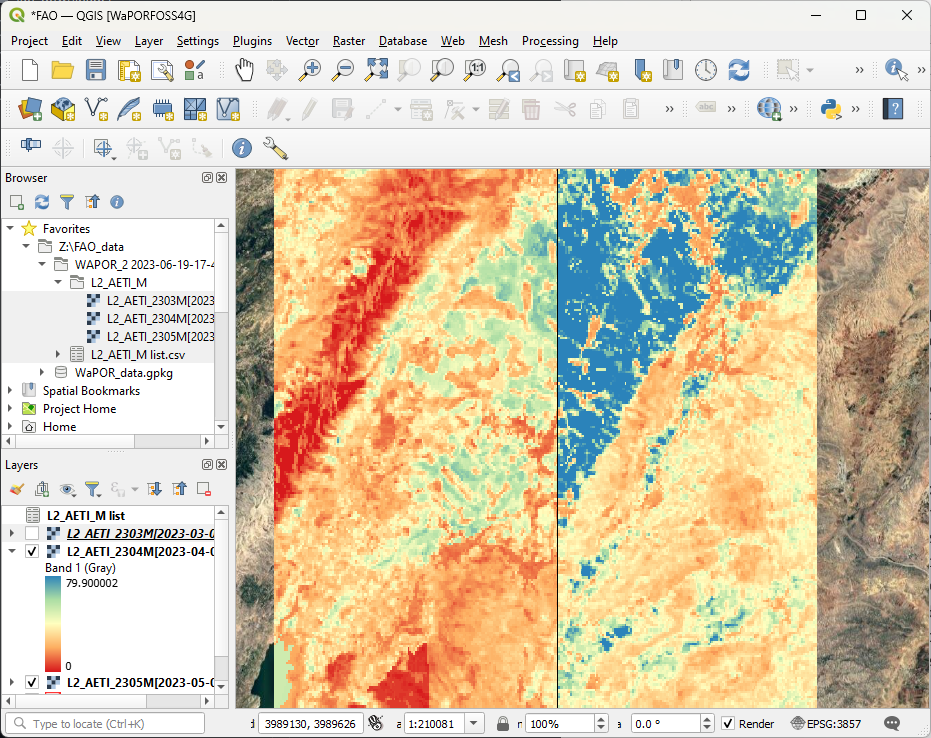
5. Click on the first raster layer (March) and click  to open the Layer Styling panel.
6. Change the renderer from Singleband gray to Singebland pseudocolor.
7. Click the arrow at Color ramp and choose an appropriate one, e.g. Spectral.
To keep the same color range, we'll copy the ramp to the other layers.
8. In the Layers panel, right-click on the raster that we've just styled and choose Style | Copy Style from the context menu.
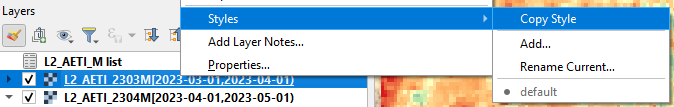
9. Now right-click on the second raster layer (April) and choose Style | Paste Style from the context menu.
10. Repeat this for the remaining layer.
11. Hide / unhide the layers to see the difference.
Tip: An easier way to compare the layers is to use the MapSwipe Tool plugin.
8. Conclusions
In this tutorial you've learned to install and use the FAO Downloader Plugin.