Tutorial: Filter Point Clouds
| Site: | OpenCourseWare for GIS |
| Course: | Point cloud processing with QGIS and PDAL wrench |
| Book: | Tutorial: Filter Point Clouds |
| Printed by: | Guest user |
| Date: | Wednesday, 29 July 2026, 9:49 PM |
1. Introduction
In the previous tutorial we've merged downloaded point cloud tiles into a Virtual Point Cloud (VPC) layer. In this tutorial we're going to filter the point cloud data to derive certain features. We'll apply a filter to the classification attribute to derive the elevation points of buildings. Then we'll use expressions to derive points above a certain height. Finally, we'll try to derive vegetation points, by using a filter with the return number.
After this tutorial, you're able to:
- check the attribute statistics of a point cloud
- filter point clouds based on the classification attribute
- filter point clouds using expressions
We're going to use one LAZ tile for this tutorial. You can use, for example, tile 65DN1_07.LAZ that covers most of the center of Middelburg.
2. Check statistics of point cloud attributes
Let's first check which attributes are available that we can use for filtering the points in the point cloud layer.
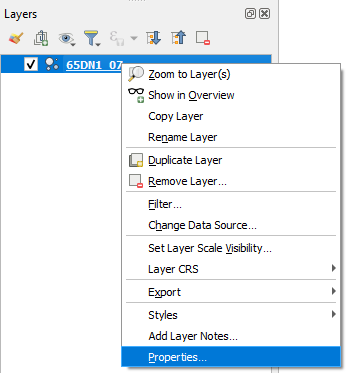
1. In the Layers panel, right-click on the point cloud layer and choose Properties... from the context menu.
2. In the Layer Properties dialog click on the Statistics tab.
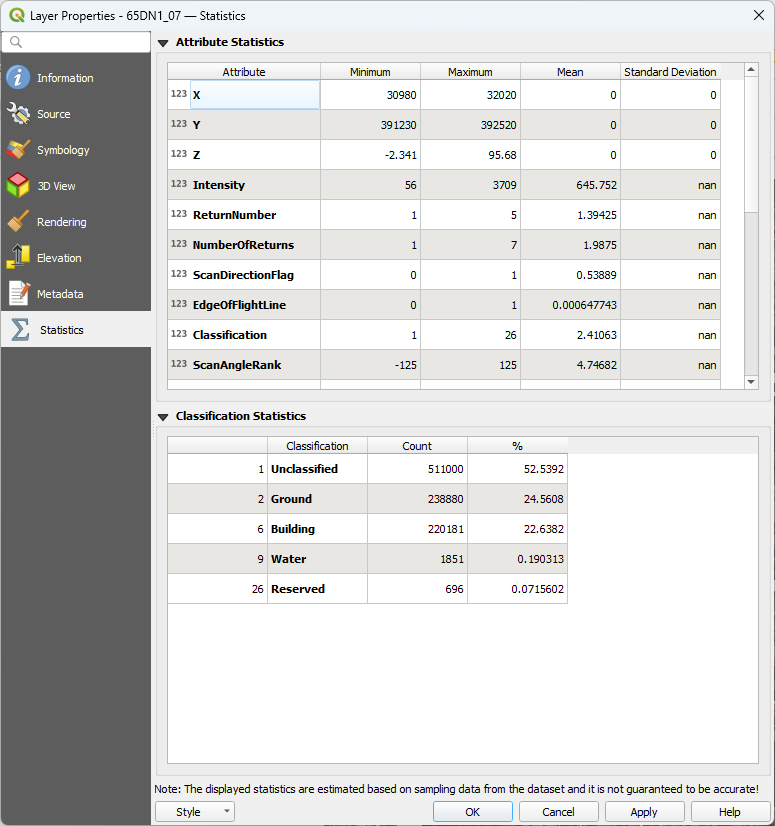
In the upper table you can see the attributes and their statistics (minimum, maximum, mean, standard deviation). In the lower table you can see the statistics for the Classification attribute. The Count column shows the amount of points in the class and the % column shows the percentage of points with that class.
| Atrribute | Description |
|---|---|
| x, y, z | Location information |
| GpsTime | The time at which the laser pulse was recorded |
| Intensity | The strength of the returned laser pulse |
| ReturnNumber | The order in which the laser pulse was returned |
| NumberOfReturns | The total number of returns for a given laser pulse |
| Classification | A code that defines the type of object that reflected the laser pulse |
| ScanAngleRank or ScanAngle | The angle at which the laser pulse was emitted from the sensor |
| RGB and Infrared | Color information for the point |
| ScanDirectionFlag | The direction in which the scanner mirror was moving when the laser pulse was emitted |
| EdgeOfFlightLine | A flag indicating whether the point is at the edge of a flight line |
| UserData | User-defined data |
| PointSourceID | An identifier for the source of the point data |
| Amplitude | Strength of the returned laser pulse |
| Reflectance | Amount of laser light that is reflected back to the sensor by the target object |
| ScannerChannel | Channel number of a LiDAR scanner |
We can use these attributes for visualisation of the point cloud data.
3. Click
 to open the Layer Styling panel.
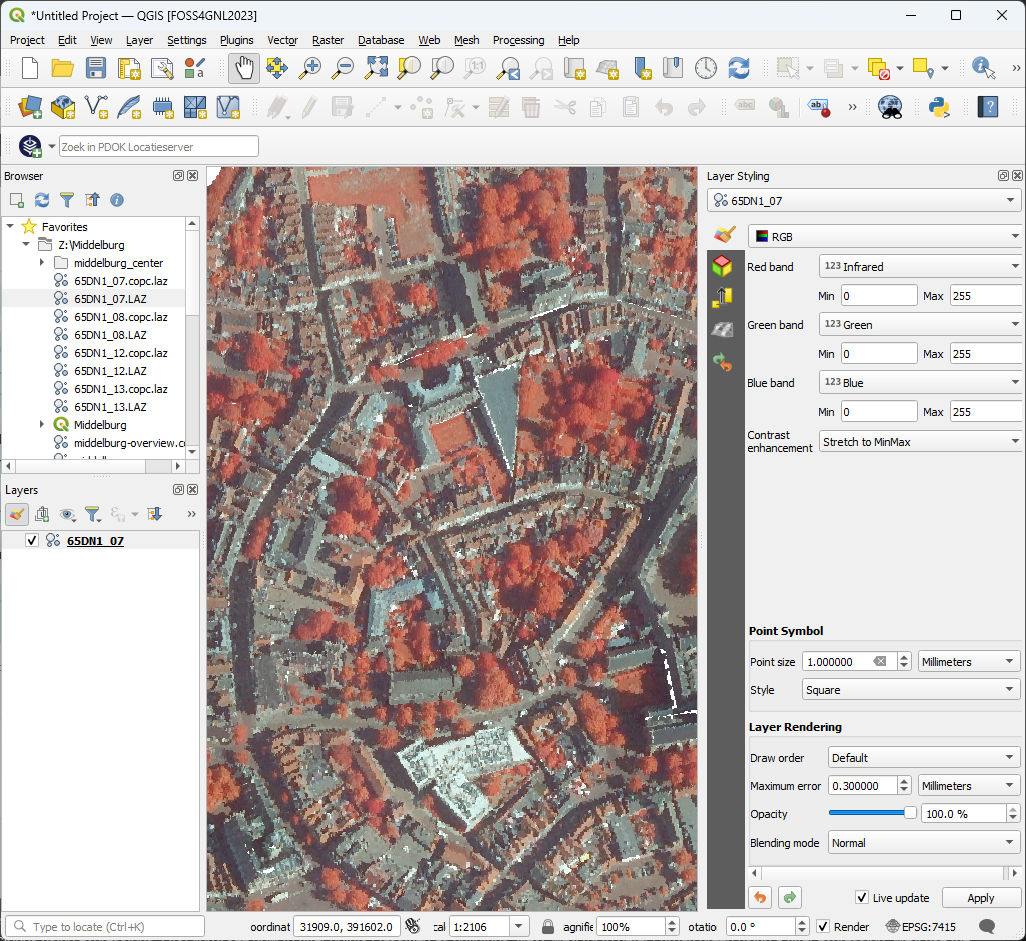
4. Make sure you see the data with the RGB renderer. Change the Red band to Infrared, keep the rest the same.
Now you can see in red the the points which represent vegetation:
5. Change the renderer to Classification.
- Which classes do you see?
- How does it correspond with the infrared visualisation of vegetation?
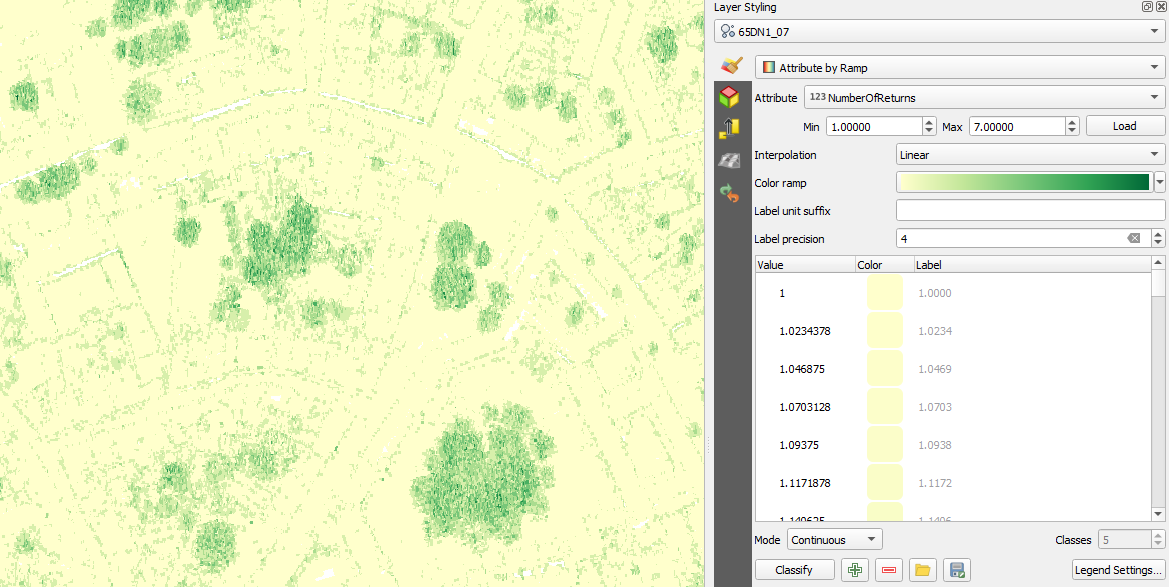
6. Change the renderer to NumberOfReturns.
7. Click the arrow at Color ramp, choose All color ramps and choose YlGn (from Yellow to Green).
- How does it correspond with the infrared visualisation of vegetation?
3. Filter on the classification attribute
Let's first filter the points which are classified as building.
1. In the Processing Toolbox go to Point cloud extraction | Filter.
2. In the Filter dialog select the point cloud tile as Input layer and click on  at Filter expression.
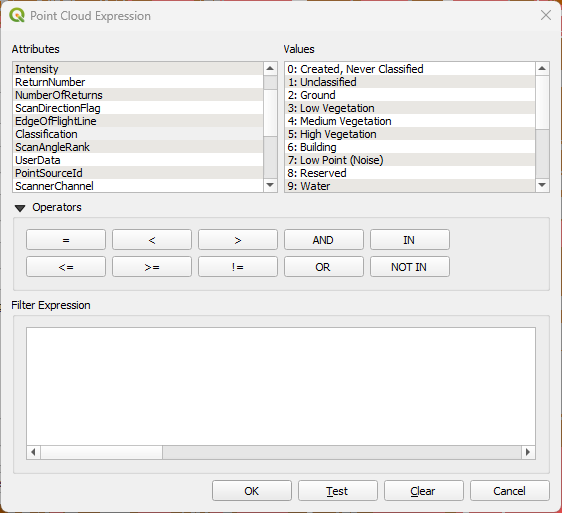
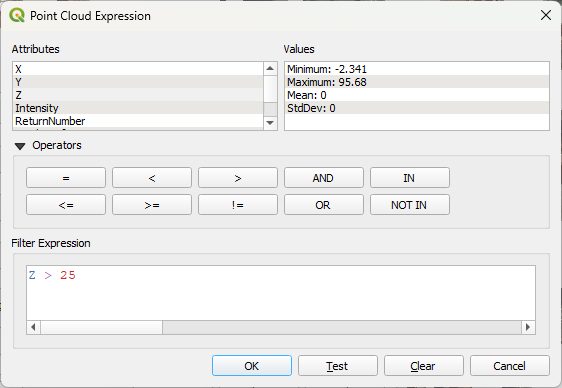
Now you can formulate an expression. In the upper left you see the available Attributes in the point cloud layer and in the upper right you see the Values of a selected attribute. For most attributes it will show the statistics. For the Classification attribute it will show the class numbers and description.
3. In the Attributes panel select the Classification attribute and check the classes in the Values panel.
Now we can formulate the expression to filter the building class.
4. Double-click on the Classification attribute so it will appear in the Filter Expression field. Then click the equal sign button under Operators so it's also added to the filter expression.
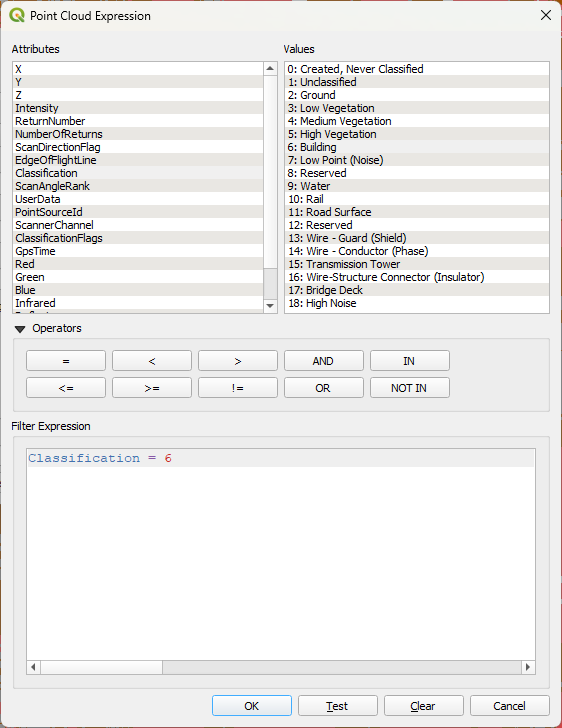
5. Now double-click on 6: Building in the Values panel to add it to the filter expression.
The filter expression should now look like this:
6. Click the Test button to check if the expression is valid.
If you see the following popup, the expression is valid:
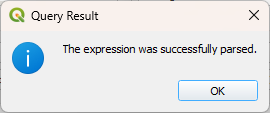
7. Click OK to close the Query Result popup.
8. In the Point Cloud Expression dialog click OK to add the filter expression to the Filter dialog.
In the Filter dialog you can also define a Cropping extent if needed. Here we'll apply the filter to the entire point cloud layer.
9. Use the Browse  button to define the output file name, for example buildings.laz.
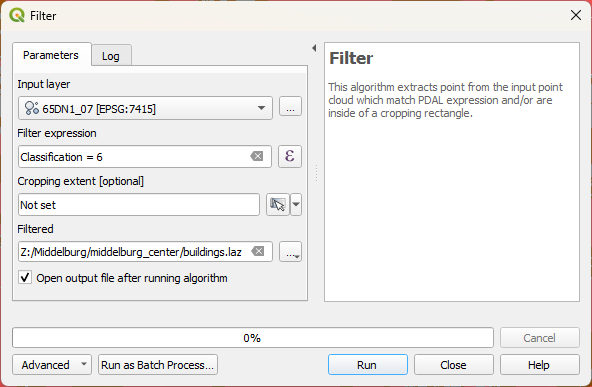
10. Click Run to apply the filter.
11. Click Close to close the dialog after processing.
QGIS will convert the resulting LAZ file to COPC in the background.
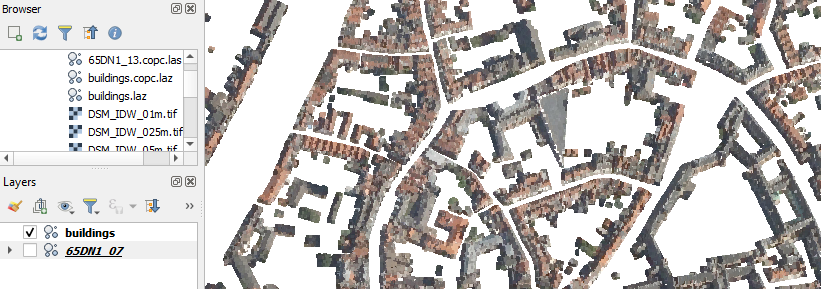
12. After the automatic conversion to COPC, hide the original point cloud layer in the Layers panel, so we can see the building points from the buildings layer.
Now we've used the Classification attribute to filter predefined classes. In the next chapter we'll use filters on other attributes.
4. Filter using expressions
In the previous chapter we've filtered the points that were classified as buildings. In this chapter we'll create filter expressions using other attributes.
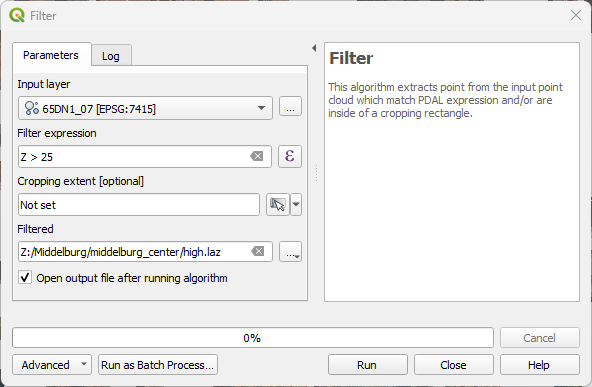
Let's first filter points based on their height using the Z attribute. We're going to filter points that are higher than 25 meters.
1. In the Processing Toolbox go to Point cloud extraction | Filter.
2. Make sure the original point cloud layer (e.g. 65DN1_07) is selected as the Input layer and click  to formulate the Filter Expression in the Point Cloud Expression dialog.
3. Formulate and test the expression Z > 25.
4. Click OK if the expression is valid.
5. Save the file as high.laz and click Run.
6. Check the result.
Maybe we're not interested in buildings, but in urban green. Let's see if we can use a filter to get the vegetation points.
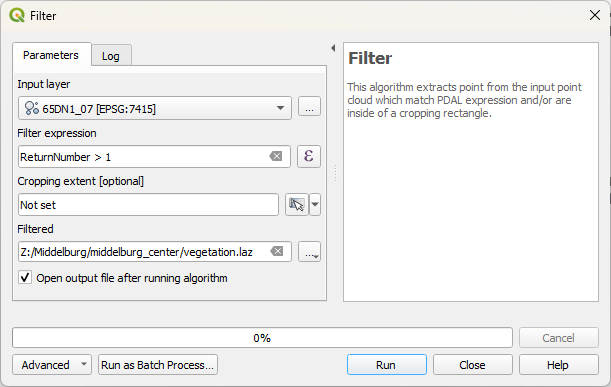
7. Go back to the Filter tool.
8. Make sure the original point cloud layer (e.g. 65DN1_07) is selected as the Input layer and click to formulate the Filter Expression in the Point Cloud Expression dialog.
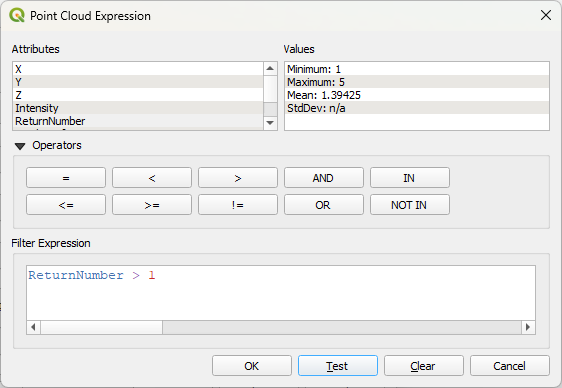
We're going to use the ReturnNumber attribute. We assume that if the ReturnNumber > 1, it is likely to be points in vegetation.
9. Create the expression, test the validity and click OK.
10. Save the file as vegetation.laz and click Run.
11. Click Close after processing and check the result. Zoom in to see the details.
- Does it only filter vegetation?
- If there's confusion, which other land cover is confused with vegetation?
Let's see if we can refine the filter to reduce the amount of building points.
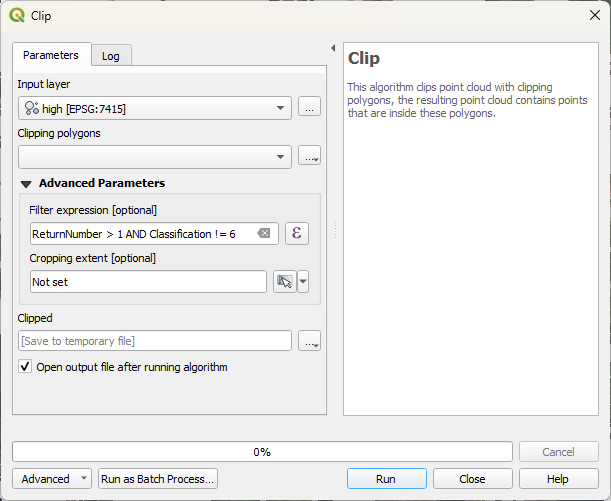
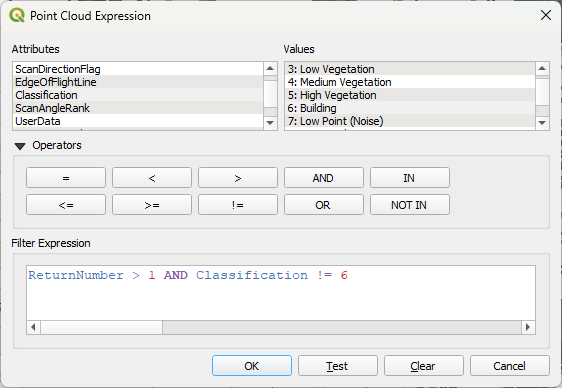
12. Go back to the Filter tool and create the following expression:
ReturnNumber > 1 AND Classification != 6
Make sure you use the buttons to add the operators and the classification value.
This expression means that it will filter points that have a return number larger than 1 and at the same time are not classified as buildings (value 6 of the Classification attribute).
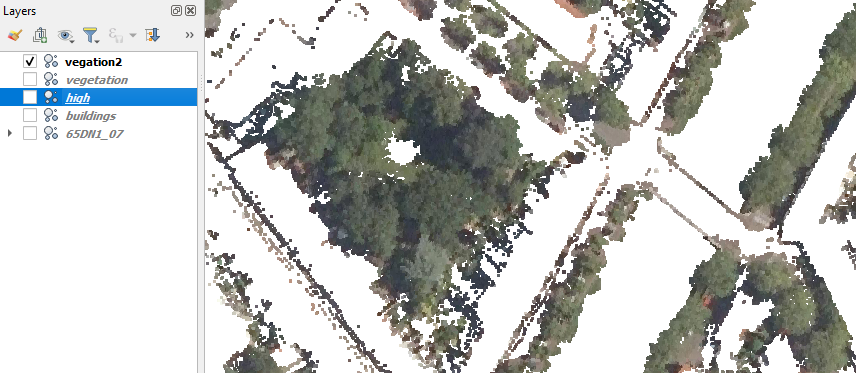
13. Test and run the filter if the expression is valid. Save the result as vegetation2.laz.
14. Check the result.
- Did the filter improve the result compared to the previous result?
- Try to further improve the result using other filter expressions.
5. Using filters in other point cloud tools
In some of the point cloud processing tools you can add a filter in a similar way as we've done in this tutorial. The processing tool will then be applied only to the filtered points.
You can add the Filter expression under the Advanced Parameters section in the dialogs of the tools that support filtering, for example the Clip tool: