Urban Heat Island Analysis
| سایت: | OpenCourseWare for GIS |
| درس: | Planning for Urban Climate Adaptation |
| کتاب: | Urban Heat Island Analysis |
| چاپ توسط: | Guest user |
| تاریخ: | دوشنبه، 13 ژوئیهٔ 2026، 1:13 AM |
1. Introduction
In this tutorial, we'll analyze the urban heat island effect. We'll use satellite data on vegetation and temperature.
You'll calculate NDVI from a Sentinel 2 image and you'll apply zonal statistics to analyse the greenness in neighbourhoods. Finally you'll compare the greenness to the temperature in the neighbourhoods.
2. Preparation
1. Open the project from the first tutorial.
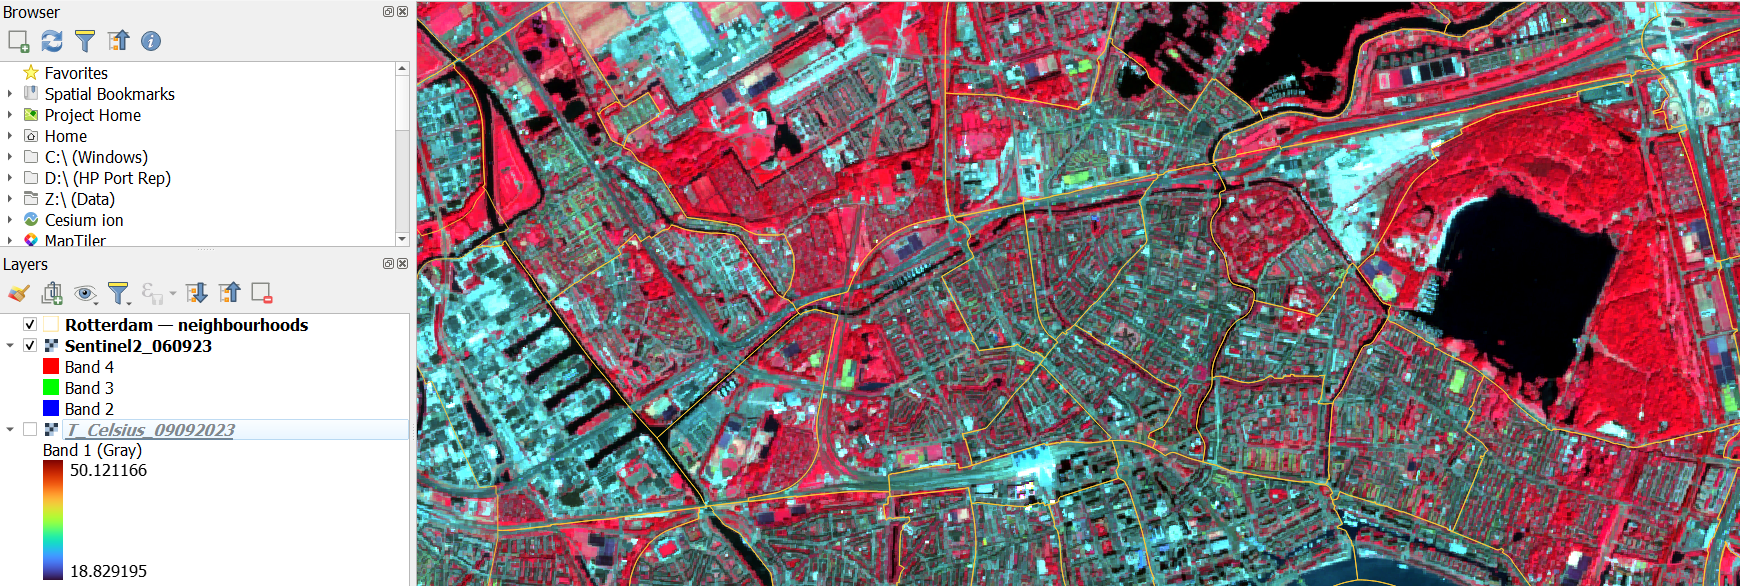
2. Remove all layers except Sentinel2_060923, T_Celsius_09092023 and neighbourhoods.
3. Save the project under a new name in your GeoPackage, for example urban heat island.
3. Calculate NDVI
A very common index for healthy vegetation is the Normalized Difference Vegetation Index (NDVI).
This is the equation:

where NIR is the Near Infrared Band and Red is the Red band of a remote sensing sensor.
Values that are positive indicate healthy vegetation. The higher the value the more green biomass is present. Negative values indicate water bodies.
Here we'll derive NDVI from the Sentinel image. We'll use the Raster Calculator.
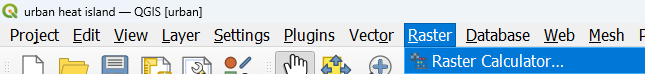
1. In the main menu, go to Raster | Raster Calculator....
2. Compose the the equation above as an expression. Band 4 is the NIR band and band 3 is the red band.

3. Save the result as NDVI_060923.tif.
4. Click OK.
- Is the NDVI raster layer boolean, discrete or continuous?
- Which renderer should we use to style the NDVI layer?
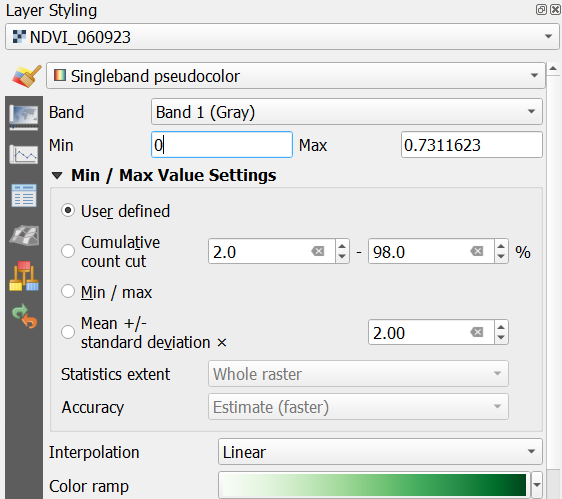
5. Go to the Layer Styling panel and make sure NDVI_060923 is the active layer.
6. Change the renderer to Singleband pseudocolor.
7. Choose a green ramp and change the minimum value to 0 to have better contrast.
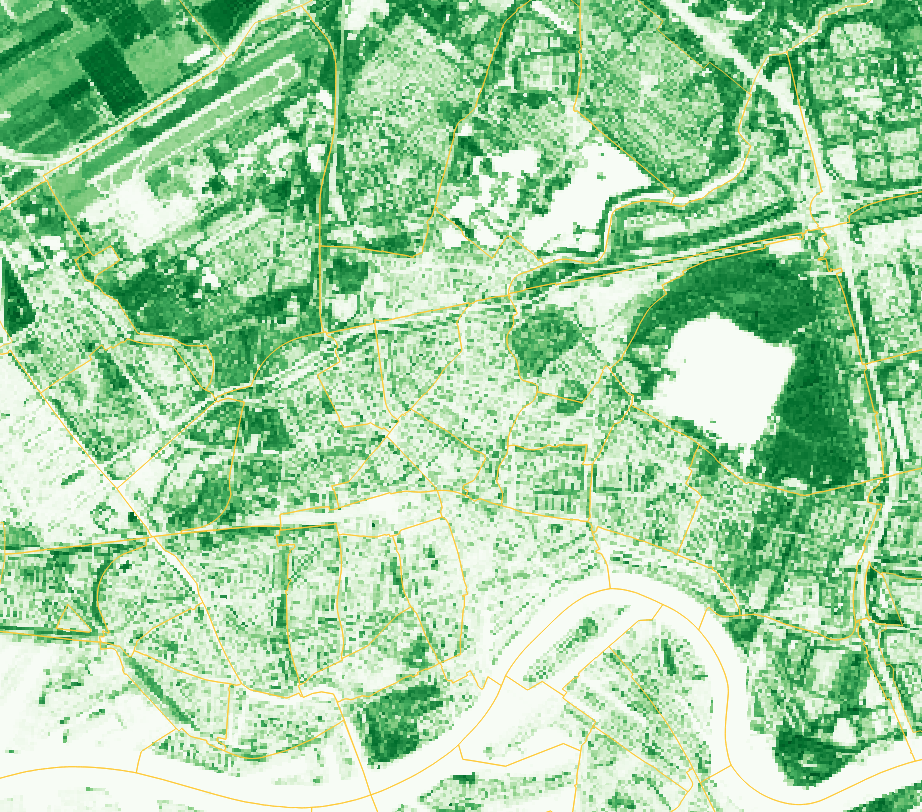
This image gives us a good overview of healthy green vegetation in the city.
In the next section, we'll evaluate how this varies per neighbourhood.
4. Zonal statistics
In this section, we're going to evaluate how temperature and green space vary between different neighbourhoods.
We'll use zonal statistics.
1. In the Processing Toolbox, go to Raster analysis | Zonal statistics.
2. In the Zonal Statistics dialog, choose neighbourhoods as Input layer and NDVI_060923 as Raster layer.
3. Change the Output column prefix to NDVI_. Later we'll add the temperatures, so in this way we can easily distinguish the fields.
4. For Statistics to calculate, choose Mean, St dev, Minimum and Maximum.
5. Save the result to the GeoPackage with the name NDVI per neighbourhood.

6. Click Run. Click Close after processing.
7. Check the attribute table.
8. Style the NDVI per neighbourhood with the Graduated renderer. Use the NDVI_mean field and a green colour ramp.
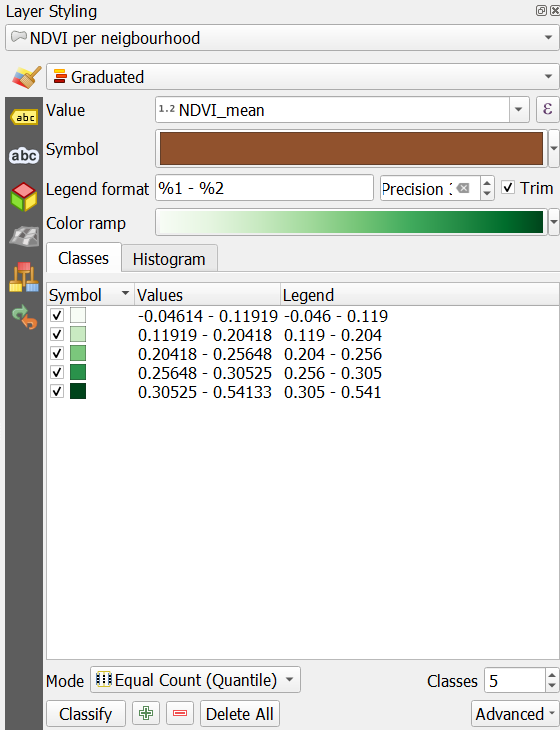
9. Add labels with buurtnaam as we did before.
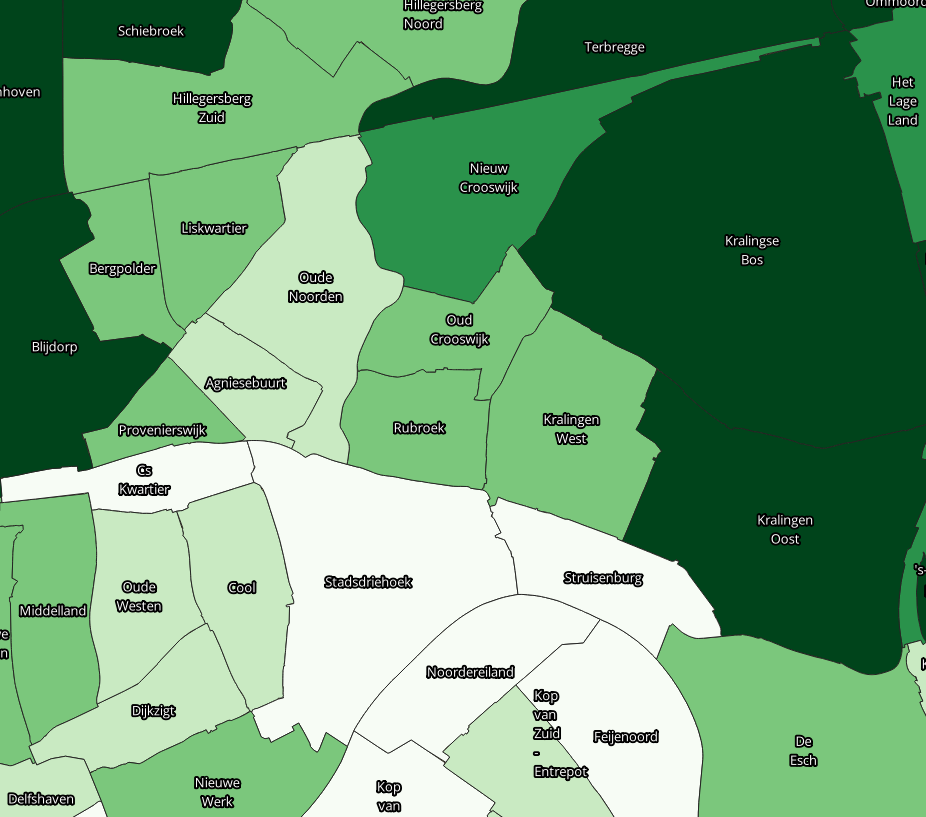
- Which neighbourhoods have the highest mean NDVI values?
- How is this related to the census data in the attribute table?
- What about the range and standard deviations in the neighbourhoods?
10. Repeat the zonal statistics calculation for the T_Celsius_09092023 layer. Add the statistics to the NDVI per neighbourhood attributes.
If you get the error that there's a problem with the geometries, you need to fix them. Go to the Processing Toolbox. Click  to activate in-place editing and apply the Fix geometries tool. Save the edits and unselect the features. Then try again to run the Zonal statistics tool.
11. Style the polygons and label them in the same way.
12. Compare the results of temperatures and NDVI per neighbourhood.
- What can you conclude if you look at how the mean temperature relates to mean NDVI per neighbourhood?
- What can you conclude if you look at how the max temperature relates to mean NDVI?
- What other factors determine the temperature in the neighbourhoods?

This video shows more about zonal statistics:
5. Conclusions
In this tutorial you have learned to evaluate NDVI and temperatures in different neighbourhoods in a city using satellite data and zonal statistics.