Introduction to Felt
| Site: | OpenCourseWare for GIS |
| Course: | Planning for Urban Climate Adaptation |
| Book: | Introduction to Felt |
| Printed by: | Guest user |
| Date: | Monday, 13 July 2026, 12:11 AM |
1. Introduction
Felt is an online map-making platform. It allows users to create, visualize, analyze, and share maps.
Felt integrates with QGIS through a plugin. This enables users to turn their QGIS projects into interactive web maps with features like live collaboration and commenting.
The tool makes it easy for users to work together on maps and data, and to gather feedback from teammates, guests, or the public. Furthermore, Felt offers a range of analysis tools to manipulate and process spatial data, as well as options to customize the appearance and functionality of maps.
2. Create an account
1. Create a free account through Felt: https://felt.com/
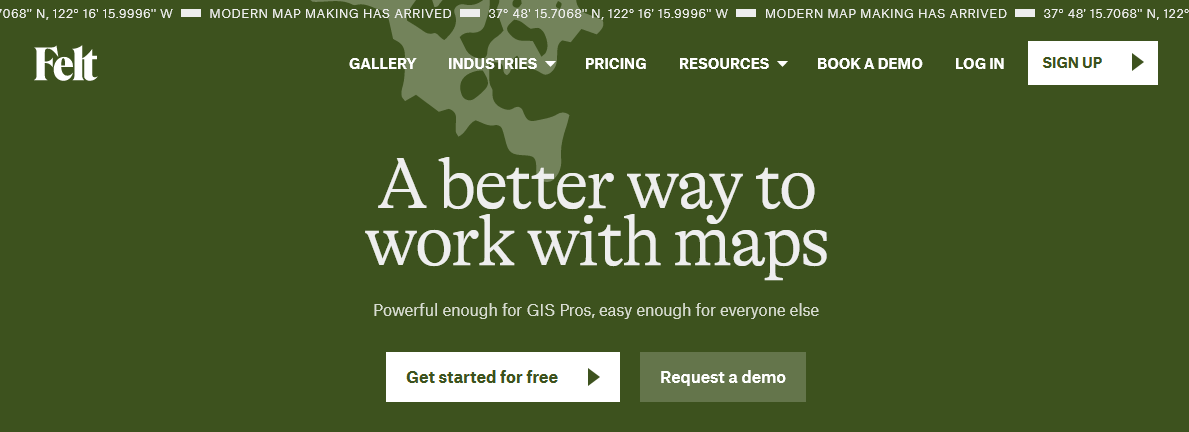
2. Click Get started for free.
3. At Work email, you must type your IHE Delft e-mail address. Add your Full Name and choose a password.
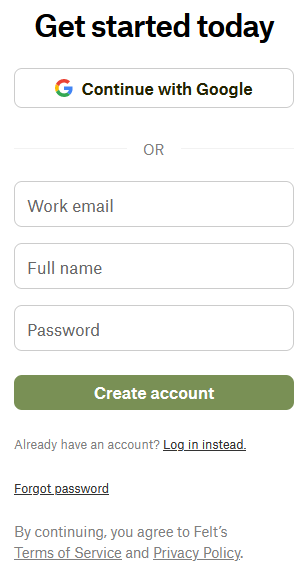
3. Click Create account.
3. Learn to use Felt
Now you have your account, let's get familiar with the basics of Felt.
1. Go to the "Learn to Use Felt" tutorial here: https://felt.com/map/Tutorial-Learn-to-Use-Felt-ScwGqgRZTY6Qr0vW2KbDsC
2. Click on Felt in the upper left corner and from the menu, choose File | Duplicate to my maps.
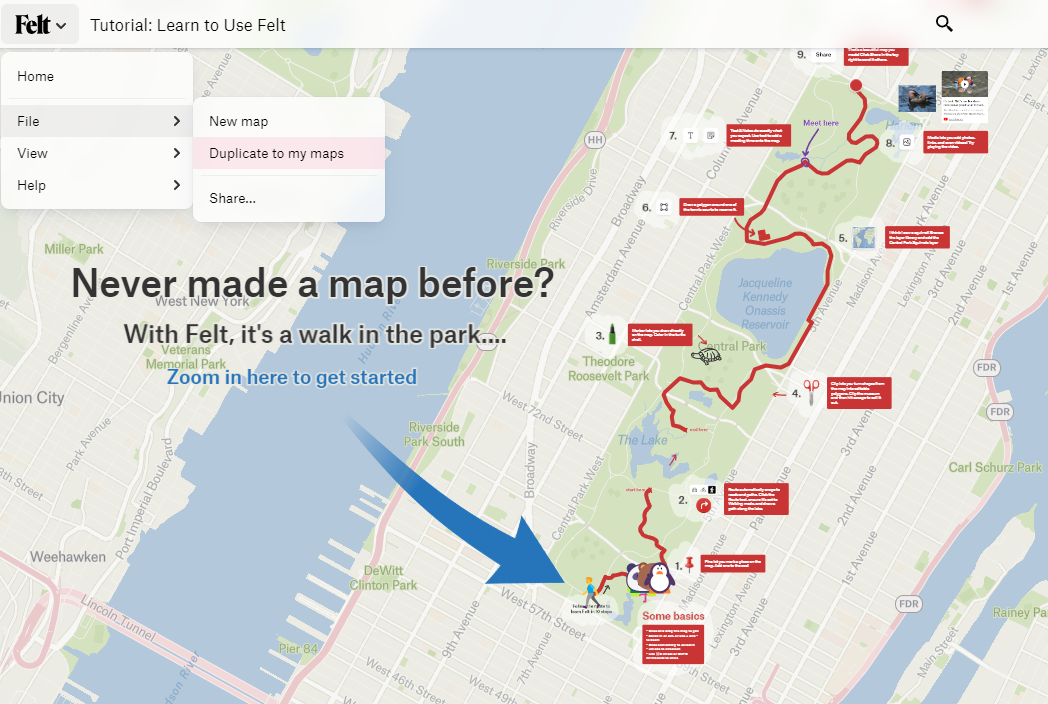
3. Follow the tutorial and get familiar with the features
4. Look at examples
Check out the following examples:
5. Create a new workspace
For this exercise, you're creating a new personal workspace where you can experiment with Felt.
1. Click on Felt in the upper left.
2. From the menu choose Create workspace.
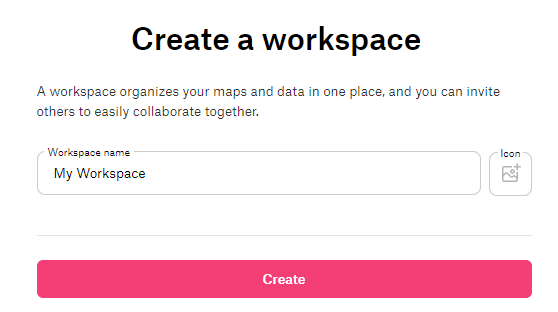
3. Type My Workspace and click Create.
4. Don't invite teammates, just click Done.
6. Create a new project
In the left panel, you'll now see:
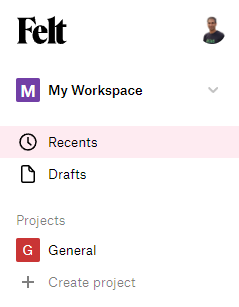
- Recents: your recent maps
- Drafts: draft maps
Then under projects there's always General and you can create your own private or public projects below.
1. Click Create project.
2. Call the new project My first project. You can also upload an icon. With your free personal account you can only select to give access to all members.
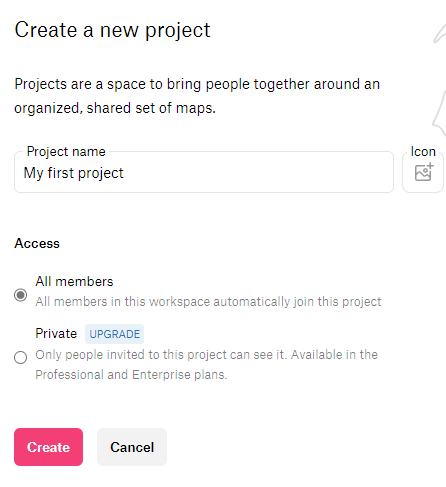
3. Click Create.
So now you have a project under your workspace. You can have multiple projects under a workspace. Here we'll use the one just created.
7. Create your first map
Let's create our first map in this project. You can have multiple maps per project. You can also create folders to organize your maps, using  . Here we don't need folders.
1. Click  or on Create a map here.
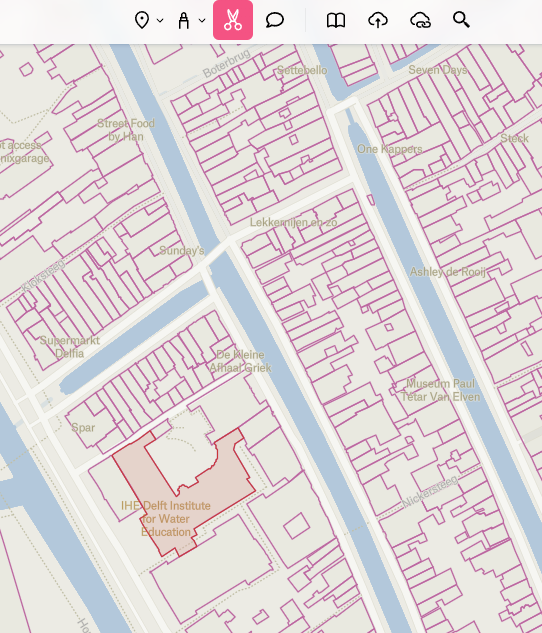
2. In the upper left change the name from Untitled Map to Delft.
3. Click  and search for Delft.
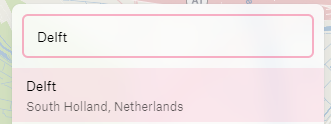
4. Choose Delft, South Holland, Netherlands.
Note that the map zooms to Delft and also places a pin with the label Delft.
7.1. Extract objects
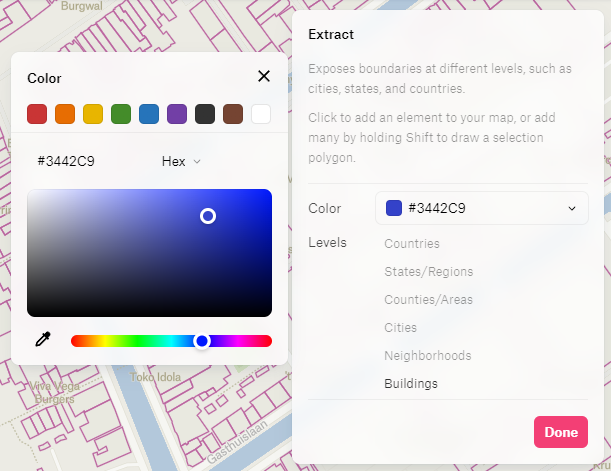
Let's first extract the IHE Delft building.
1. Zoom in to IHE Delft.
2. Click on  and then on the IHE Delft building.
3. Change the colour to blue, which is nicer for a water institute. Click Done.
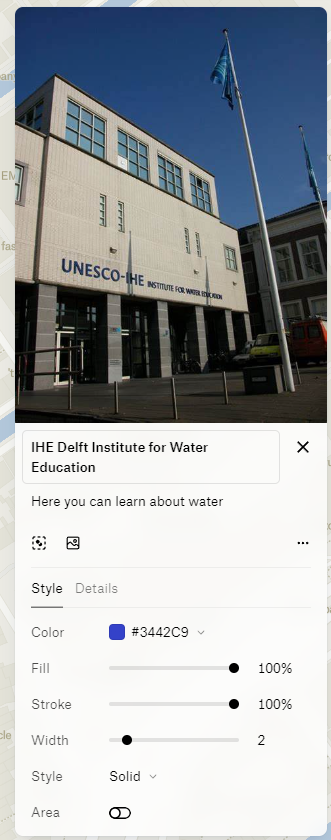
4. Click on the IHE building and add a name an description. You can also upload a picture.
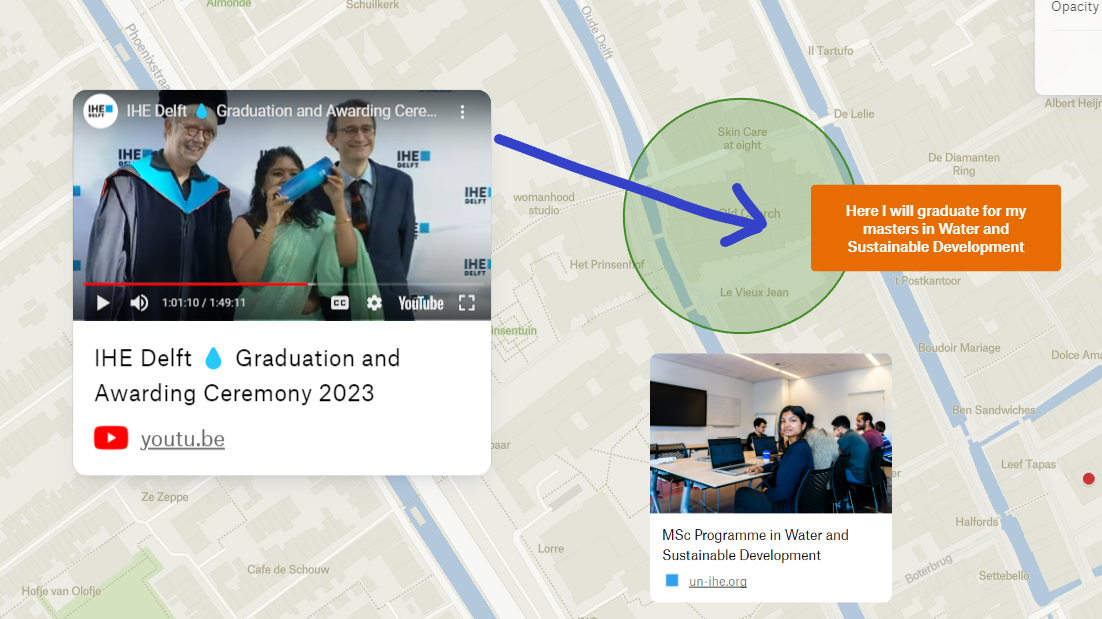
7.2. Add text
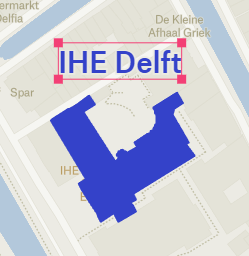
Let's add a label to the building.
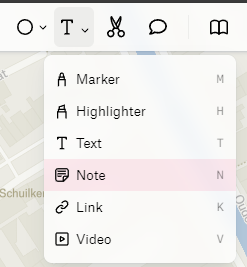
1. Click Text.

2. Click close to the IHE Delft building and type IHE Delft. Make sure the colour is also blue.
7.3. Add a pin
Now let's add a pin at the student housing at Mina Krusemanstraat.
You can use  to search for the address or pan the map to the correct building.
1. Click on Pin.
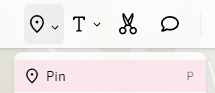
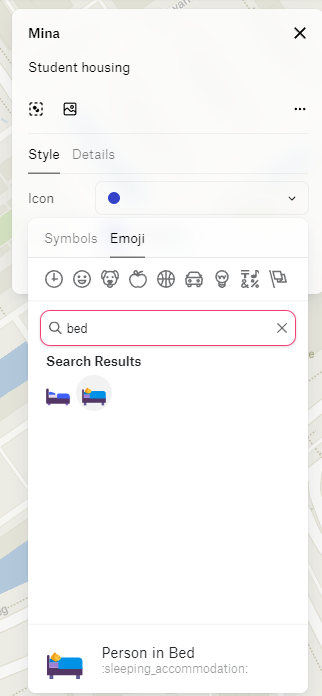
2. Click on the building of the student housing and type Mina as a label.
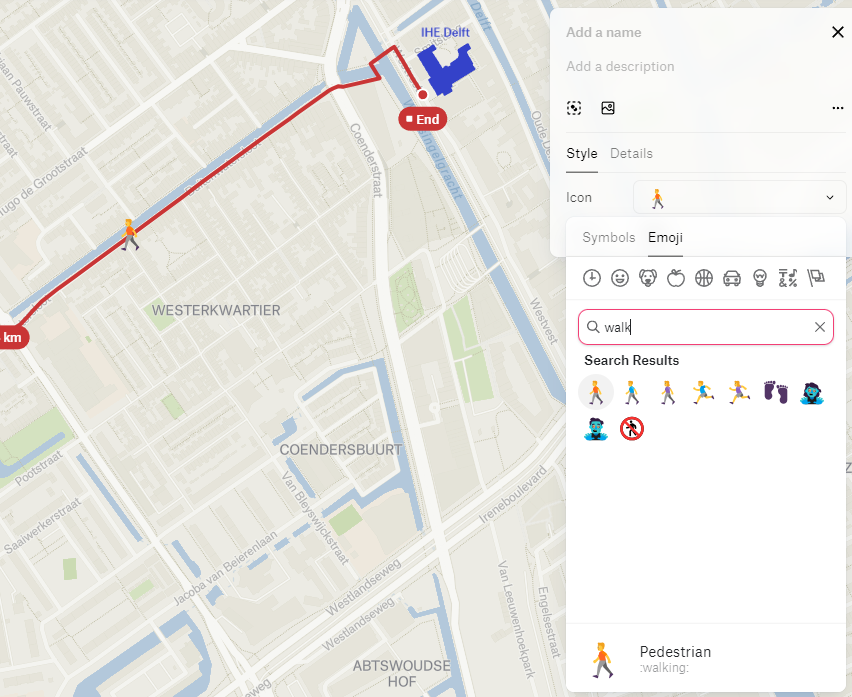
3. Add a description: Student housing.
4. Choose an icon. You can search for example for an emoji.
7.4. Add a route
Now we're going to add the route from Mina to IHE Delft.
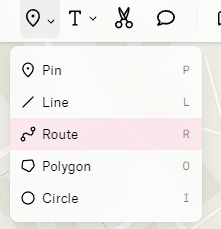
1. Click on Route.
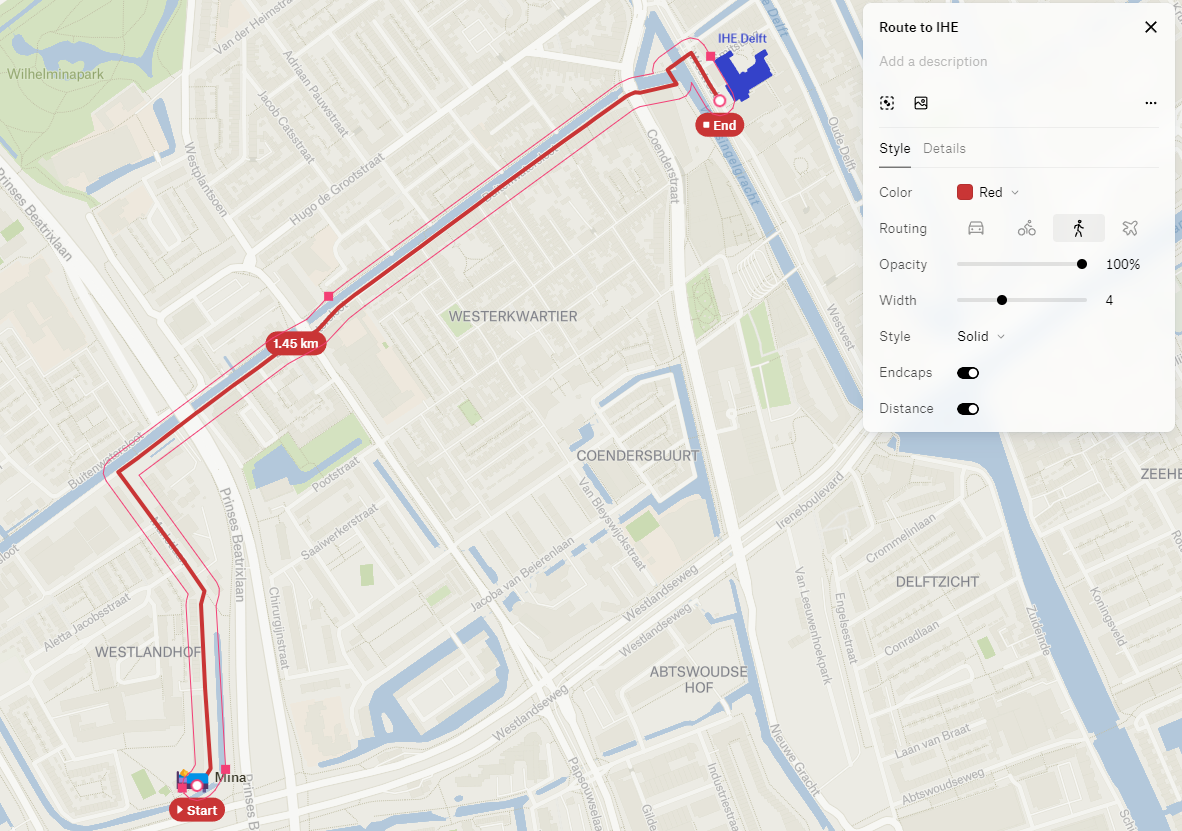
2. Click on Mina and IHE Delft and the route will be automatically added.
3. Change the Color to red.
4. Change Routing to pedestrian  .
.
5. Add Route to IHE as name.
6. Switch on Endcaps and Distance.
7. Add pins around the route with a pedestrian, so it's clear that it's a walking route. You can copy and paste several along the route.
7.5. Add a circle
In the same way, we can add circles and polygons.
1. Zoom in to the Old Church.
2. Choose Circle.
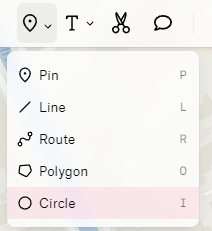
3. Draw a circle around the Old Church.
4. Change the Color to green. Add the name Old Church.

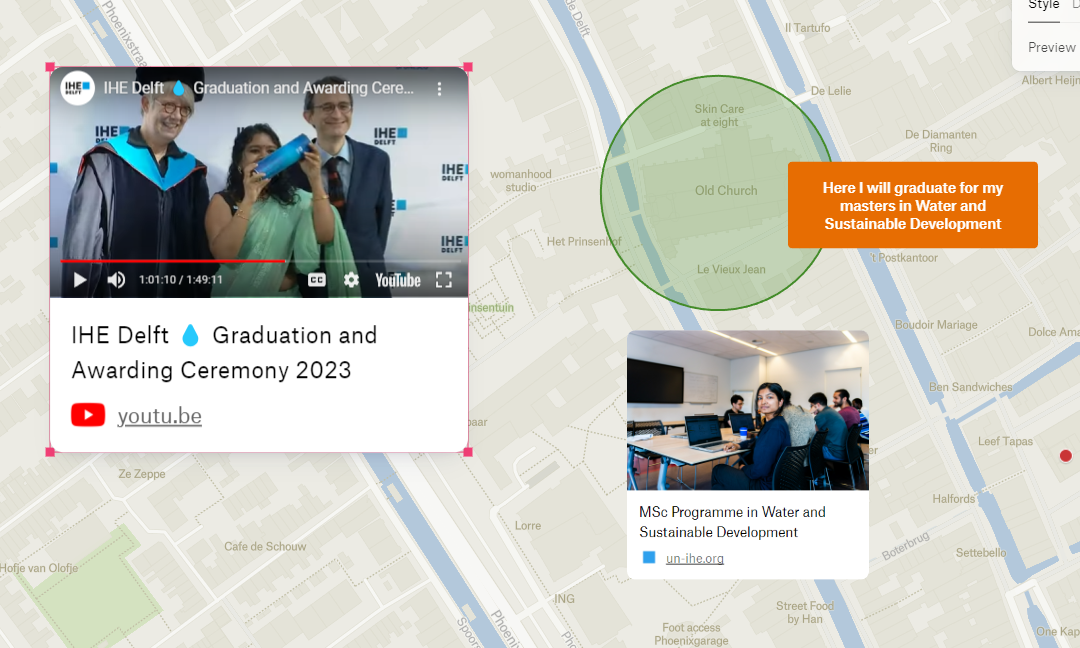
7.6. Add a note
Let's add a note next to the Old Church.
1. Select Note.
2. Click close to the Old Church outside of the circle.
3. Add the text: Here I will graduate for my masters in Water and Sustainable Development.
4. Center the text and choose an orange colour.

7.7. Add a link
Now we're going to add a link to the IHE Delft webpage about the MSc programme.
1. Choose the Link tool.

2. Click under the Old Church outside of the circle.
3. Paste the following link: https://www.un-ihe.org/education/master-programmes/msc-programme-water-and-sustainable-development and click Add.
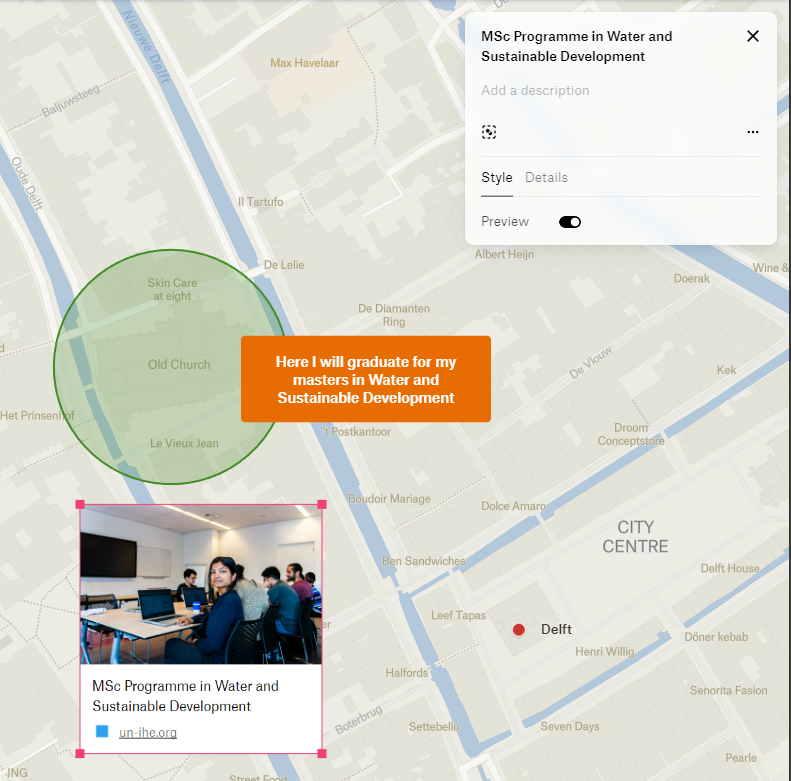
Note that you can edit the Name, add a description and hide the preview.
7.8. Add a video
Now let's add a YouTube video.
1. Choose the Video tool.
2. Click left of the circle and paste the following link:
https://youtu.be/bjdjxhf-nGI?si=7KZOs7DQ193BjmrE
3. Resize the box.
4. Play the video to test if it works.
7.9. Add an arrow
Now create an arrow that points from the video to the old church.
1. Choose the Marker tool
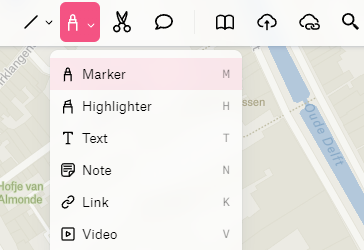
2. Draw an arrow.
7.10. Add a comment
Let's add a comment. If you share your map with other users, they can also add comments and you'll see their cursors in real time.
1. Click the Comment tool.

2. Zoom out and click close to the IHE Delft building.
3. Add the following comment: I'm now following the course Planning for Urban Climate Adaptation here.
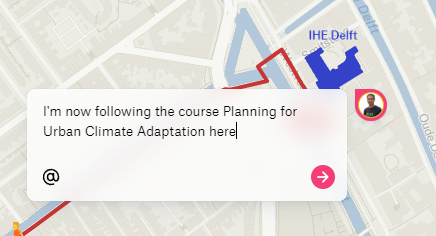
Note that if you have shared your map, you can mention someone by clicking @.
4. Click  to post the comment.
If you type ESC, the comment will be hidden and you'll just see your avatar. When someone clicks on the avatar, the comment appears and you can reply.
7.11. Add layers from the library
Felt comes with a map library.
1. Click  to open the library.
2. Search for parks.

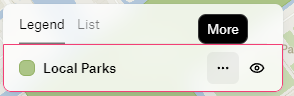
3. Click on Local Parks to add it to the map.
4. Close the library by clicking  .
.
Now you can see the parks on your map.

5. Click on a park and see what happens.
6. In the legend click on the 3 dots.
7. Choose View data...
Now you can see the attribute table of the park polygons.
8. Select Local Parks in the Legend.
In the panel on the right side, you can now change many properties for visualizing the parks and their labels.
9. Play with these settings.
10. Try some other layers from the library.
7.12. Change the backdrop
By default a backdrop from OpenStreetMap is used. Let's change this.
1. In the upper right, click 
2. Choose Satellite.
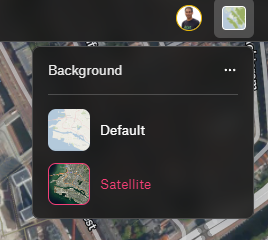
Note that with the 3 dots you can also add a layer using an URL.
7.13. Upload anything
With the Upload anything tool, you can add anything to the map.
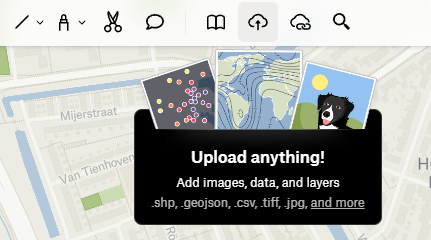
If it is georeferenced, it will be added at the correct location.
Try it if you have pictures from Delft or any other data!
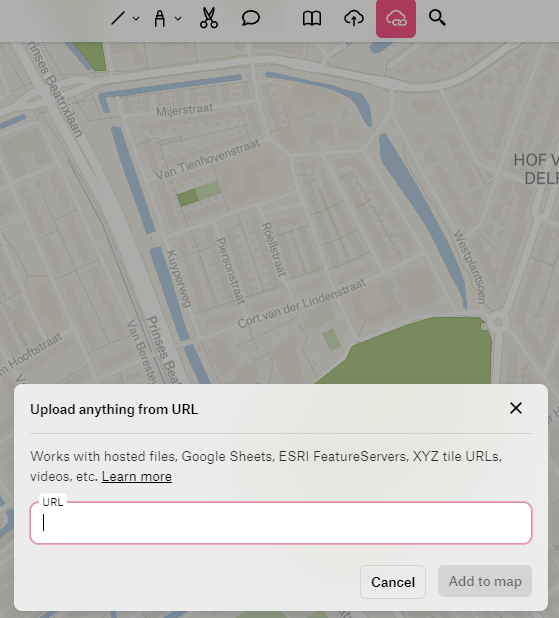
7.14. Upload from URL
If you have web services of GIS layers, you can try to add them with the Upload from URL tool.
8. Share your map
When your map is finished, you can share it with others.
1. Click the  button.
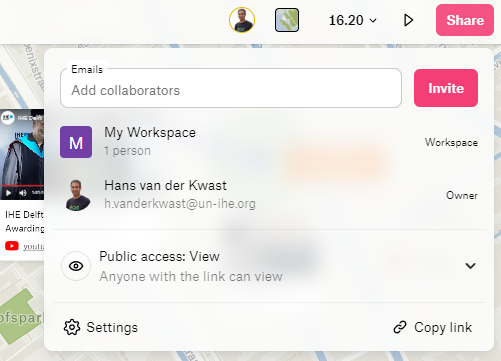
There you can copy a link and set the access rights for public access.

You can also invite collaborators by e-mail.
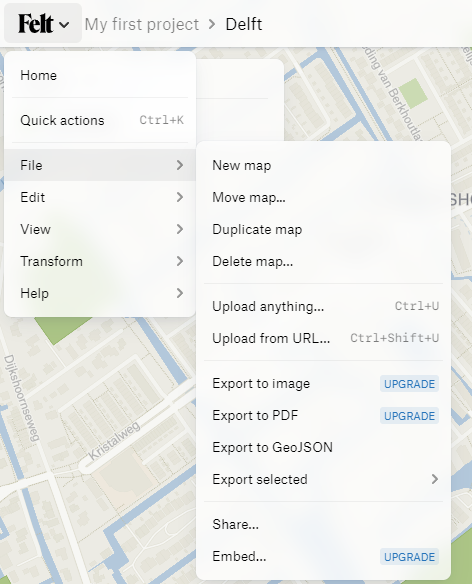
9. Processing tools
Felt has some processing tools that you can use. You can find them in the Felt menu under Transform.

10. Export to QGIS
You can export your map to QGIS by exporting (all) elements to a GeoJSON.