NetCDF in QGIS
| 站点: | OpenCourseWare for GIS |
| 课程: | Using Mesh Data in QGIS |
| 图书: | NetCDF in QGIS |
| 打印: | 访客用户 |
| 日期: | 2026年07月17日 星期五 01:35 |
1. Introduction
QGIS supports reading and visualising NetCDF data as raster or mesh layers. You can also export layers in a NetCDF to other raster formats, such as GeoTIFF.
A NetCDF (Network Common Data Form) is a format that is used for array-oriented scientific data. A NetCDF file is self-describing, i.e. it includes metadata that describes the data it contains. It is widely used in climate science, meteorology, oceanography, and other fields.
A NetCDF file is defined by:
- Dimensions: the axes of the data arrays (e.g. time, latitude, longitude)
- Variables: data values defined over the dimensions
- Attributes: additional information about the data (e.g. units)
In this tutorial you'll learn to:
- Load NetCDF raster data in QGIS
- Style NetCDF raster data
- Animate temporal NetCDF rasters (only in QGIS 3.38 or newer)
- Export NetCDF raster data to GeoTIFF
- Load NetCDF as mesh
- Style NetCDF mesh
- Export time series values from points
For the tutorial you can use the NetCDF file from the main course page. It's an output file of PyWAPOR.
2. Load raster layers from NetCDF
In this chapter, we're going to load NetCDF layers as rasters into QGIS.
1. Start QGIS Desktop.
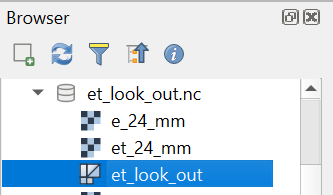
2. In the Browser panel, locate et_look_out.nc and expand the contents by clicking the arrow.
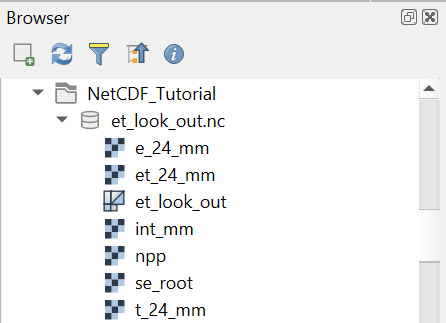
You can see that the NetCDF file has the ![]() icon that indicates that it contains layers.
icon that indicates that it contains layers. ![]() indicates raster layers, while
indicates raster layers, while ![]() is used for mesh layers. In this chapter we'll focus on the raster layers.
is used for mesh layers. In this chapter we'll focus on the raster layers.
3. Select the et_24_mm raster layer and drag it to the map canvas.
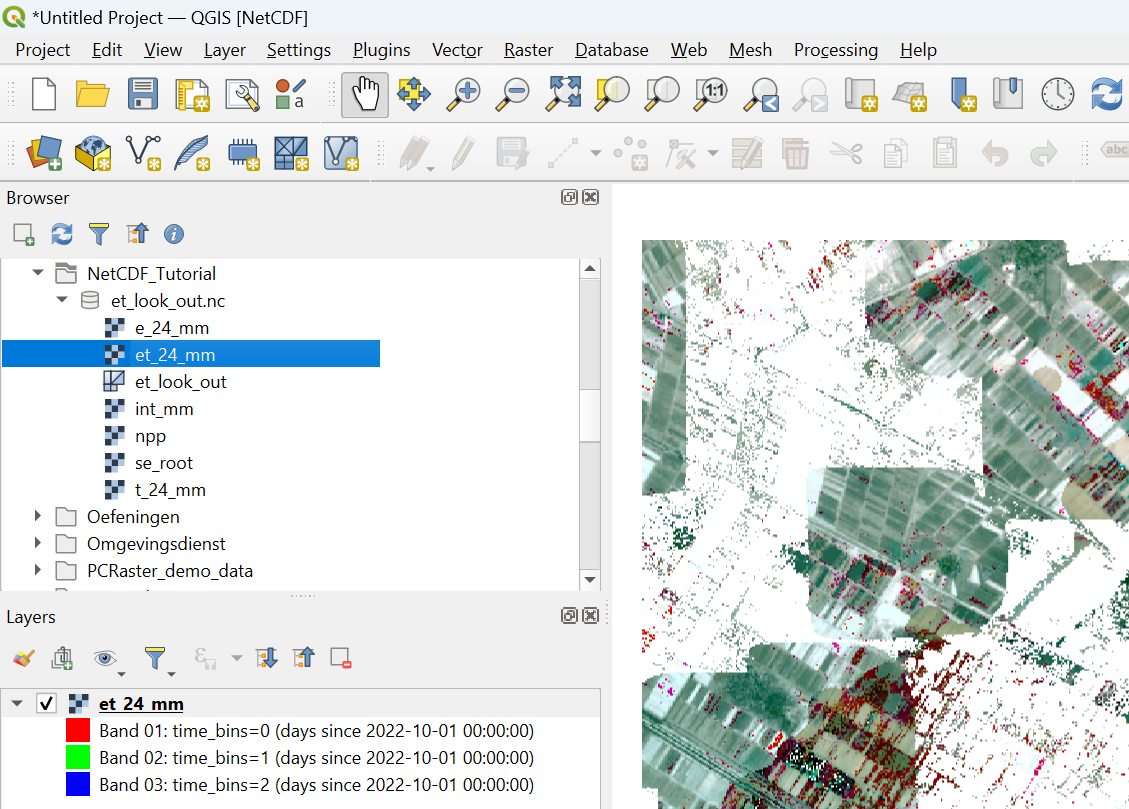
Because the raster layer contains a layer for every day in the dekad, it is by default visualised as a multiband raster. This is not very useful for this type of information. Let's change that.
4. In the Layers panel, click ![]() to open the Layer Styling panel.
to open the Layer Styling panel.
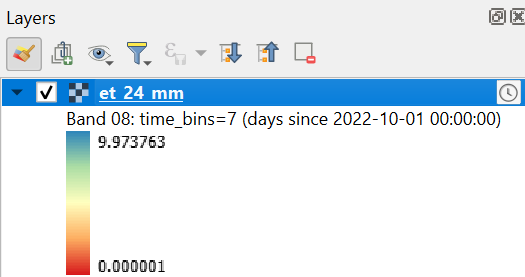
5. In the Layer Styling panel, change the renderer from Multiband color to Singleband pseudocolor.
6. At Band, use the drop-down menu to choose a time step, e.g. Band 08.
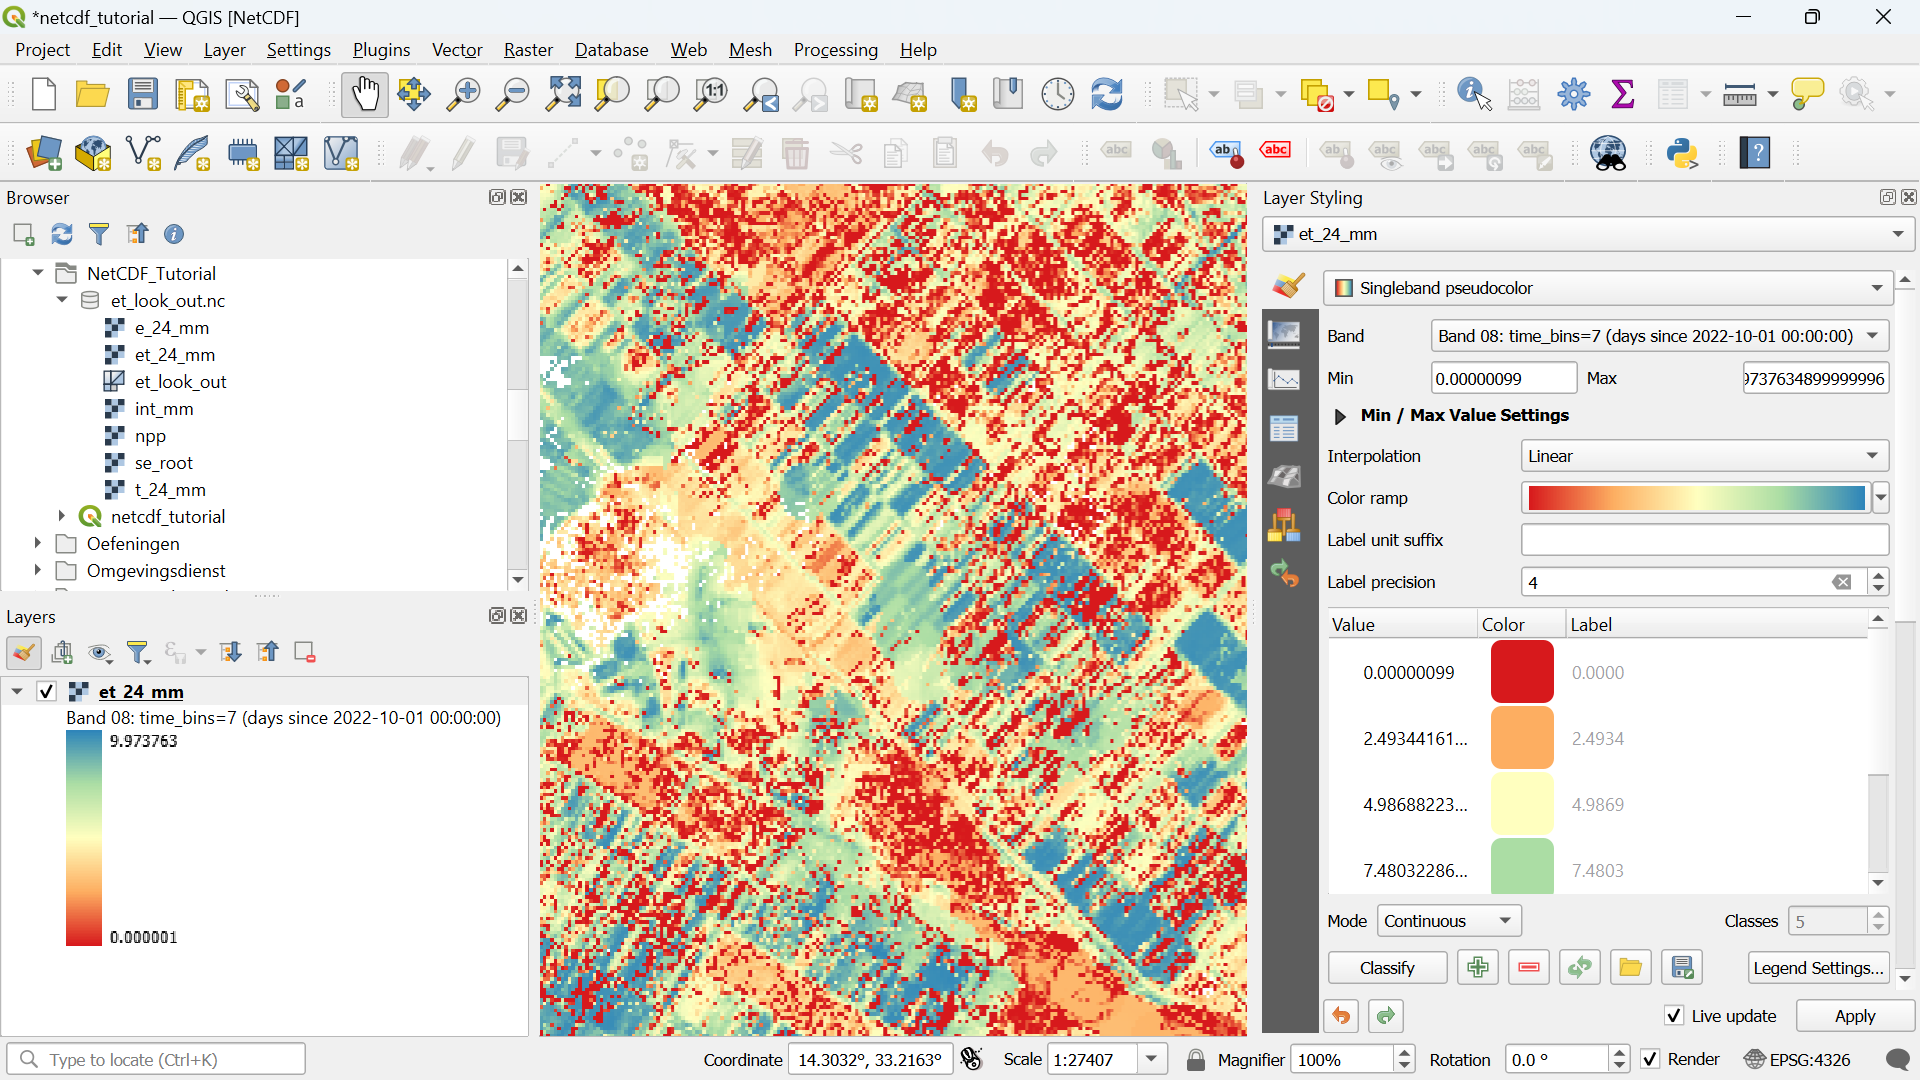
7. Finally, choose a Color ramp to visualise the evapotranspiration of the chosen date.
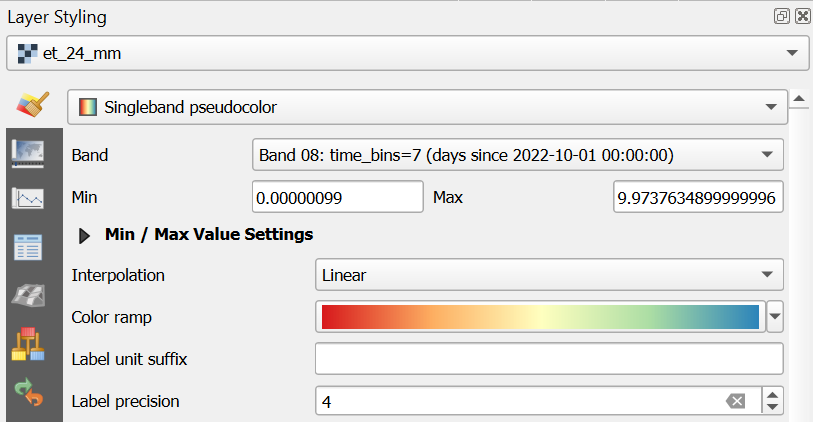
In this way, we can visualise ET for a specific day of the dekad.
In a similar way you can load and visualise the other raster layers in the NetCDF file.
3. Visualise raster time series
If you have installed QGIS 3.38 Grenoble or newer, you can try this chapter to visualise animations of raster time series. If you're using an older version, you can proceed with the next chapter.
We'll create an animation for the ET layer.
First we need to configure the multiband raster as a temporal layer.
1. In the Layers panel, select the et_24_mm layer.
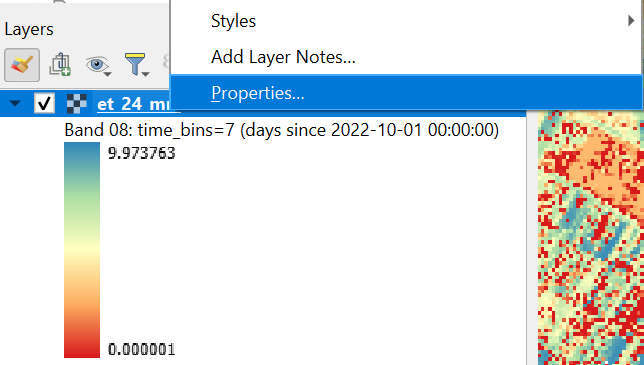
2. Click right on the layer and choose Properties... from the context menu. Alternatively, you can double-click the layer.
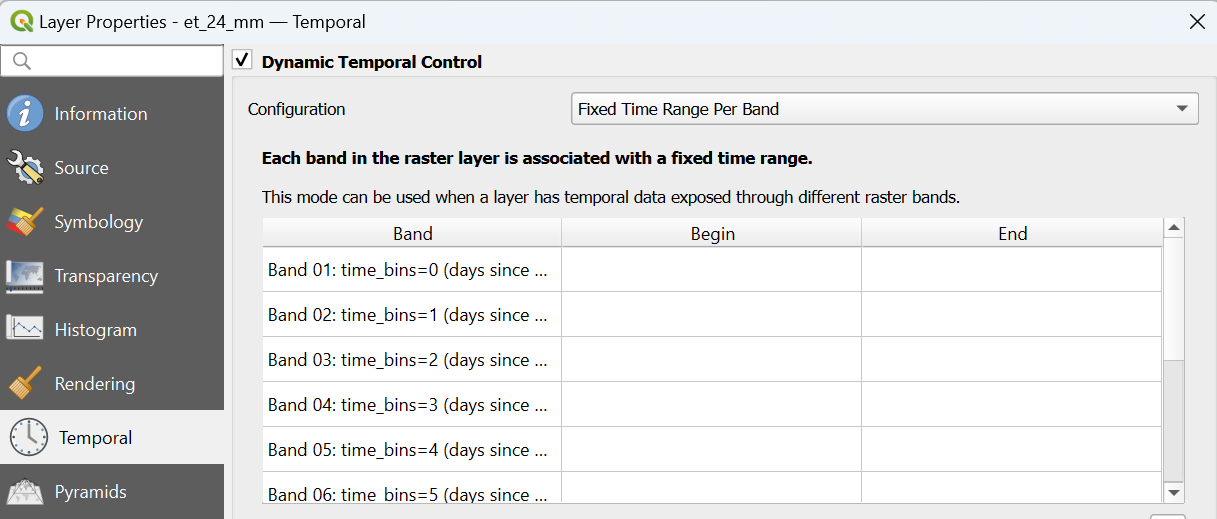
3. In the Layer Properties window, go to the Temporal tab.
4. Check the box for Dynamic Temporal Control.
5. Choose in the drop-down menu at Configuration Fixed Time Range Per Band.
The screen should now look like this:
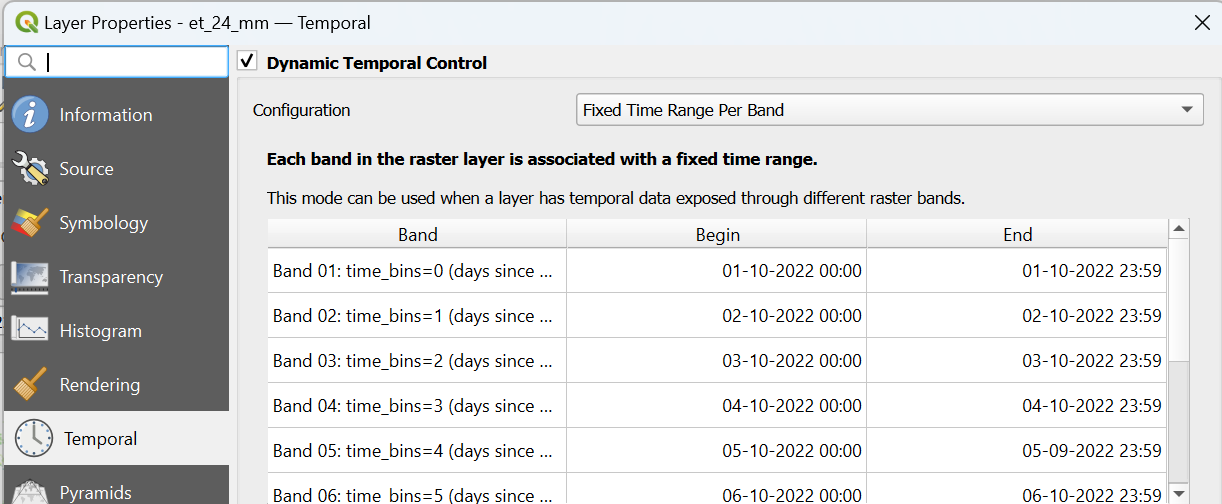
Now we need to indicate the beginning and end times of each raster layer. Each band is a day, starting from 1 October 2022 in our example and it covers 24 hours of evapotranspiration.
6. Click in the table and edit the begin and end times. You can use the drop-down arrow to pick the date from a calendar and then type the time.
7. After setting the first band, you can copy the date/time to the other bands and you only have to update the day. Note that the date format depends on your language settings.
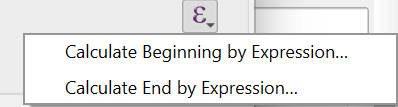
Pro tip: you can use expressions to fill in the table by using the expression editor.
8. Click OK to apply and close the window.
Now you'll notice a clock icon in the Layers panel, next to the layer name, indicating that it's a temporal layer that can be controlled with the Temporal Controller.
9. In the Toolbar, click ![]() to open the Temporal Controller panel.
to open the Temporal Controller panel.
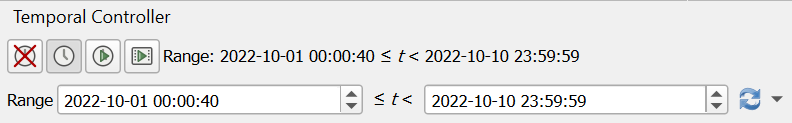
10. In the Temporal Controller panel, click ![]() to configure the range. Then click
to configure the range. Then click ![]() to set the range to the one defined by the data.
to set the range to the one defined by the data.
11. Now click on ![]() in the Temporal Controller panel.
in the Temporal Controller panel.
12. Set the time step to source timestamps.
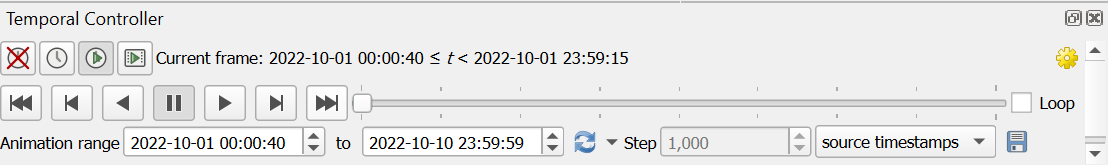
13. Click ![]() to animate the temporal raster.
to animate the temporal raster.
You can now also add text with the date/time a title and a legend. You can export the animation to an animated GIF. This is covered in this tutorial.
4. Export NetCDF layers to GeoTIFF
Often we don't want to work with all layers in a NetCDF, but with GeoTIFFs. In this chapter you'll learn how to export NetCDF rasters to GeoTIFF layers.
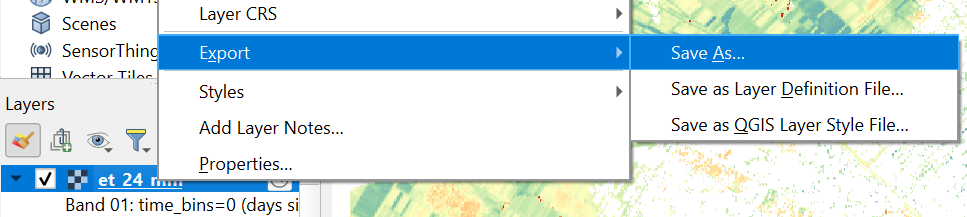
1. In the Layers panel, select the raster layer you want to export to GeoTIFF, e.g. et_24_mm.
2. Right-click on the layer and choose Export | Save As... from the context menu.
3. In the Save Raster Layer as... dialog, use ![]() to browse to the folder where you want to save the result and give it a file name, e.g. ET.tif. Optionally, you can reproject the result to a CRS of your choice.
to browse to the folder where you want to save the result and give it a file name, e.g. ET.tif. Optionally, you can reproject the result to a CRS of your choice.
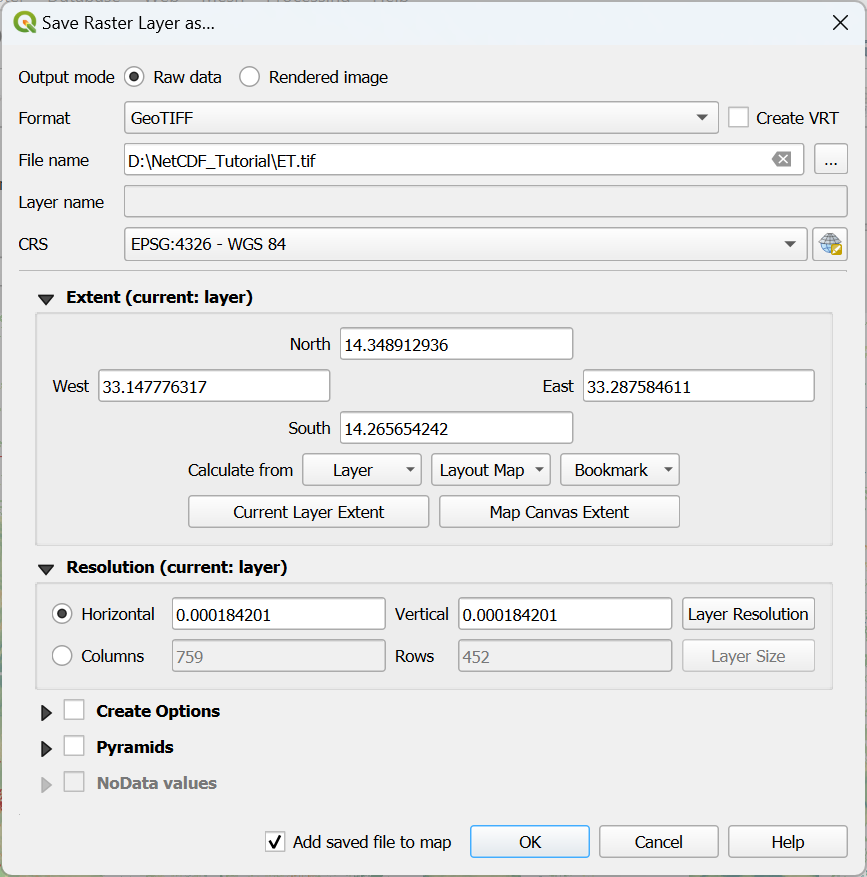
4. Click OK to run the export.
The result is automatically added to the map canvas. It is a GeoTIFF multiband raster. If you want to export the individual layers, you need another approach, which will follow now.
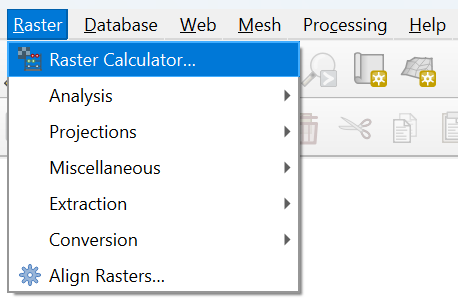
5. In the main menu choose Raster | Raster calculator.
6. Under Raster Bands double click on the band that you want to export, e.g. et_24_mm@1 (@1 means band 1).
The band will then be added to the Raster Calculator Expression at the bottom.
7. Use the browse ![]() button to define the output location and file name. It is useful to indicate the date in the file name, e.g. ET_011022.tif.
button to define the output location and file name. It is useful to indicate the date in the file name, e.g. ET_011022.tif.
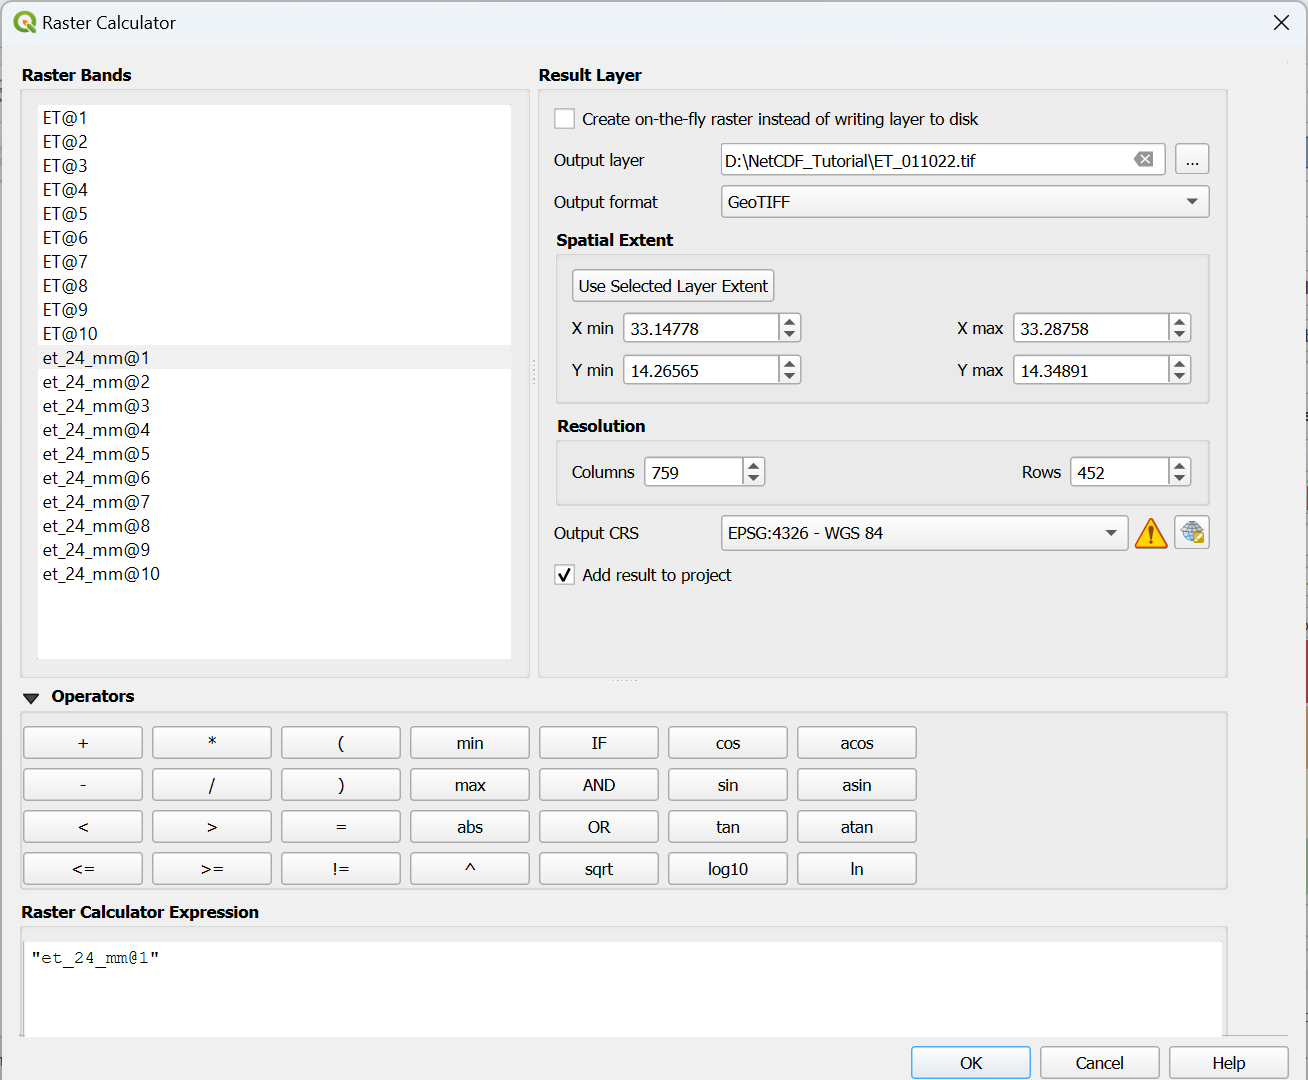
8. Click OK to export the band.
Repeat this for other bands if needed.
5. Load NetCDF as mesh layer
Another way of loading NetCDF layers in QGIS is using the mesh format. With mesh it is easier to extract time series, which we'll do in the next chapter.
Let's first load the NetCDF as mesh layer.
1. Go to the Browser panel.
2. Locate the et_look_out mesh layer and drag it to the map canvas.
3. Go to the Layer Styling panel.
There you see all the layers in the NetCDF file.
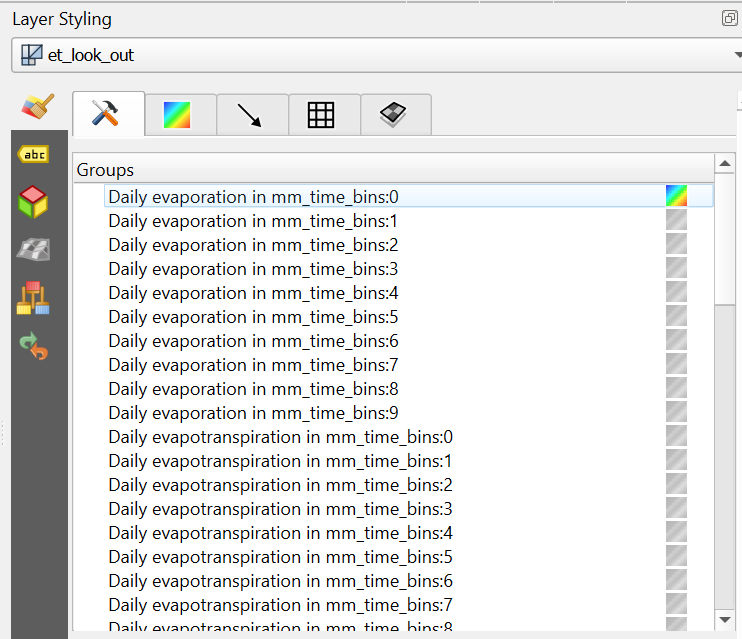
4. Click on the contour  icon to visualise a layer in the map canvas.
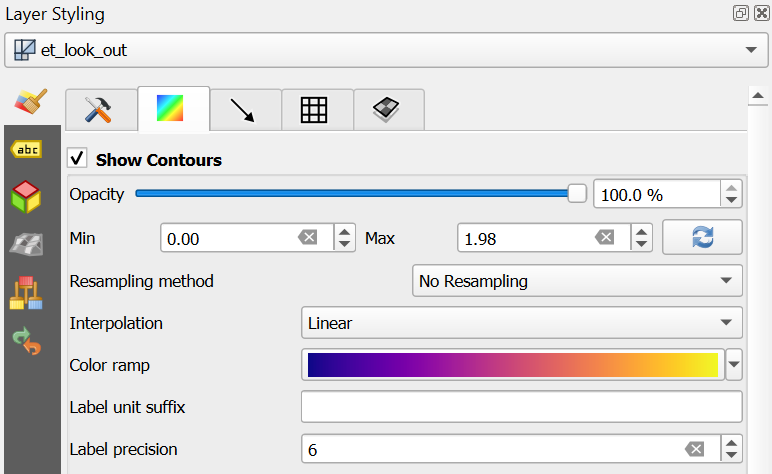
5. Go to the contour tab  .
.
There you can change the styling of the mesh layer.
In the next chapter we're going to extract timeseries values from the mesh.
6. Export time series values from points
With the mesh tools in the Processing Toolbox, we can export data. Let's first export timeseries values for specific locations.
Let's first create some points for which we want to export the timeseries values. We'll use a temporary scratch layer, but you can also use an existing vector layer or create a shapefile.
1. In the Toolbar, click ![]() to create a new temporary scratch layer.
to create a new temporary scratch layer.
2. In the dialog, add for Layer name Locations and choose Point as the Geometry type. Add an attribute ID as Integer so we can identify the exported points later.
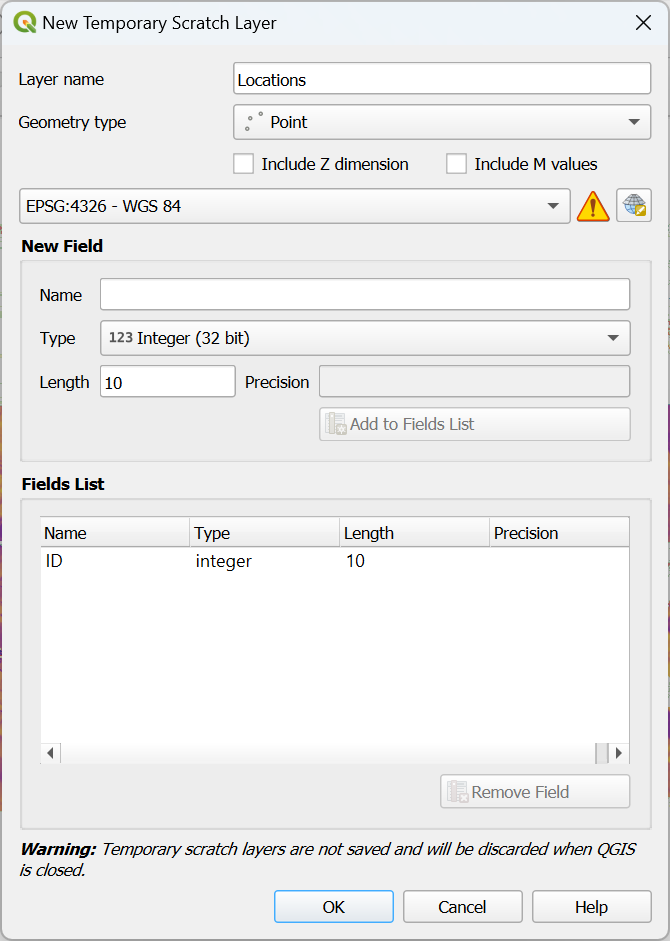
3. Click OK to create the layer.
4. In the digitizing toolbar, click ![]() to add our first point.
to add our first point.
5. Choose a location in a parcel.
6. Choose a second location in another parcel.
7. Click ![]() to save the edits and toggle off editing.
to save the edits and toggle off editing.
8. Click ![]() to open the Processing Toolbox panel.
to open the Processing Toolbox panel.
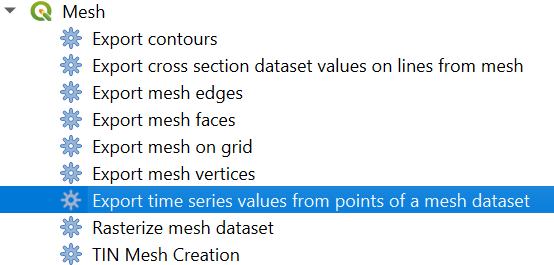
9. Under Mesh double click on Export timeseries values from points of a mesh dataset.
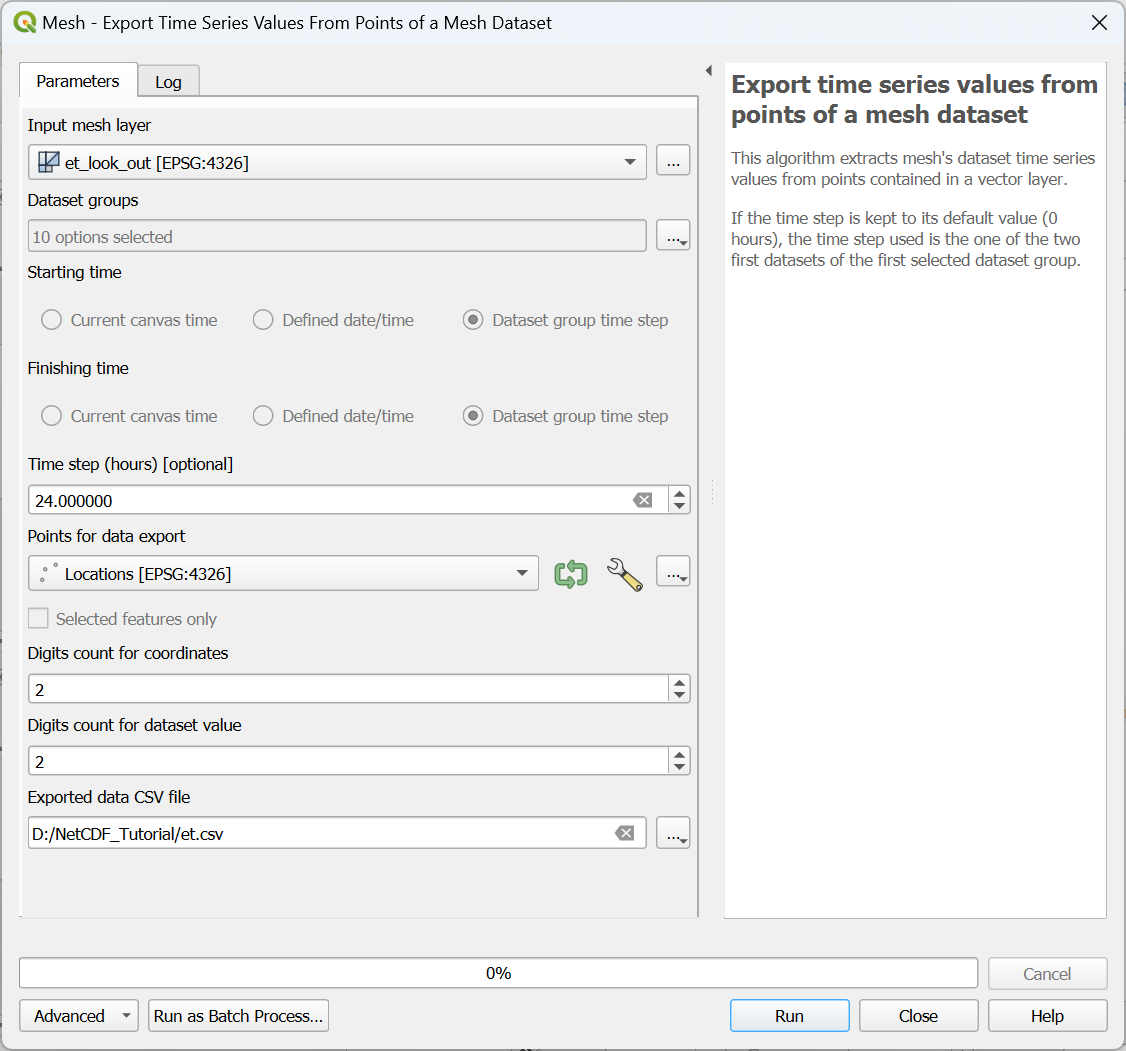
10. In the dialog make sure the et_look_out mesh layer is selected as Input mesh layer.
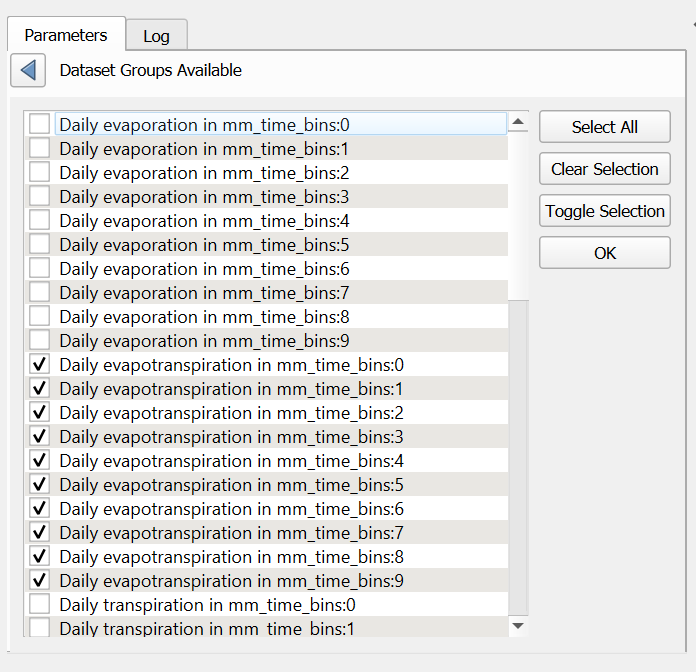
11. Select under Dataset Groups the days that you want to use, for example the 10 layers of ET.
Note that it is more common that meshes have each data layer in a dataset group with the time defined. So ideally, you would choose the daily evapotranspiration group only and it will have all the temporal layers in it. In this case each time step is a separate dataset group, therefore we need to select all. The time information is therefore lost.
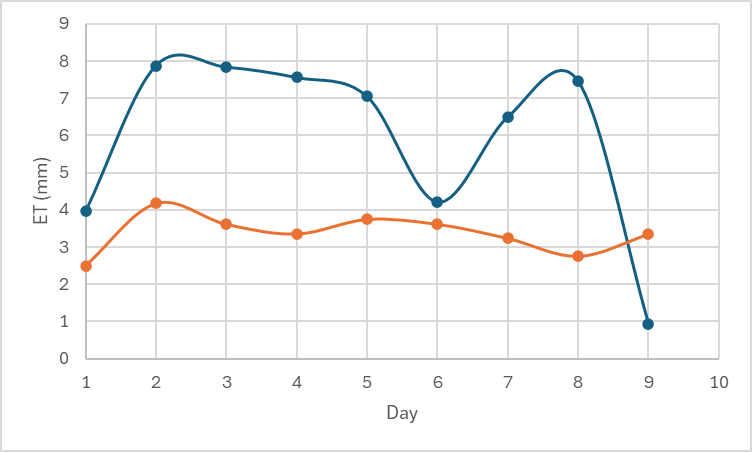
12. After selecting the dataset groups, you can set the time step to 24 hours and choose a CSV filename for the output.
13. Open the CSV file in a spreadsheet programme and manipulate it in such a way that you can create the graphs of the 2 points as shown below:
7. Conclusion
In this tutorial, you have learned to work with NetCDF files in QGIS.
You are now able to:
- Load NetCDF raster data in QGIS
- Style NetCDF raster data
- Animate temporal NetCDF rasters (only in QGIS 3.38 or newer)
- Export NetCDF raster data to GeoTIFF
- Load NetCDF as mesh
- Style NetCDF mesh
- Export time series values from points
If you would like to learn more about mesh data and animations, you can check this course at the GIS OpenCourseWare platform.