PyQGIS Use Case: Stage Volume Curve
| Site: | OpenCourseWare for GIS |
| Course: | Programming Basics for QGIS Users |
| Book: | PyQGIS Use Case: Stage Volume Curve |
| Printed by: | Guest user |
| Date: | Sunday, 12 July 2026, 3:52 AM |
1. Introduction
In this tutorial, you'll work on a practical example of an automation work flow in QGIS using PyQGIS. We'll work on an example script where we create a Stage Volume Curve using PyQGIS.
A Stage Volume Curve or Stage Storage Curve can be used to read which volume of a lake or a pit belongs to a certain water level. It's much easier to measure the water level than the volume, so once the curve is created the volume can be determined in an easy way.
In this tutorial we'll create a Stage Volume Curve for an open pit Lignite mine, but the method is the same for lakes.
After this tutorial you'll be able to
- calculate the volume below a specific elevation in a DTM
- use QGIS Processing Tools with PyQGIS in QGIS
Data for this tutorial can be downloaded from this GitHub repository (same as the previous tutorial).
The data included in this tutorial comes from the Shuttle Radar Topography Mission: SRTM 1-Arc Second. If you want to apply the tutorial to other areas you can download the data using the OpenTopography DEM Downloader Plugin. this video covers the procedure:
2. Calculate the volume below a specific elevation
Before we're going to use a QGIS Processing Tool with PyQGIS, we're going to use the tool first through the interface to get familiar with it. In this tutorial we'll use the Raster surface volume tool tool to calculate the volume below a specific elevation in a DTM.
- Start QGIS Desktop
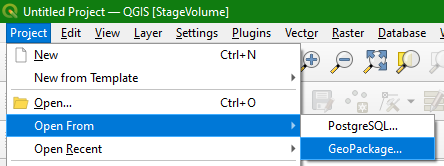
2. In the main menu go to Project | Open From | GeoPackage.
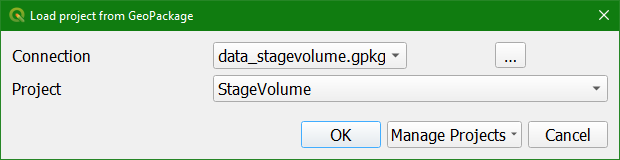
3. In the Load project from GeoPackage dialog browse to the provided data_stagevolume.gpkg GeoPackage and open the StageVolume project.
This project has an SRTM 1-Arc Second DEM reprojected to UTM Zone 32N and clipped to the area around the open pit mine. The DEM has been styled with a colour ramp and is blended with a rendered hillshade.
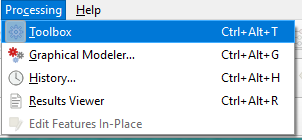
4. Go to Processing | Toolbox to open the Processing Toolbox panel.
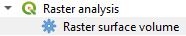
5. In the Processing Toolbox choose Raster analysis | Raster surface volume.
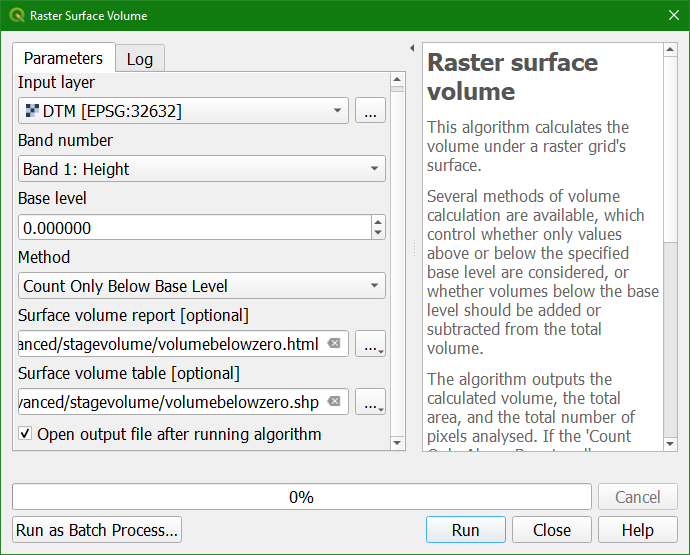
6. In the Raster Surface Volume dialog:
- Choose DTM as Input layer
- Keep Band number as it is
- Here we keep Base level 0 m, because we want to calculate the volume that is below 0 m.
- We do that by changing the Method to Count Only Below Base Level.
- The Surface volume report is an html file. Click on
 and select Save to File... .Give it the name volumebelowzero.html.
 - For Surface volume table Click on and select Save to File... . Make sure to set the file type to a shapefile. Save the file under the name volumebelowzero.shp.
Note that the algorithm actually creates a dbf file, but since this file type can't be selected we work around this by selecting a shapefile as the file format. This will generate an error message when the tool runs, but this can be ignored.
7. Click Run.
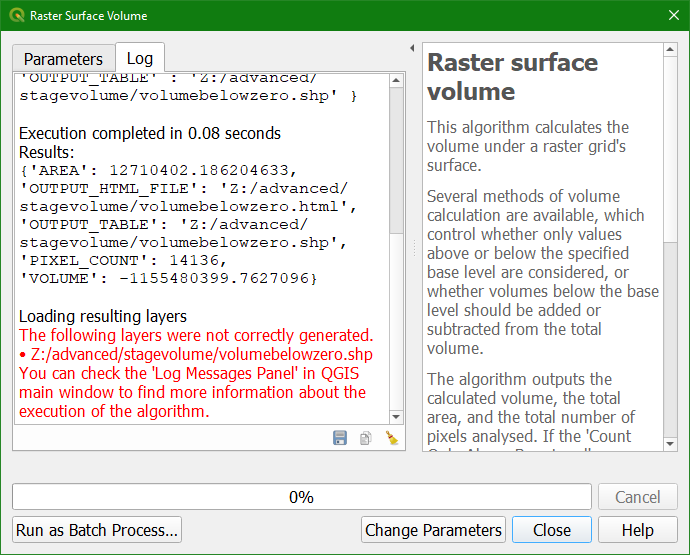
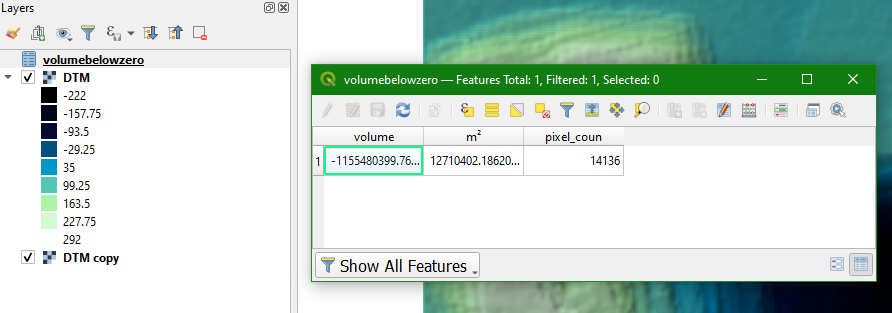
The Log tab gives the result: 'VOLUME' : -1155480399.7627096
It also shows an error in red, which, as mentioned under point 6, you can ignore.
8. Click Close to close the dialogue.
At the bottom of the Processing Toolbox you can find the Results Viewer.
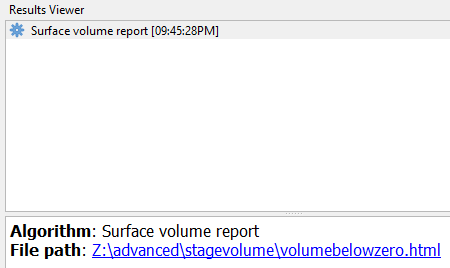
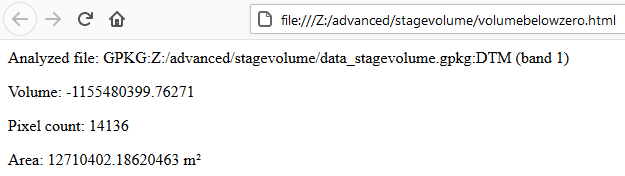
9. Double click on the Surface volume report or the html link (it links to the same). It will open in your web browser. Check the results.
10. Back in QGIS, use the Browser panel to find the volumebelowzero.dbf file on your computer and drag it from the Browser panel to the map canvas.
11. Click right on the volumebelowzero table in the Layers panel and choose Open Attribute Table to check the result.
12. Repeat from step 5 for some other elevations.
In the next section we're going to calculate the volumes for many elevations and store the values in one table.
Watch here the result until this step:
3. Create a Stage Volume Table with PyQGIS in QGIS
In the previous section we've calculated the volume corresponding to a specific elevation one by one.
In this section we're going to iteratively calculate the volume for a range of elevations and store the results in one table. For that purpose we need to write a PyQGIS script around the Raster Surface Volume tool.
All processing tools that you've run are stored in the history of the Processing Toolbox. Let's have a look and see how we can use that for our script.
1. In the Processing Toolbox click  to open the history.
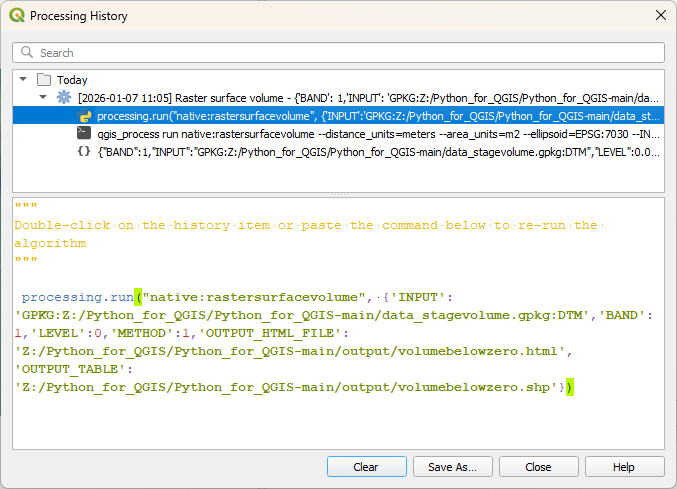
There you find what we did in the previous section. Try to read what's written after processing.run.
It contains the name of the tool: native: rastersurfacevolume. It contains a dictionary with all the inputs from the dialogue. That means that we can copy this and replace parts of the dictionary in a PyQGIS script with a variable. Here we should iterate for different LEVEL values from the minimum to the maximum elevation in the DTM.
2. Click Close to close the History dialogue.
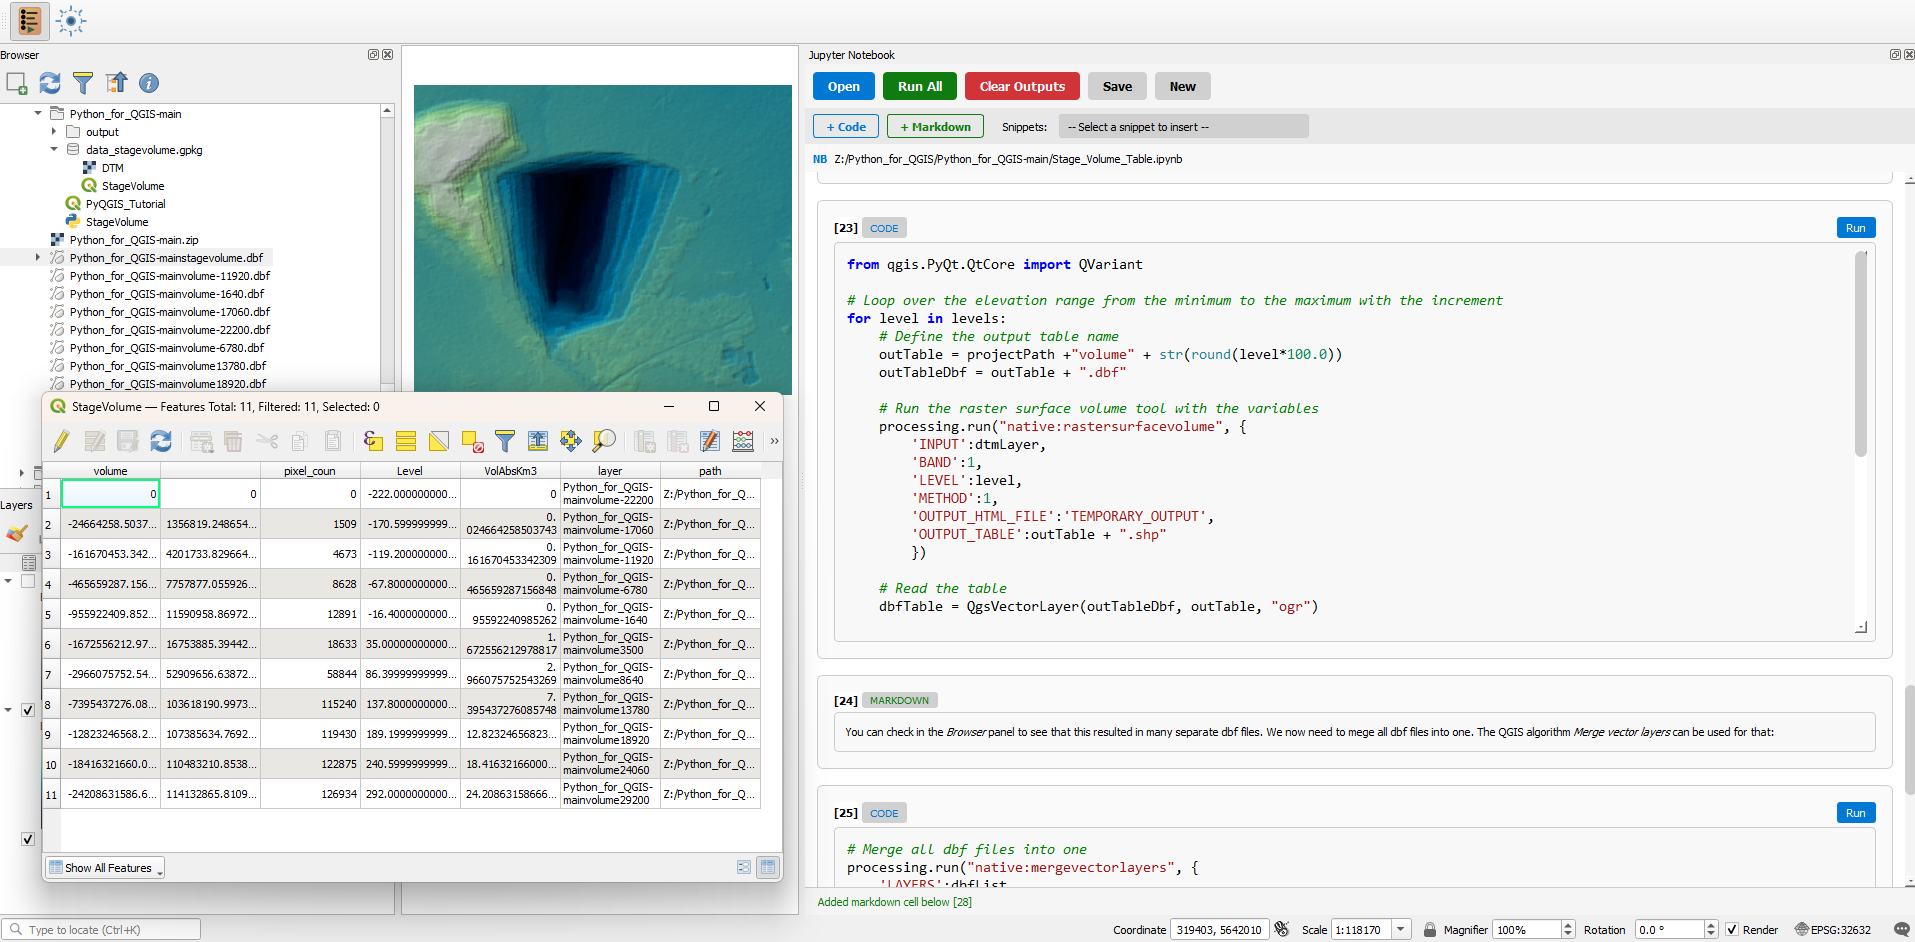
Let's use Python and PyQGIS to use this algorithm to create a stage volume table. The instructions are in the Jupyter Notebook Stage_Volume_Table.ipynb that you can find in the downloaded files from the GitHub repository.
3. Click  to open the Jupyter Notebook panel and load the Stage_Volume_Table.ipynb notebook in the same way as you have learned in the previous tutorial.
4. Follow the steps in the Jupyter Notebook and return to this tutorial after finishing the steps.
Now we're going to use the same code in the QGIS Python Console.
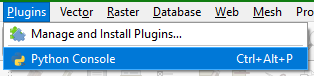
5. In the main menu choose Plugins | Python Console to open the Python Console.
6. In the Python Console click  to open the editor.
7. Go to this GitHub page: https://github.com/jvdkwast/PyQGIS_Hydro/blob/master/scripts/StageVolume.py
8. Copy the Python code to the editor and save the script as StageVolume.py.
Before running the script you might want to remove the files generated when you followed the Jupyter Notebook. You can also remove the additional DTM layer and the table, so you're back at the situation at the start of this tutorial. You can also simply revert to the project if you didn't save it since the start.
9. Click  to run the script.
This is the result printed in the Python Console:
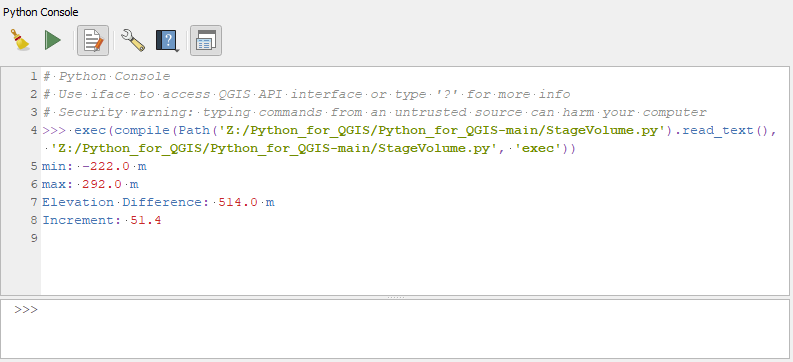
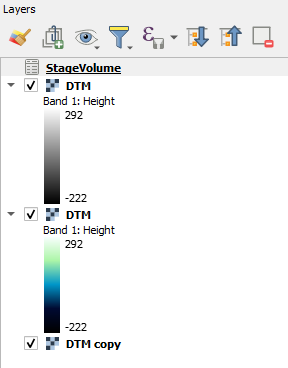
The script has also added a DTM layer and the StageVolume table to the Layers panel.
11. Click right on StageVolume and choose Open Attribute Table and inspect it.
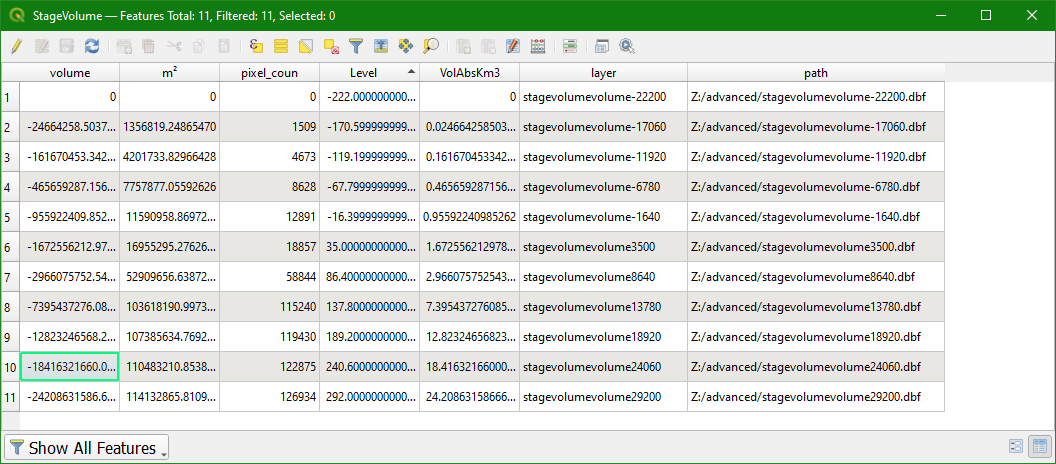
We have created the Stage Volume Table with the Level field in meters and the VolAbsKm3 field containing the volumes in km3.
In the next section we'll create the Stage Volume Curve using the Data Plotly plugin.
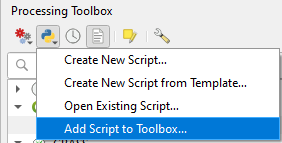
Note that you can also add the StageVolumeTool from GitHub to the Processing Toolbox. The tool then has a dialogue. You can download the tool from here: https://github.com/jvdkwast/PyQGIS_Hydro/blob/master/scripts/StageVolumeTool.py.
The format of this so-called QGIS Processing Script is different from the code that we just wrote. You can find more of these scripts in the QGIS Resources Hub. These scripts and other resources can be easily installed through the QGIS Hub plugin. The video below shows how that works.
4. Create a Stage Volume Curve with the Data Plotly plugin
Now we have created the Stage Volume Table we can easily create the Stage Volume Curve with the Data Plotly plugin.
1. Install the Data Plotly plugin from the plugins repository.
2. Click  to open the Data Plotly panel.
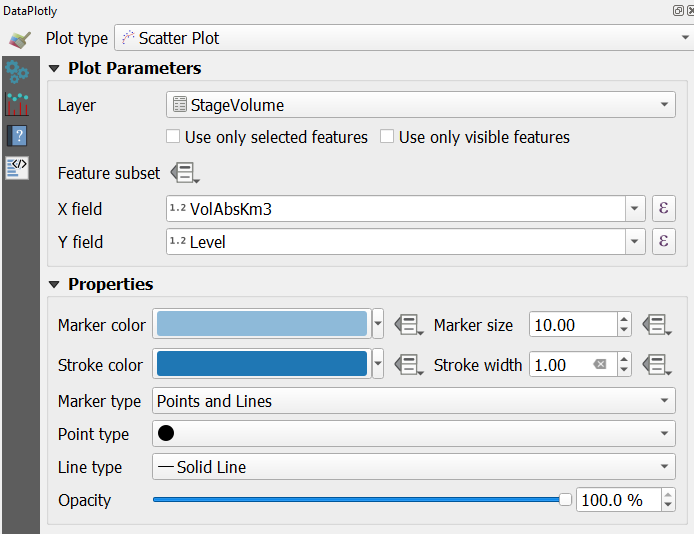
3. Make sure to choose the Scatter Plot as Plot type and StageVolume as the Layer. The X field is VolAbsKm3 and the Y field is Level.
4. Click 
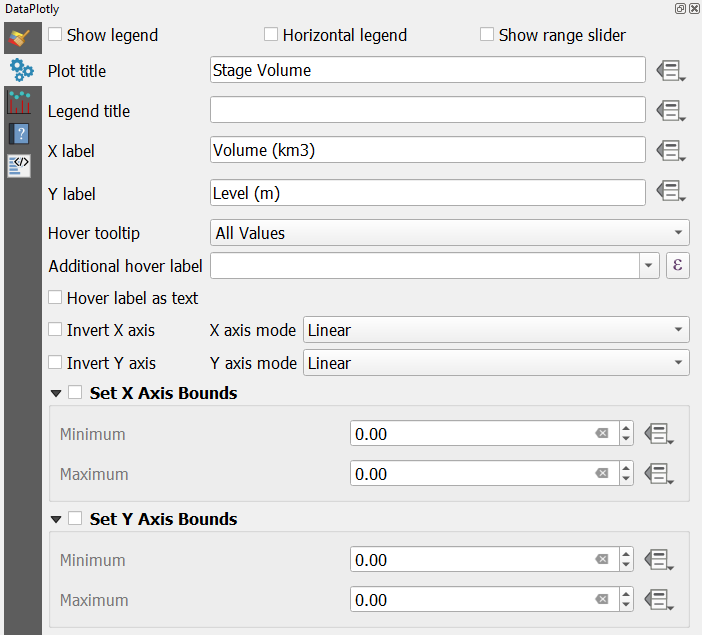
5. Uncheck Show legend. Set the Plot title to Stage Volume, keep the Legend title blank. Change the X label to Volume (km3) and Y label to Level (m).
6. Click 
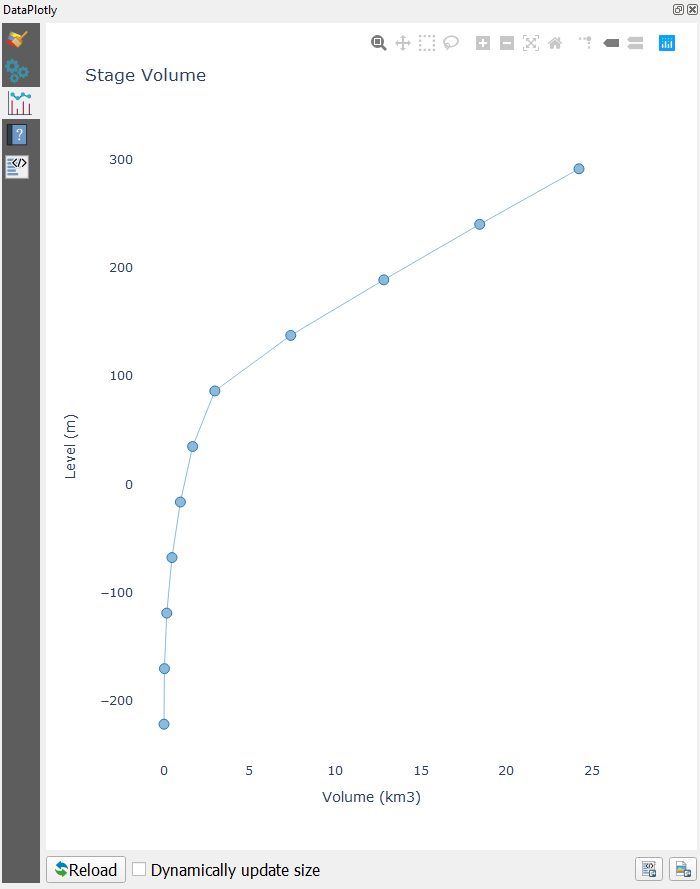
You can save the result as a picture using the  button.
From the Stage Volume Curve we can see a sharp change at 86.4 m. That's approximately the elevation of the boundary of the pit.
5. Conclusions
In this tutorial you've learned to:
- calculate the volume below a specific elevation in a DTM
- use QGIS Processing Tools with PyQGIS in QGIS