Create a Graphical Model and Processing Script for the HAND algorithm
| Site: | OpenCourseWare for GIS |
| Course: | Programming Basics for QGIS Users |
| Book: | Create a Graphical Model and Processing Script for the HAND algorithm |
| Printed by: | Guest user |
| Date: | Sunday, 12 July 2026, 3:53 AM |
1. Introduction
In this tutorial we're going to make a graphical model in QGIS to calculate the Height Above Nearest Drainage (HAND) with the PCRaster Tools. After creating the model, you'll learn how to export it to a QGIS Processing Script, which you can modify and customise for your purposes with the Python skills acquired in this course.
Data for this tutorial can be downloaded from the main course page.
Reference : Renno, C. D., Nobre, A. D., Cuartas, L. A., Soares, J. V., Hodnett, M. G., Tomasella, J., & Waterloo, M. J. (2008). HAND, a new terrain descriptor using SRTM-DEM: Mapping terra-firme rainforest environments in Amazonia. Remote Sensing of Environment, 112(9), 3469-3481.
2. Setting the Model Properties
In this section we'll setup a graphical model in the QGIS Model Designer.
1. In the Processing Toolbox panel, click Models  icon and choose Create New Model... from the drop-down menu.
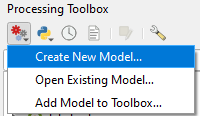
2. Maximize the new window of the Model Designer.
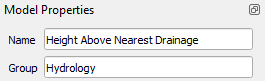
3. Let's first enter the Name and Group in the Model Properties section. Give it the Name Height Above Nearest Drainage. For Group write Hydrology. The model can then be found in the Processing Toolbox under Models | Hydrology | Height Above Nearest Drainage.
Let's save the model. You can save models in your QGIS profile or in your project. If you save the model in your profile, it will be available for all projects that you work on from that profile. In this case you use the Save model as  icon to save a .model3 file under \profilename\processing\models . If you only want to use the model in this project use the Save model in project
  icon.
icon.
4. Choose one of the options to save your model.
3. Define the Input Parameters
In the upper left panel of the Model Designer you can see the Inputs.
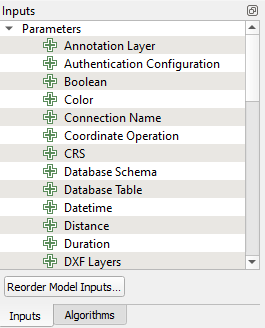
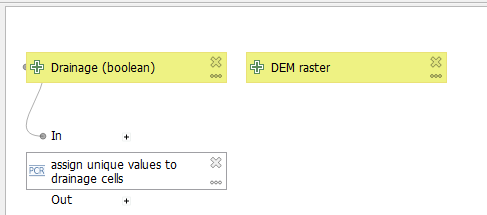
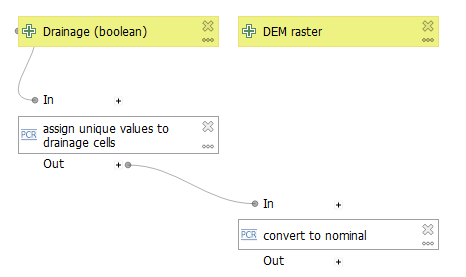
For our model we need a drainage raster and a DEM.
1. In the Inputs panel scroll down and double-click on Raster Layer.
2. In the Raster Layer Parameter Definition popup type Drainage (boolean) at Description and keep Mandatory checked.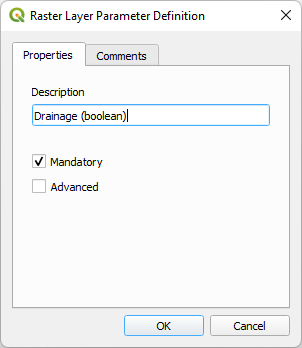
Now you have defined that in the graphical user interface the user sees that a boolean drainage raster needs to be selected as input.
3. Click OK to add the input to the Model Designer.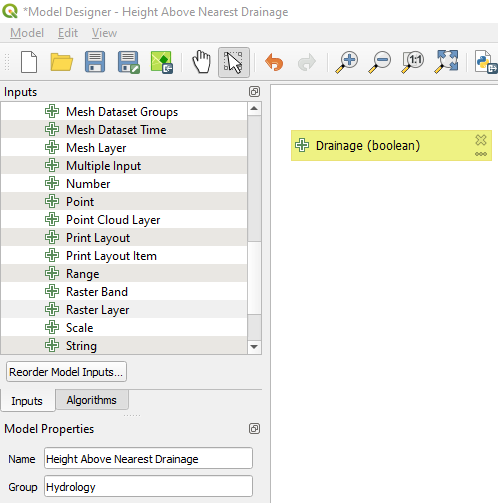
4. Repeat this to add the DEM input raster to the Model Designer.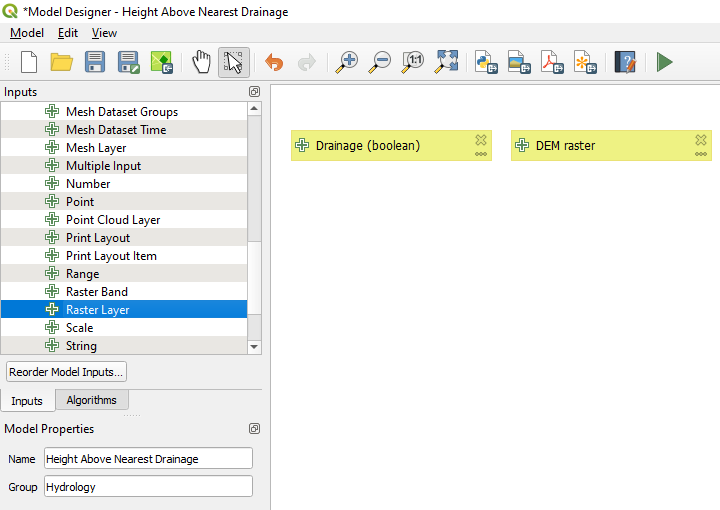
Next, we're going to use these inputs for the calculations.
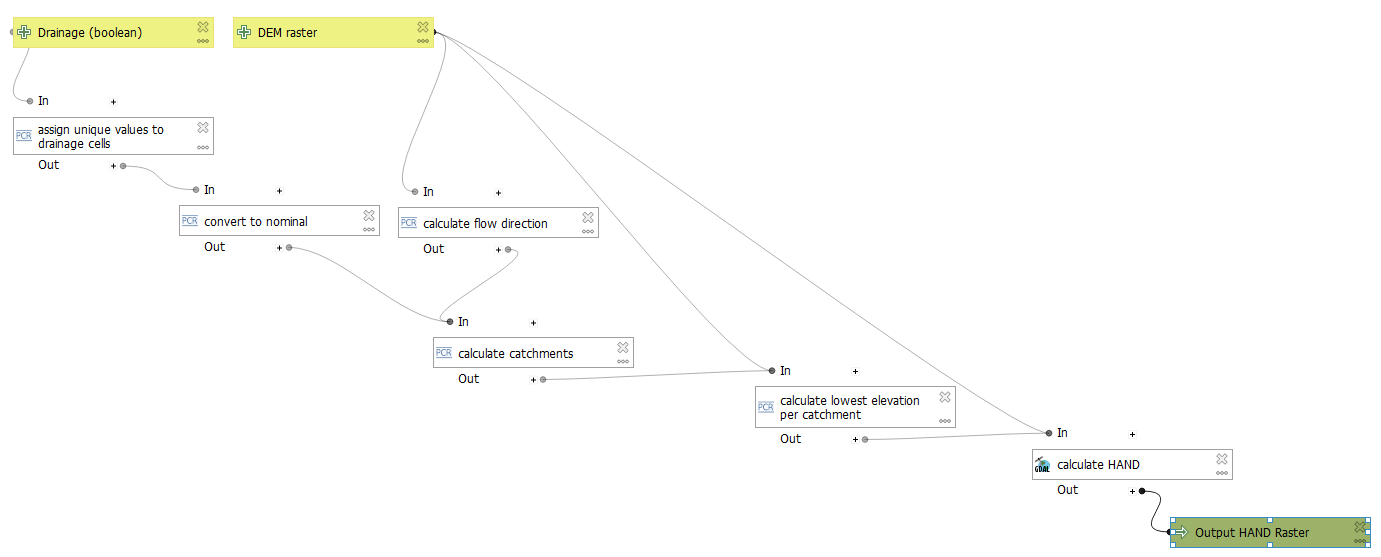
4. Add Processing Algorithms to the Graphical Model
Now we can add algorithms for our calculations.
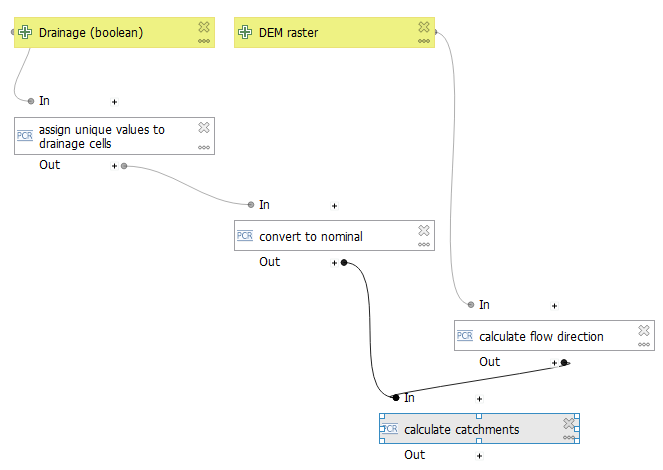
First we need to assign a unique value to each cell of the drainage raster in order to derive the catchments of each cell of the drainage.
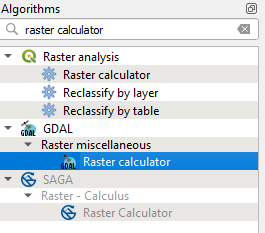
1. In the upper left panel of the Model Designer click on the Algorithms tab.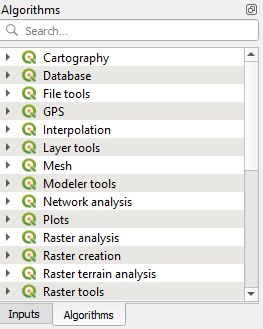
Here you'll recognise most of the tools that are available in the Processing Toolbox. Also the tools from the Processing Provider plugins are included, which means that you can create models which mix algorithms from different processing providers.
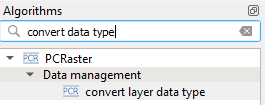
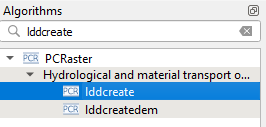
2. Use the search box to find the PCRaster uniqueid algorithm.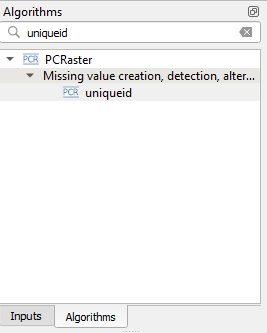
3. Double-click on the uniqueid algorithm.
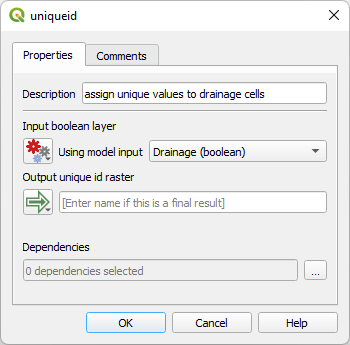
4. In the uniqueid dialog:
- type at Description: assign unique values to drainage cells.
- change Using model input to Drainage (boolean)
- Keep the Output unique id raster field empty. This field is only used if we want the (intermediate) output to be written to a file and that the user can choose the output file in the dialog. In this case we don't need that.
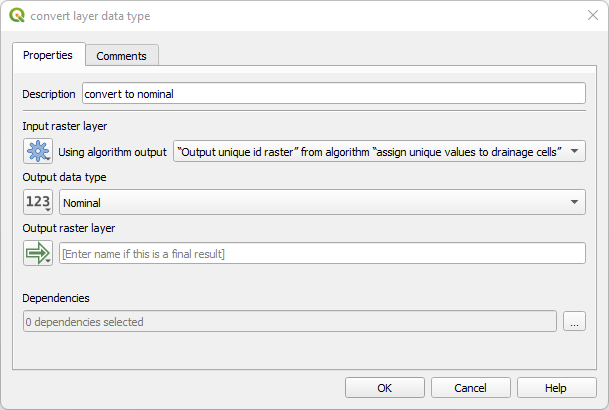
- Change the Description to Convert to nominal
- Use the drop-down menu under Input raster layer to choose Algorithm Output.
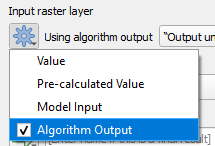
Note that we only have one output, so that's automatically selected. If you have multiple algorithm outputs you can choose it at Using algorithm output. - Change the Output data type to Nominal.
- We're not saving the intermediate result, so we leave the Output raster layer field empty.
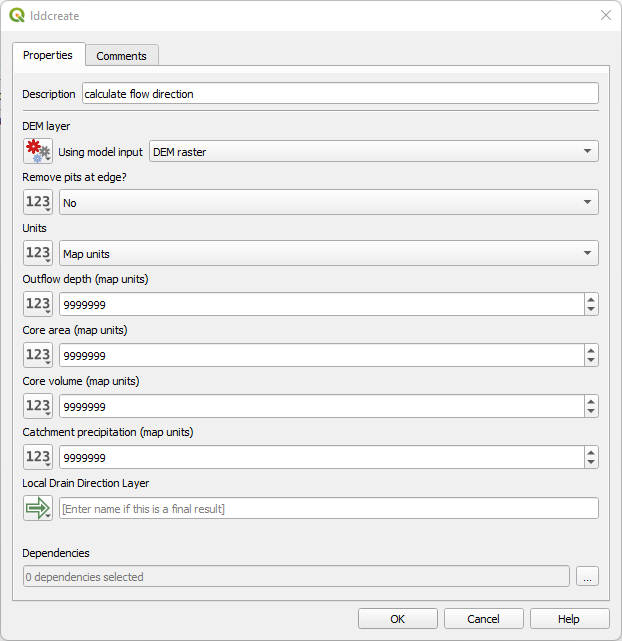
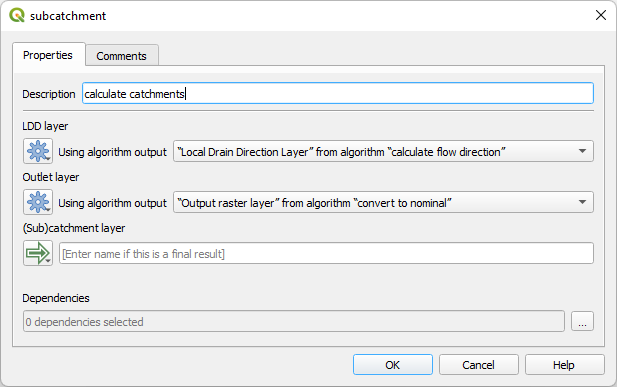
- At description type: calculate flow direction
- Keep the rest as default

- change the LDD layer to the output of calculate flow direction.
- change the Outlet layer to output of convert to nominal.
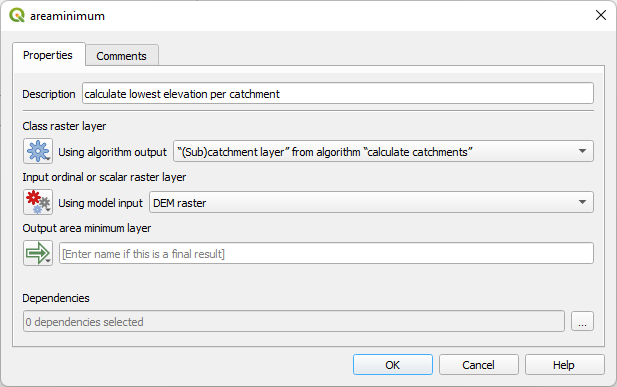
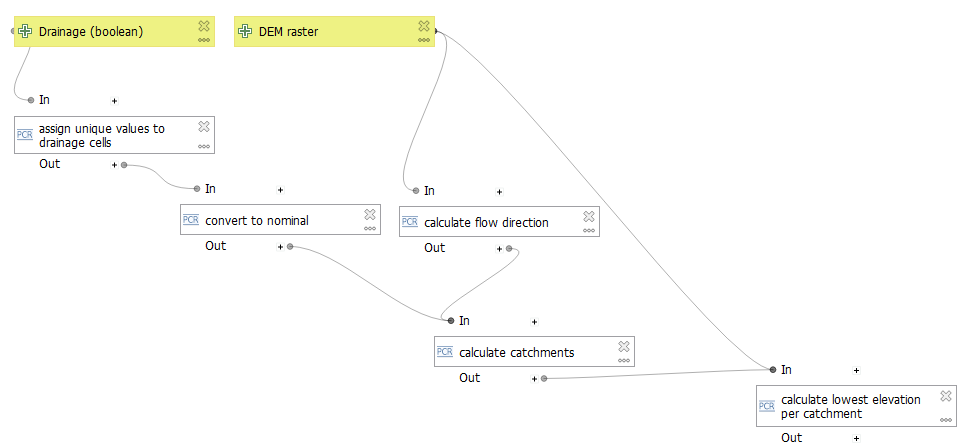
- For Description type: calculate lowest elevation per catchment.
- For Class raster layer choose the output of calculate catchments.
- For Input ordinal or scalar raster layer choose the DEM layer.
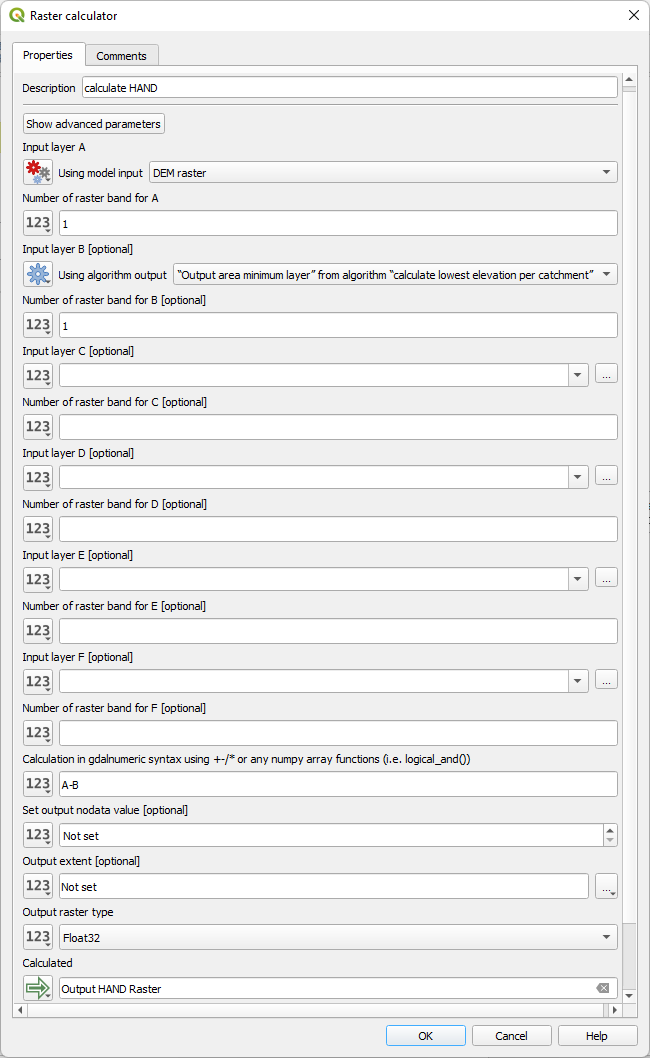
- Change the Description to: calculate HAND
- Input layer A should be defined as the DEM with raster band 1 (we only have single-band rasters here).
- Input layer B should be defined as the output of calculate the lowest elevation per catchment with band 1.
- At Calculation in gdalnumeric syntax type:
A-B
Where A and B refer to the layers defined above. - Output raster type should be set to Float32, because it's continuous data
- At Calculated type Output HAND raster, because now we'll write the final result to disk.
5. Add a Help Text
It's good practice to add a help text for the end user of your model
1. Click Edit model help  icon in the toolbar of the Model Designer.
2. Under Select element to edit the Element description of each element.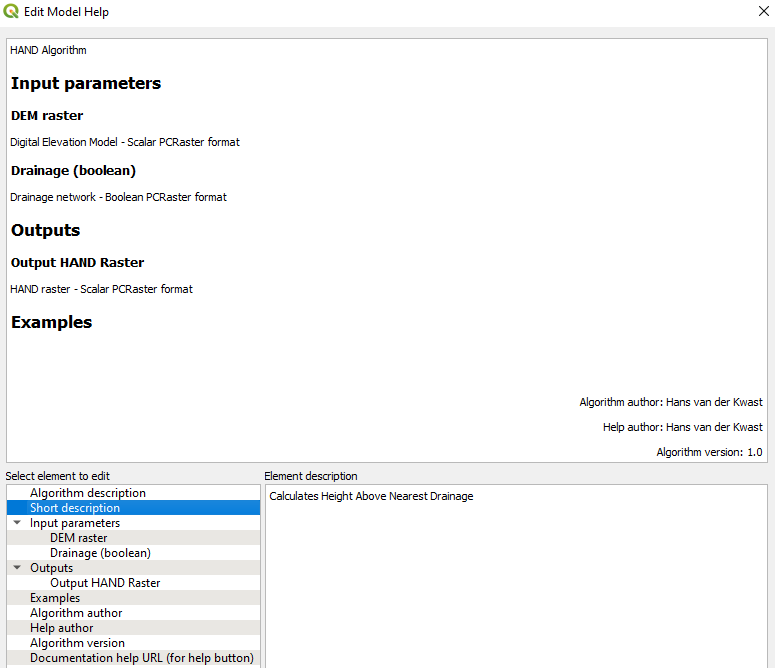
3. Click OK.
Now we're ready to test the model.
6. Run the Model
You can run the model from the model designer by clicking  or you can run the model from the Processing Toolbox. where it now appears under Models | Hydrology | Height Above Nearest Drainage.
1. Run the model with data from the previous tutorial.
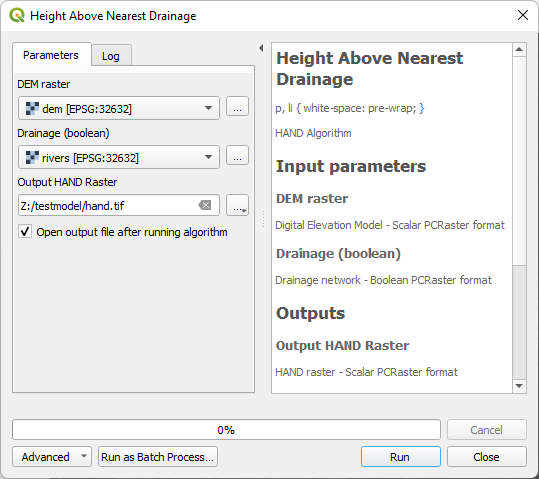
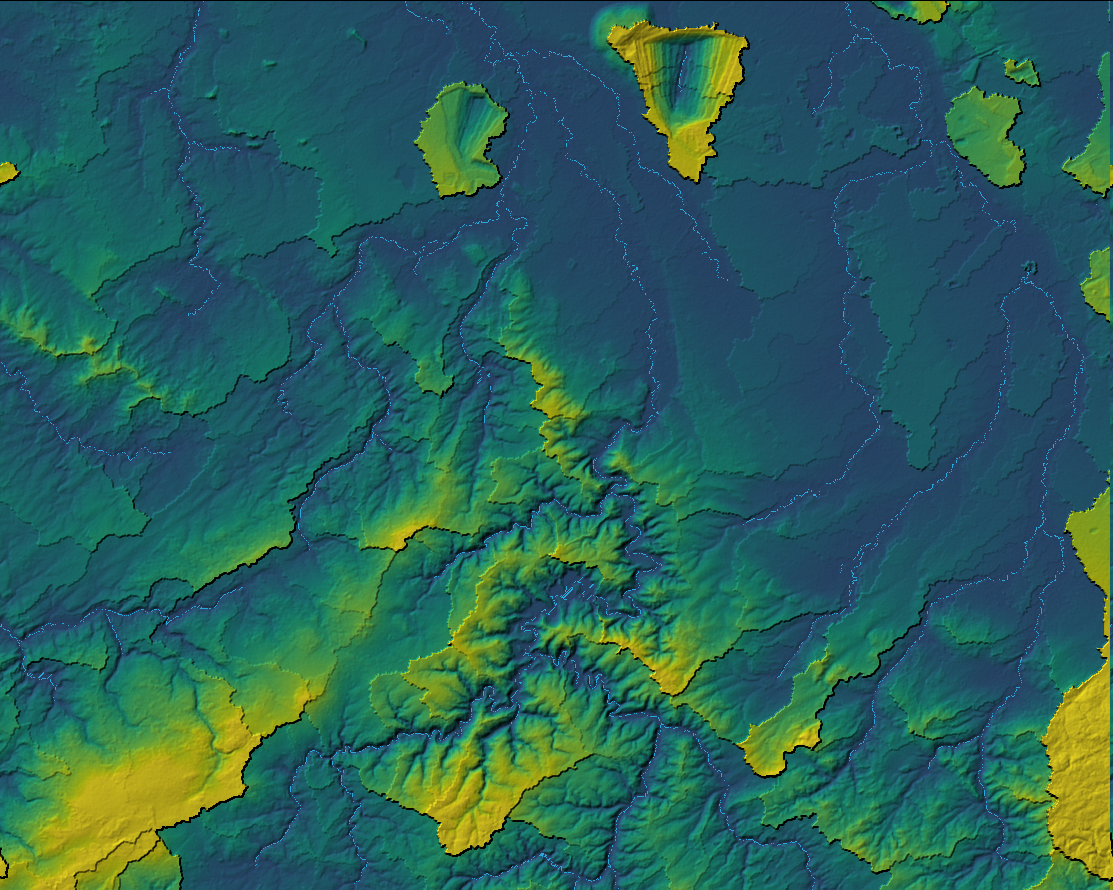
2. Check and style the result.
In the next chapter, we'll convert the graphical model to a QGIS Processing Script.
Note that Graphical Models can be shared through the QGIS Resources Hub. Watch this video for more information:
This model can be downloaded from the QGIS Resources Hub or installed through the QGIS Hub plugin.
7. Convert Graphical Model to PyQGIS
After testing the model, you can export the model to a PyQGIS script that you can further modify.
1. In the Model Designer, click  in the toolbar.
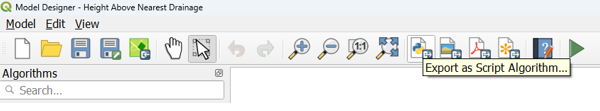
It will show the script in the Processing Script Editor.
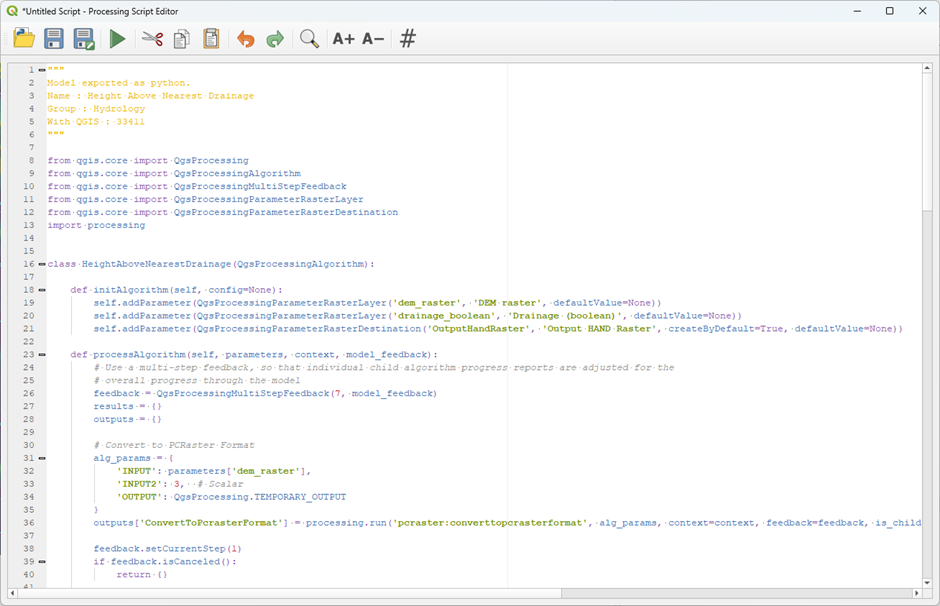
2. Read through the script and try to understand how the different tools were converted.
At the top of the script all necessary PyQGIS classes and packages are imported:

The a class with the name HeightAboveNearestDrainage is defined, with the following methods:
initAlgorithmdefines the input parameters that are neededprocessAlgorithmcontains all Python dictionaries with the parameters of each tool that has to be run. It also provides feedback to the user with the progress of the model.namedefines the name of the tool.displayNameis the name shown to the usergroupis the group to which the tool belongsgroupIDis an ID for the groupcreateInstanceinitiates the instance of the tool.
3. Click  to save the script. The scripts are by default saved in your current QGIS profile under \processing\scripts. Name the script hand.py.
Now you’ll find the script in the Processing Toolbox under Scripts | Hydrology | Height Above Nearest Drainage.

4. Remove the outputs from the model run and run the script to check if it works.
8. Conclusion
In this tutorial you have learned to create a graphical model to automate work flows in QGIS. Furthermore, you have learned to export the model to a QGIS Processing Script. Building on the knowledge from this course you can further modify the QGIS Processing Script to customise it for your tasks.
The QGIS Resources Hub has an optimised version of the HAND algorithm where many of the PCRaster Tools algorithms were replaced with PCRaster Python functions.