Tutorial: Field surveys using Mergin Maps
| Sitio: | OpenCourseWare for GIS |
| Curso: | Field surveys with Mergin Maps |
| Libro: | Tutorial: Field surveys using Mergin Maps |
| Imprimido por: | Guest user |
| Día: | sábado, 20 de junio de 2026, 02:54 |
1. Introduction
Input is a simple survey app allowing users to capture data in field.
Forms and data preparation can be done in QGIS software and synchronised with the Input app using the Mergin plugin and repository.
Input is not aimed to be a full GIS/mapping application. It is designed with simplicity, ease of use and seamless data synchronisation in mind.
A typical workflow for using Input consists of the following steps:
-
Preparing project: user loads background and survey layers, set up the forms, apply styling to the layers, set up map themes and define the layers to be used for survey purpose.
-
Data/project transfer: once the project set up, users need to transfer data to the device. This can be achieved through Mergin.
-
Working with Input: map navigation, data editing, including filling the forms, viewing existing data and uploading the changes back to Mergin.
2. Project preparation
We will start with preparing the project in QGIS.
In the project we have to distinguish:
- Background layers that provide context in the field
We can use both offline and online layers and they can be raster or vector.
Survey layers
Our project will have the following background layers:
- Sentinel 2 true color (RGB = bands 2, 3, 4)
- Sentinel 2 false colour (RGB = bands 8, 4, 3)
- OpenStreetMap online
- OpenStreetMap offline
- Vector layer with boundary of the study area
2.1. Adding a raster background layer
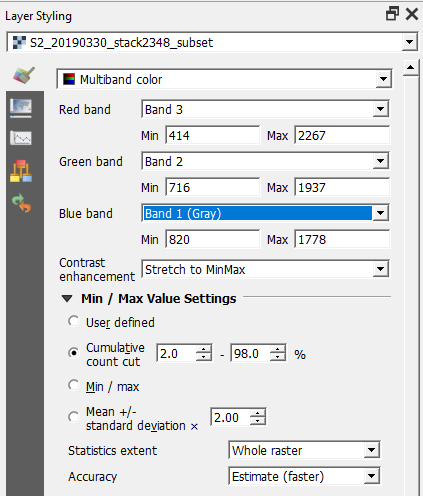
In this section we'll add a Sentinel 2 True Colour image and repeat the steps for a Sentinel 2 False Colour image.
The provided Sentinel 2 subset contains:
- Band 2 (Blue)
- Band 3 (Green)
- Band 4 (Red)
- Band 8 (Near Infrared)
Style the layer
Create tiles
2.2. Adding an online background layer
If you have internet connectivity in the field, you can use a WM(T)S or online XYZ tiles as your background map. In this section we'll add an online layer from OpenStreetMap to our survey project. We'll also make the online layer offline available just in case we don't have internet connectivity in the field.
We'll continue with the project from the previous section.
1. From the Browser panel, expand the XYZ tiles and double-click on OpenStreetMap
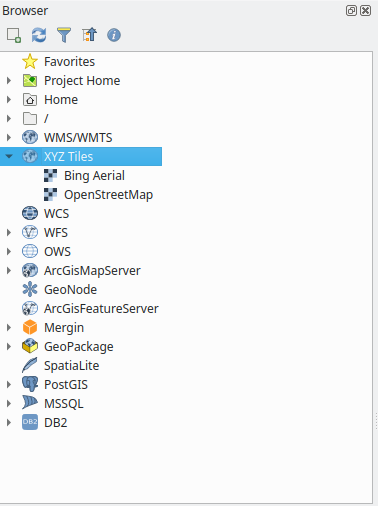
The OpenStreetMap layer now shows up in your Layers panel and is shown in the Map Canvas.
QGIS offers other ways to add online maps: if you open the Data Source Manager with this button ![]() you can choose to add WM(T)S layers. A useful plugin for using online maps is the QuickMapServices plugin. In this tutorial we only use the OpenStreetMap layer.
you can choose to add WM(T)S layers. A useful plugin for using online maps is the QuickMapServices plugin. In this tutorial we only use the OpenStreetMap layer.
Make online layers offline available
In the case that we don't have internet connectivity in the field but still want to use the online map, we need to export it to a .mbtiles file like we did in the previous section.
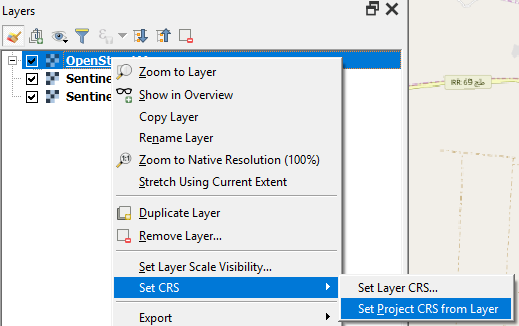
2. First change the on-the-fly reprojection to EPSG:3857. You can do this by clicking right on one of the layers and selecting Set CRS | Set Project CRS from layer. This is necessary, because the XYZ Tiles are using Web Mercator CRS (EPSG:3857).
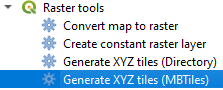
3. Go to Processing Toolbox | Raster tools | Generate XYZ tiles (MBTiles).
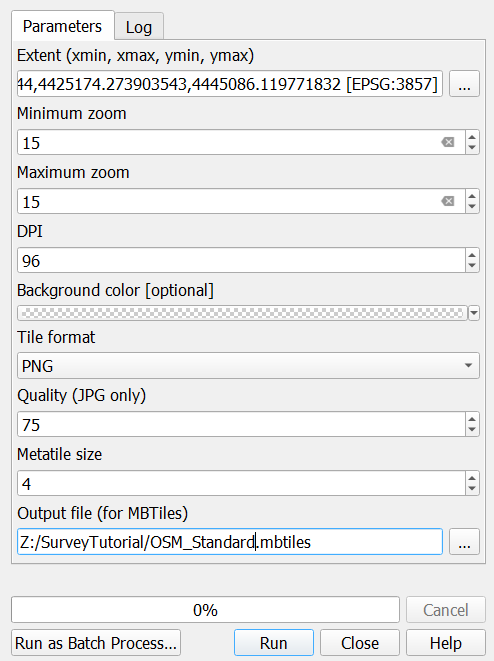
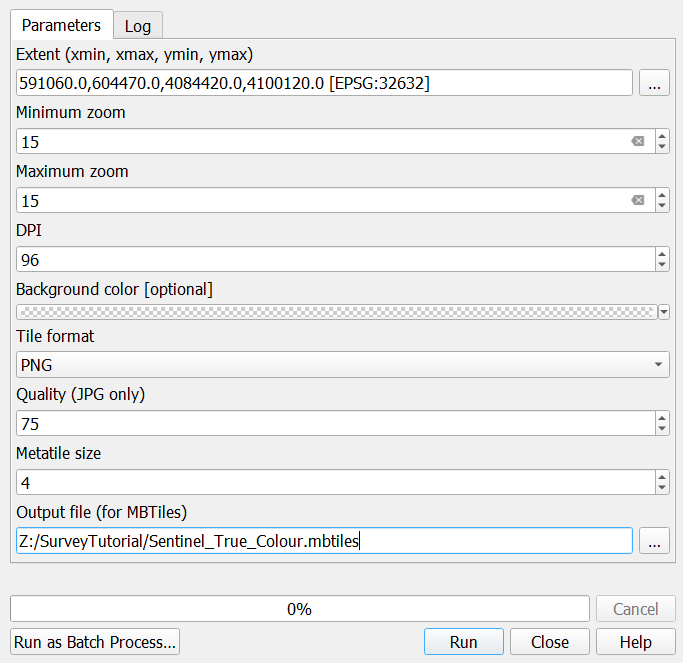
4. Choose for the Layer extent one of the Sentinel layers from the previous section. Then the tiles will only be generated for that area.
5. Choose again 15 for the Zoom levels, keep the rest at default and save the layer as OSM_Standard.mbtiles.
6. Click Run and Close when the calculation is finished.
7. Drag the OSM_Standard.mbtiles raster from the Browser panel to the Map Canvas and compare with the online OSM Standard layer.
8. To avoid confusion, rename the online layer to OSM Online and the offline layer to OSM Offline. You can do that by clicking right on the layer name and chosing Rename...
9. Save the project.
Now we have offline and online rasters in our survey project. In the next section we'll add a background vector layer.
2.3. Adding a vector background layer
If you are using a vector layer as a background layer:
-
Ensure to use a simplified geometry version of your data. This will help with smooth map navigation.
-
All vector layers not intended to be used as survey layers, have to be set as read-only.
In this section we'll create a GeoPackage with a layer containing a polygon with the boundary of our study area. You could also create a Shapefile in a similar way.
We'll continue with the project from the previous section.
1. Make sure the True Color Sentinel image is visible and zoom to the extent.
2. Change the on-the-fly reprojection to EPSG:32632 that we're using in this area. Click on the EPSG code on the lower right of the screen and choose the right projection.
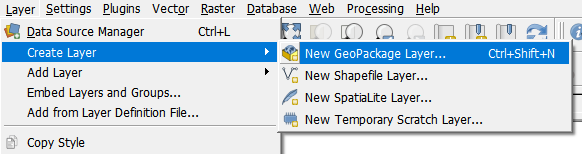
3. In the Main Menu go to Layer | Create Layer | New GeoPackage Layer....
4. Click the Browse button ![]() to go to your project folder and type a new name for a GeoPackage database, e.g. survey.gpkg.
to go to your project folder and type a new name for a GeoPackage database, e.g. survey.gpkg.
5. For Table name type Boundary. For Geometry type choose Multipolygon. Make sure the projection is set to EPSG:32632.
6. If you need attributes, you can add it here. A GeoPackage automatically adds a feature id to the attribute table, so you can also leave this open if you don't need attributes. In the next section we'll create the attributes for the survey layer.
7. Click OK to return to the Map Canvas.
Now an empty polygon vector layer with the name Boundary has been added to the Layers panel.
8. To start digitizing make sure the Boundary layer is on top and selected. Click the toggle editing button ![]() in the toolbar.
in the toolbar.
9. Click the Add polygon feature button ![]() and draw a polygon in the Map Canvas to indicate the border of your study area.
and draw a polygon in the Map Canvas to indicate the border of your study area.
10. Click right to close the polygon. A popup screen will ask to fill in the attributes. We keep the default and click OK.
11. Click the toggle editing button to stop editing and save the edits.
Now we need to style the polygon in such way that we can only see the border.
12. Click the ![]() button to open the Layer Styling panel.
button to open the Layer Styling panel.
13. Click Simple fill and click the drop down arrow at Fill. Choose Transparent fill.
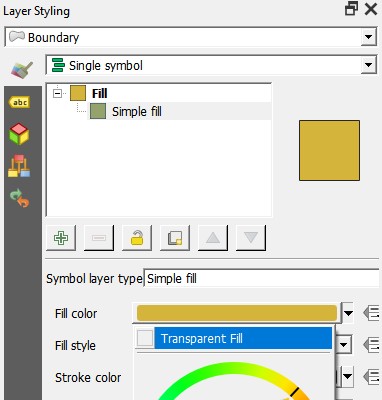
14. Choose for Stroke color red and a Stroke width of 1 mm.
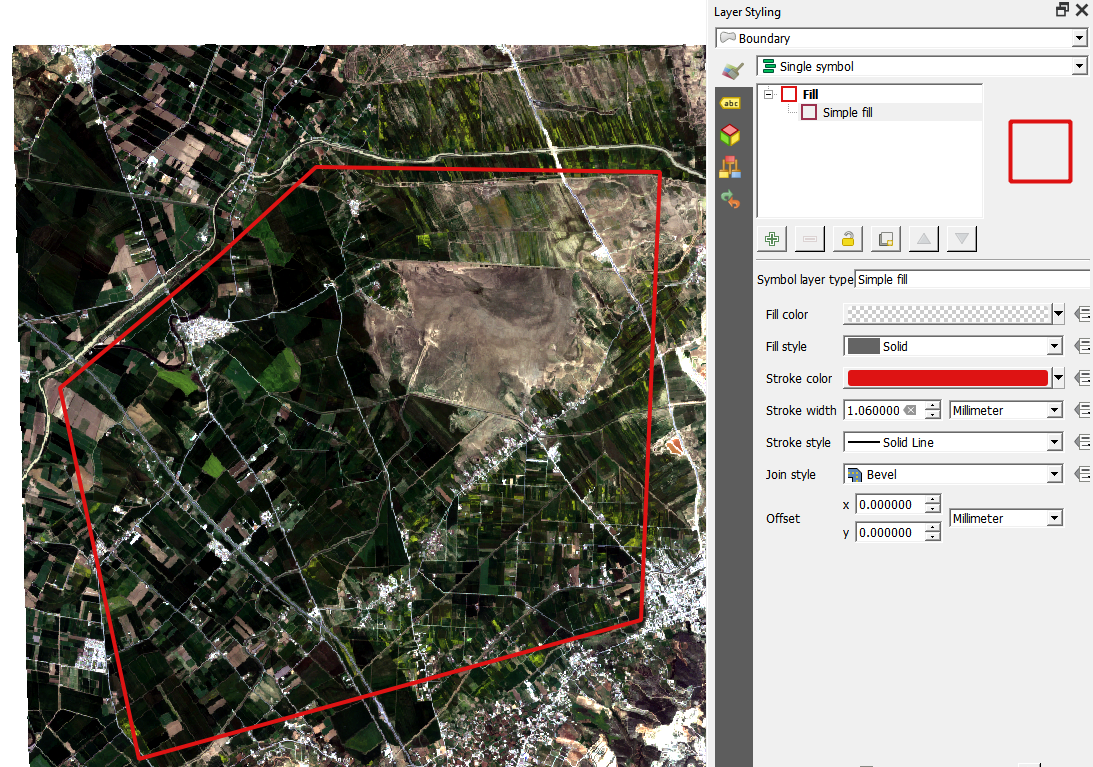
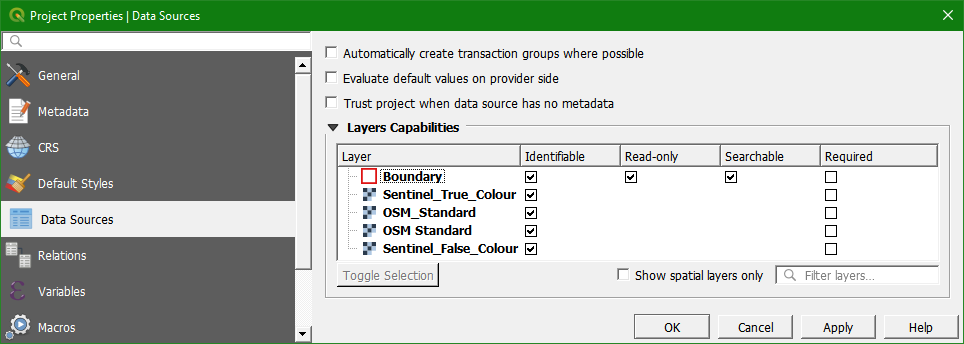
Because this isn't a survey layer, we need to make this vector layer read-only.
15. In the Main Menu select Project | Properties...
16. Select the Data Sources tab.
17. Check the box for Read-only for the Boundary layer.
2.4. Adding a survey layer
Vector layers can be added as survey layer for the Input app.
In this section we'll create a survey layer for collecting ground truth for crop cover classification with remote sensing.
The following steps will be covered:
- Create a point vector layer with the necessary attributes
- Styling of the points
- Make an attributes form using widgets
- Settings for the Input preview panel
Create a point vector layer with the necessary attributes
1. In the Main Menu go to Layer | Create Layer | New GeoPackage Layer....

2. Click the Browse button ![]() to go to your project folder and choose the GeoPackage from the previous section, e.g. survey.gpkg.
to go to your project folder and choose the GeoPackage from the previous section, e.g. survey.gpkg.
3. For Table name type Groundtruth. For Geometry type choose Point. Make sure the projection is set to EPSG:32632.
4. Now we're going to add the attributes. A unique feature ID is automatically generated in a GeoPackage, so we don't have to add the observation ID attribute. Add the attributes like in the screenshot below. Add them by using the Add to list button.
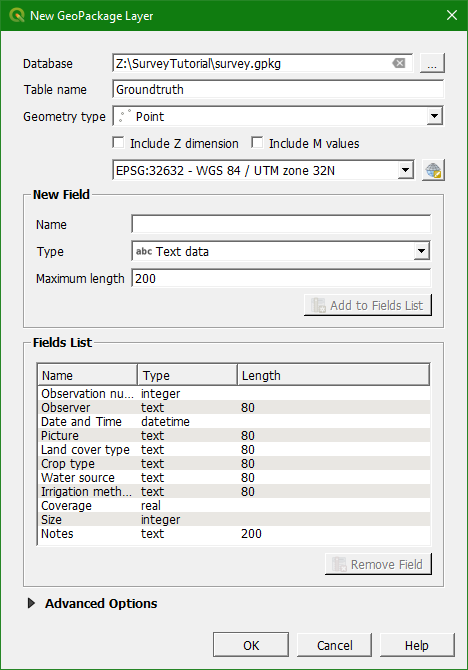
5. Click OK when done.
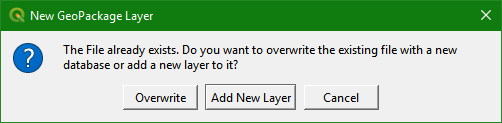
6. A popup will ask you if you want to overwrite or add a new layer. Choose Add New Layer so it will be added to the GeoPackage.
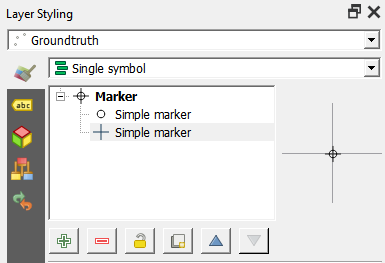
Styling of the survey points
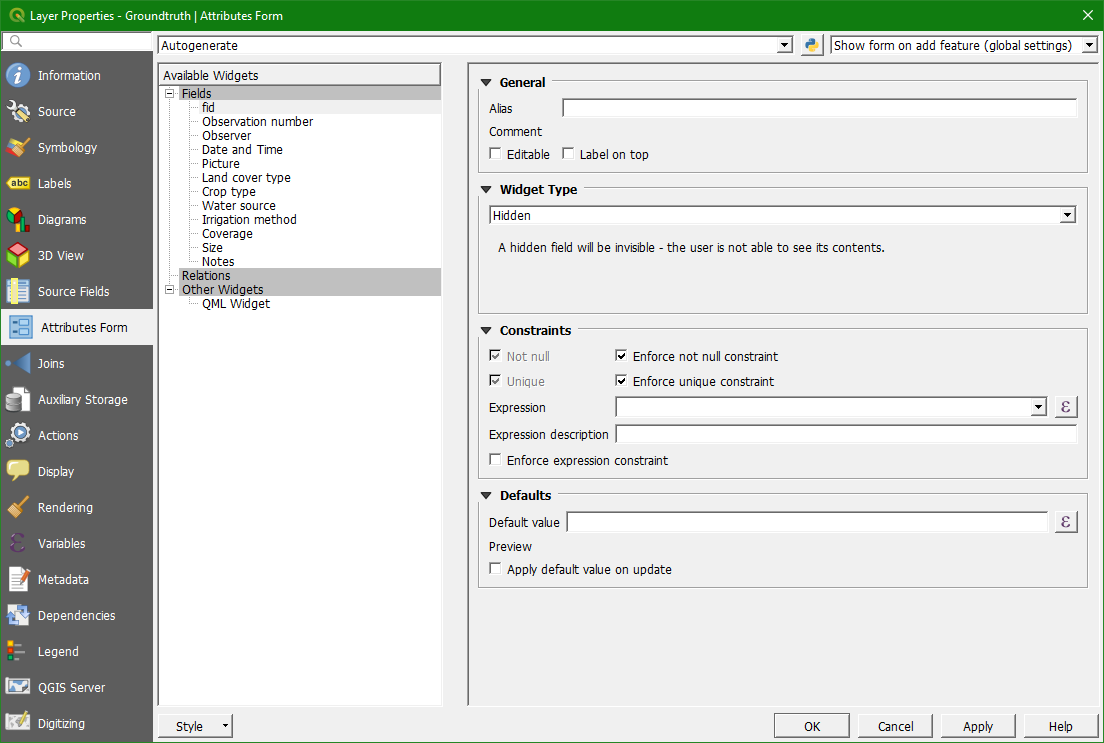
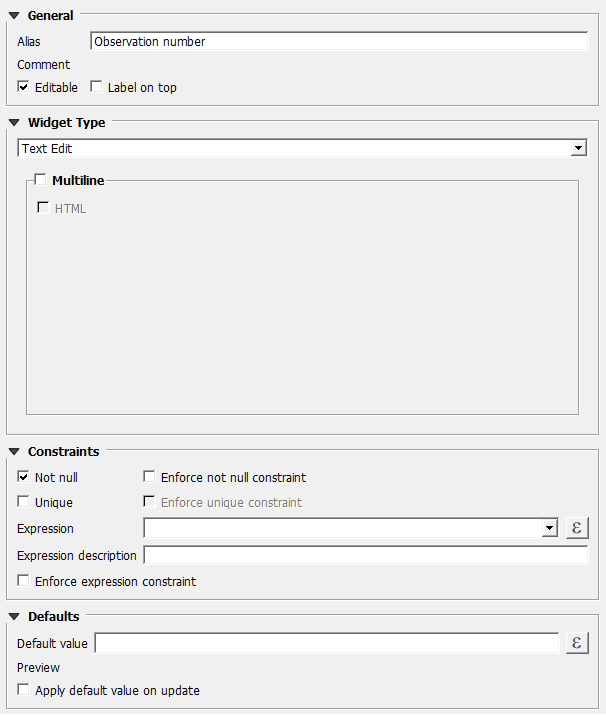
Make an attribute form using widgets
| Value | Description |
|---|---|
| 1 | Crop land |
| 2 | Tree cover |
| 3 | Shrubland |
| 4 | Grassland |
| 5 | Wetland |
| 6 | Artificial |
| 7 | Bare soil |
| 8 | Fallow land |
| 9 | Seasonal water |
| 10 | Permanent water |
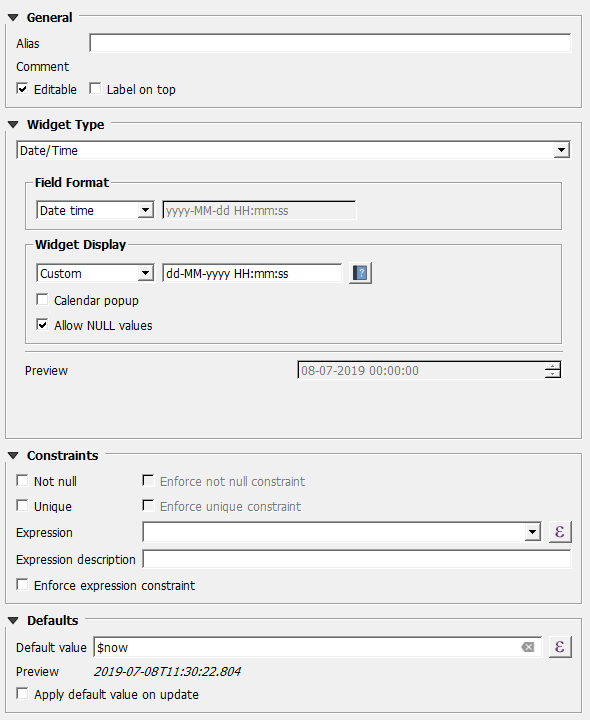
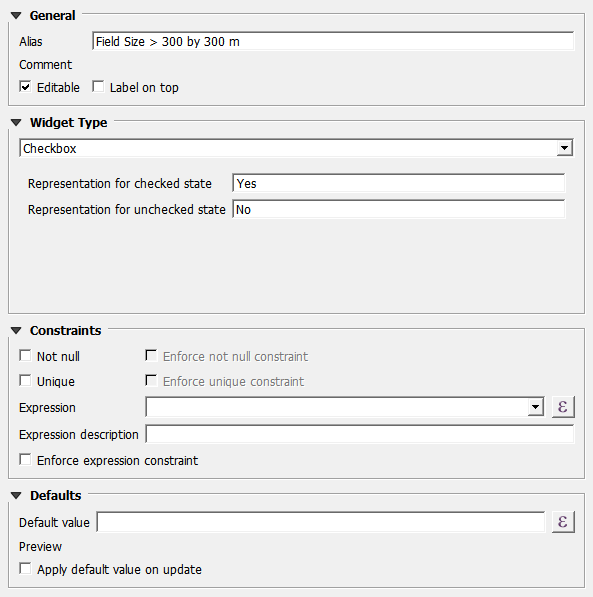
18. Set Constraints to Not null. And put the default value on 1, because for the purpose of crop mapping this will be chosen mostly.
| Value | Description |
|---|---|
| 1 | Wheat |
| 2 | Maize |
| 3 | Rice |
| 4 | Barley |
| 5 | Soybeens |
| 6 | Pulses |
| 7 | Cotton |
| 8 | Potatoes |
| 9 | Alfalfa |
| 10 | Sorghum |
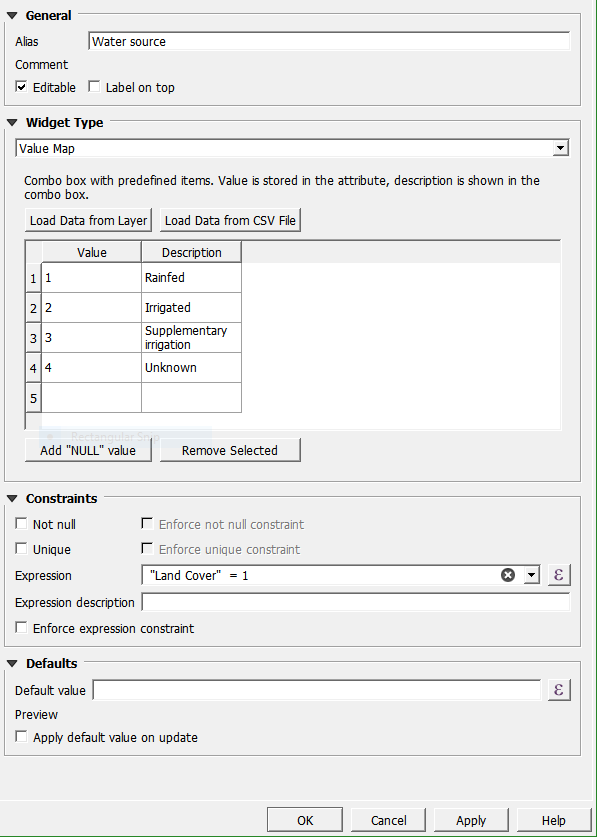
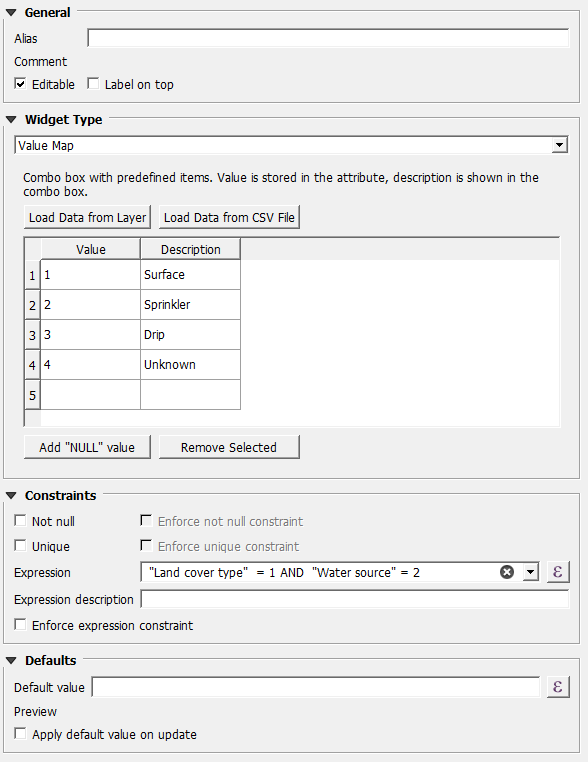
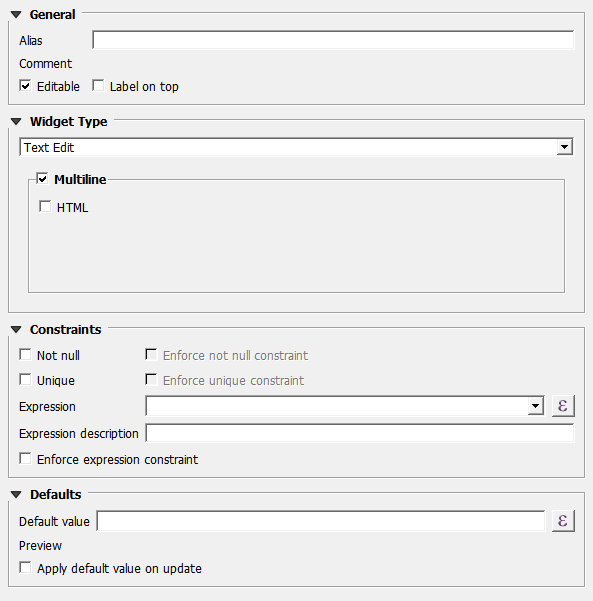
21. At Constraints write the following Expression: "Land Cover" = 1. This means that this can only be filled in when the Land Cover equals 1. By checking the box Enforce expression constraint you can prevent users to override the restriction.
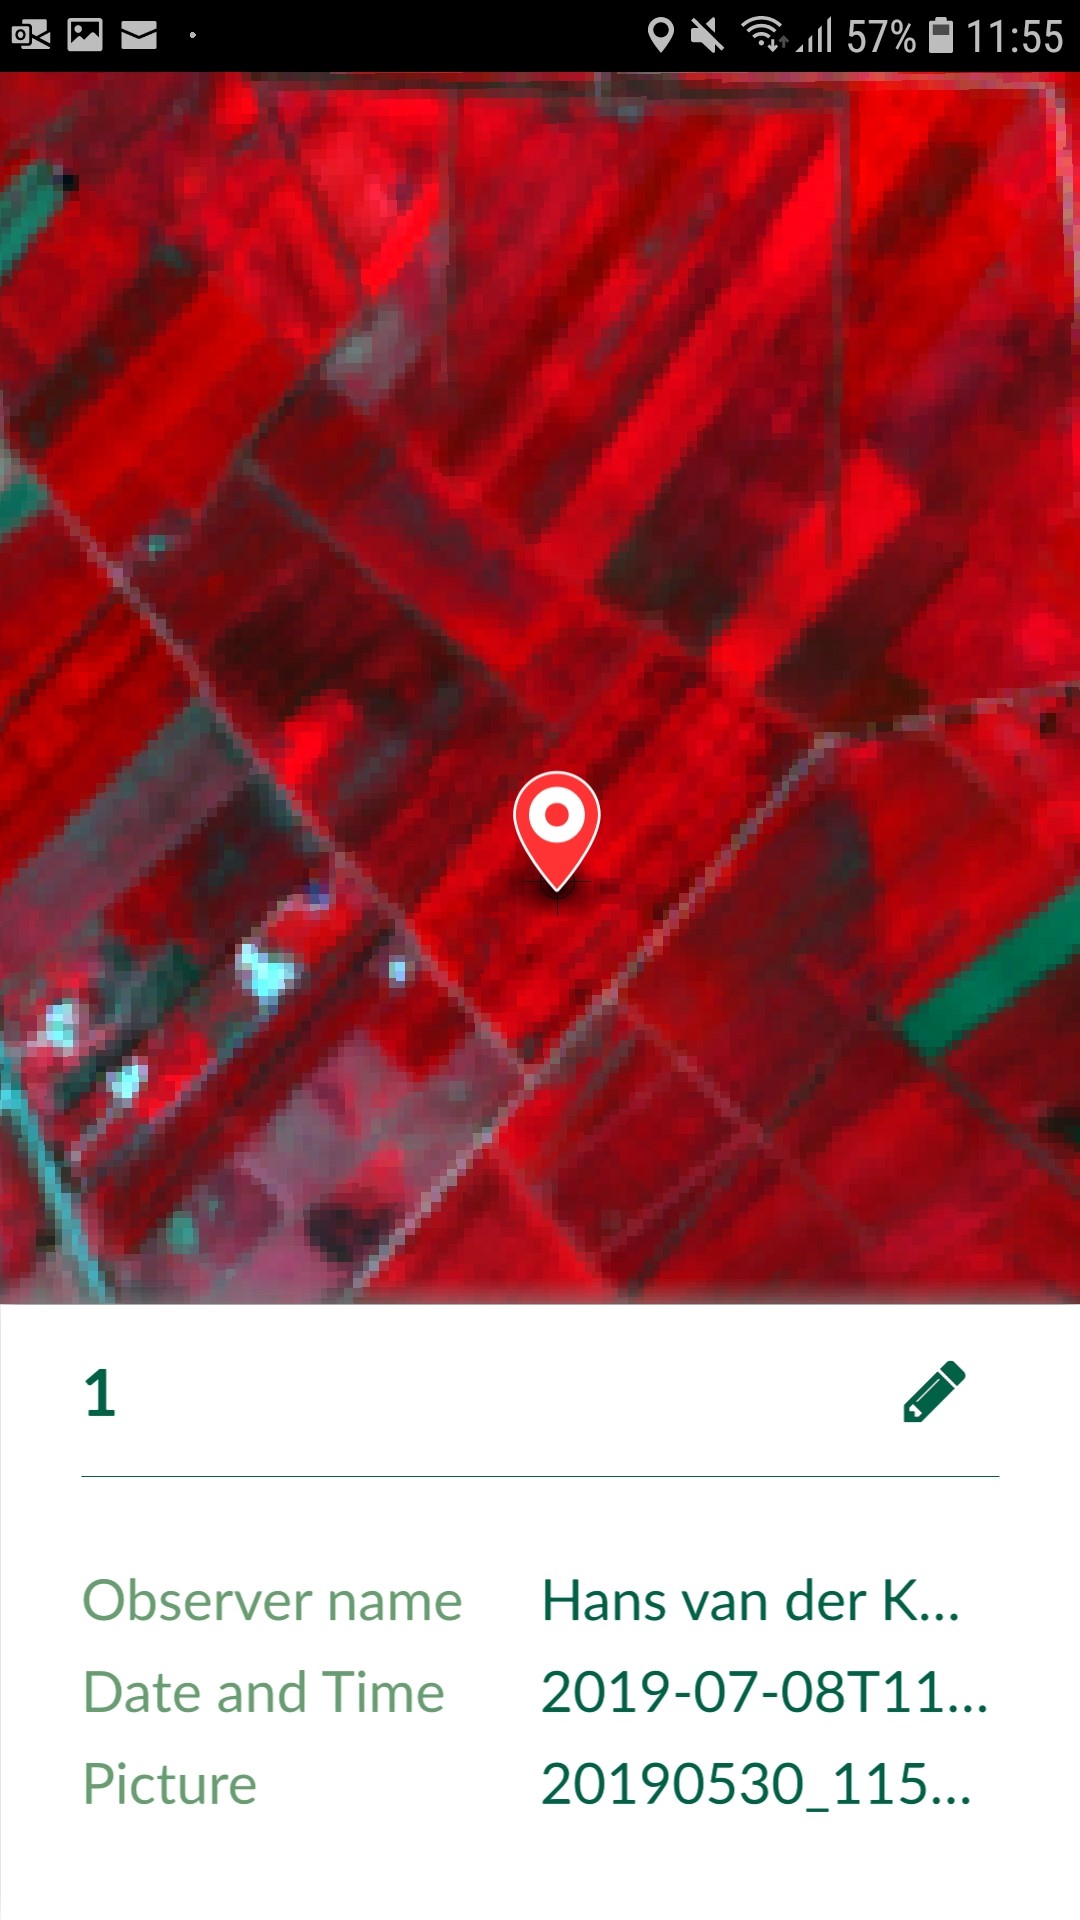
Settings for the Input preview panel
Similar to Google maps, when a feature is identified on the map a
preview panel will appear. To enable a layer being identified, the
option should be enabled in QGIS desktop, under Project properties.
29. For setting the preview panel, you need to click right on the Groundtruth layer and choose Properties. Then select the Display tab.
-
title - this will use "Display Name" which can be a field name or an expression.
-
content - there are three options for what to show in content area: 1. field values, 2. image, 3. HTML. This will use "HTML Map Tip". QGIS always interprets the content of map tip as being HTML, however Input extends the syntax to allow two more modes. If the map tip is not specified, Input will try to use the first three fields and show their attribute values.
Field values
Sample map tip content that will show "description" and "time" field values:
# fields
fid
date and time
If the map tip content has # fields marker on the first line, the following lines will be understood as field names that should be listed in the preview.
At most three fields will be shown. Expressions are not allowed.
Image
Sample map tip content that will cause an image to be show specified by file path in field "image_1" (containing path relative to the project directory):
# image
file:///[%@project_folder%]/[% "Picture" %]
If the map tip has # image marker on the first line, the
following line is understood as the URL for the image. It can be a
regular file on the file system, but it could be even a remote image
from network. Expressions embedded in the image URL will be evaluated
(enclosed in [% 1+1 %]).
HTML
Sample map tip content that will show render as HTML page:
<p><strong>Notes:</strong>[% "notes" %]</p>
If the map tip does not contain any special marker, it is assumed that the map tip is HTML content. Only a limited subset of HTML is supported - see https://doc.qt.io/qt-5/richtext-html-subset.html
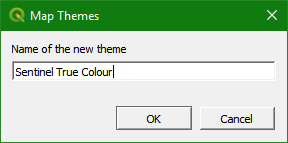
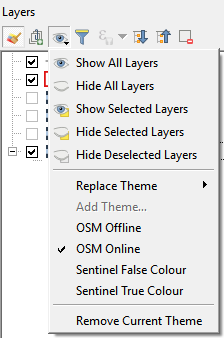
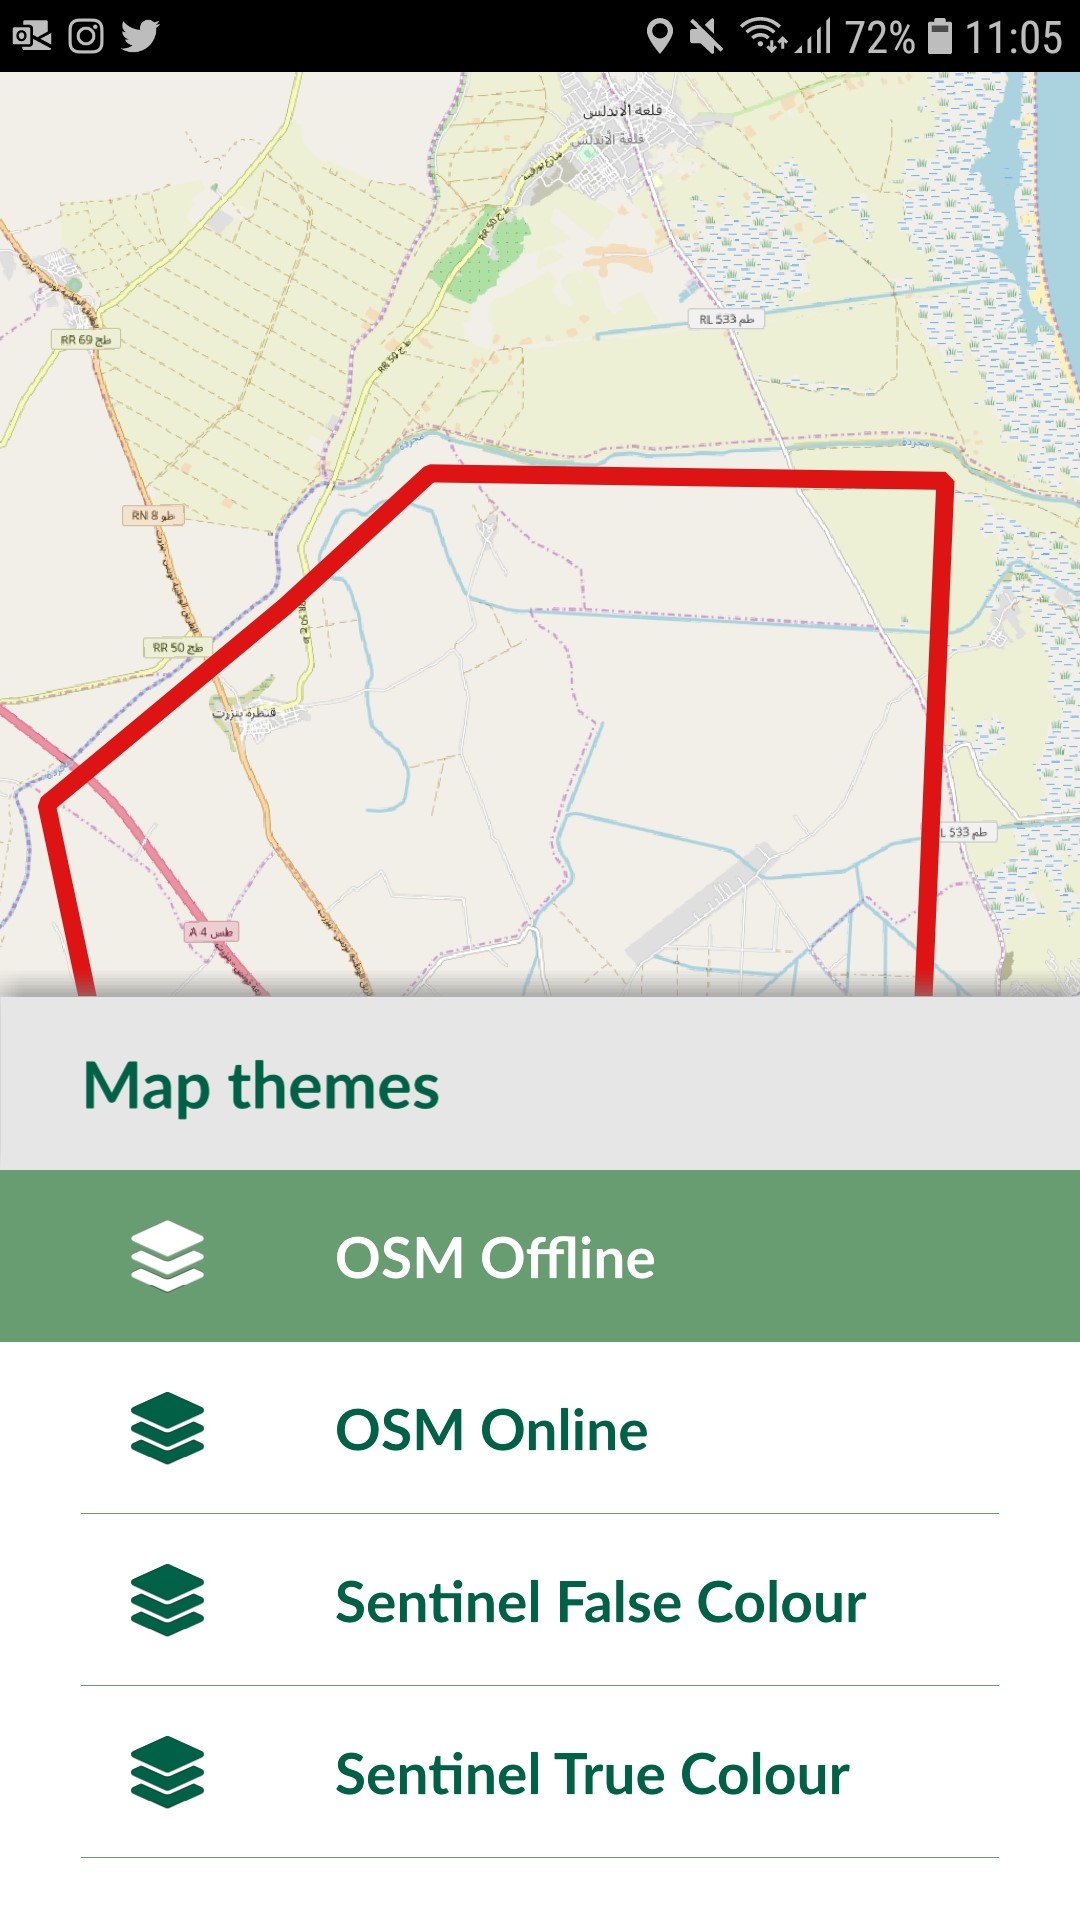
2.5. Creating map themes
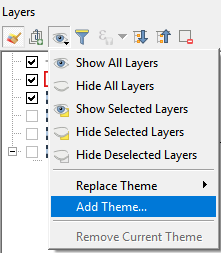
To facilitate the changing of background maps, we can configure map themes in our QGIS project.
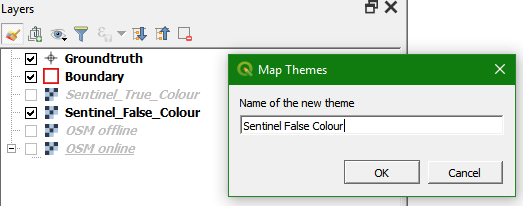
With map themes you can show only visible layers that are stored in a theme.
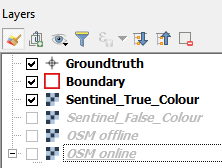
All our themes need the survey layer (Groundtruth) on top, followed by the Boundary layer.
We'll make map themes to show them on:
- Sentinel True Colour
- Sentinel False Colour
- OSM online
- OSM offline
3. Synchronizing your project with Mergin
Input comes with built-in functionality to seamlessly synchronise your projects and data through Mergin.
In this section we'll synchronize the project from the previouse sections with the Mergin cloud service.
1. Go to your internet browser and sign up to Mergin (https://public.cloudmergin.com/).
2. In QGIS install the Mergin plugin.
3. In the Browser panel you'll now find a Mergin folder.

Note 1: that there is no menu entry or toolbar icons for Mergin plugin. The only method to interact with the service is through the QGIS Browser panel.
Note 2: You may need to restart your QGIS to see Mergin in your QGIS browser panel after the installation.
To be able to view Mergin projects, we need to sign in:
- For URL: type https://public.cloudmergin.com
- For Username: type your Mergin username
- For Password: type your Mergin password
- Click Test Connection and it should show OK.

To view the list of your projects, click on the arrow to the right of Mergin in your QGIS browser panel.
Using Mergin plugin
The following functionalities are available from Mergin plugin:
Create a new project
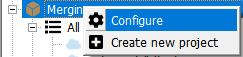
8. You can start a new project by right-clicking on Mergin from the browser panel and selecting Create new project:
- Type a name for Project name
- Selecting Public will make your project available to all Mergin users
- Project Directory will be the folder where your project and associated layers reside (the project that we made in the previous sections.
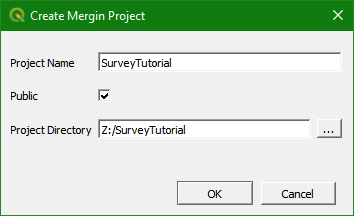
9. Click OK.
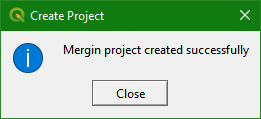
10. A popup window will appear that shows that the project was successfully created. Click Close.
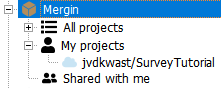
11. You can find the project now under Mergin | My projects.
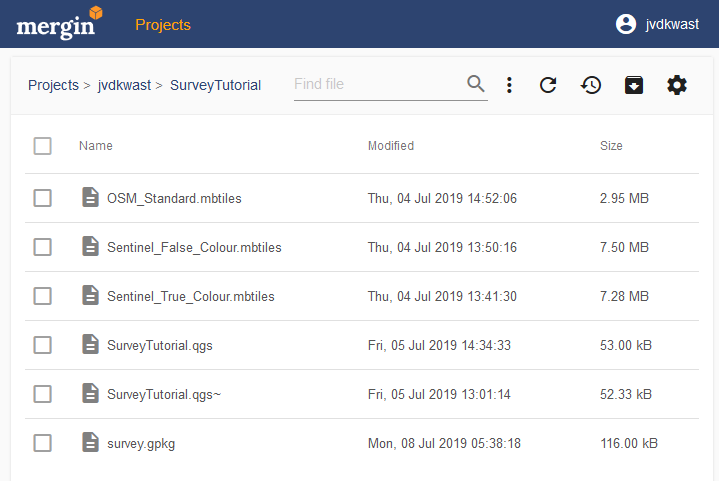
12. Check the result on the Mergin website (https://public.cloudmergin.com/). Your project and its files should be listed there now.
Now your project is synchronised with the Mergin cloud service and can be synchronised with the Input app on a smartphone or tablet, which will be explained in the section 4.
The following subsections are for reference for working with the Mergin plugin.
Download a project
To download a project:
- Right-click on the project under Mergin, from the browser panel
- Select Download
- A new window will appear to set the folder path
- Once the project is downloaded, you can select to Open the downloaded project.
Synchronise the changes
With Mergin service you can synchronise your local changes back to the server. Simply, right-click on the project from the browser panel and select Synchronize
You can also use Synchronize function to download changes made to your local projects from Mergin.
Remove a local/downloaded project
If you no longer want to have the project and its associated files available locally, you can delete them by right-clicking on the project from browser panel and select Remove locally.
Ensure to use this function to remove the projects. Deleting the files manually might cause synchronisation problems.
Remove project from server
This will remove your project from Mergin server. You need to first remove the project locally, to be able to delete it from the server.
You can also drag-and-drop your project folder (including layers, SVGs, etc) to Mergin project webpage.
4. Capturing data and editing forms using Input
Accessing projects
1. Install the Input app from Google Play Store.
Once you open the application for the first time, it will take you to Home screen. This screen displays all the projects stored locally (under /sdcard/INPUT folder).
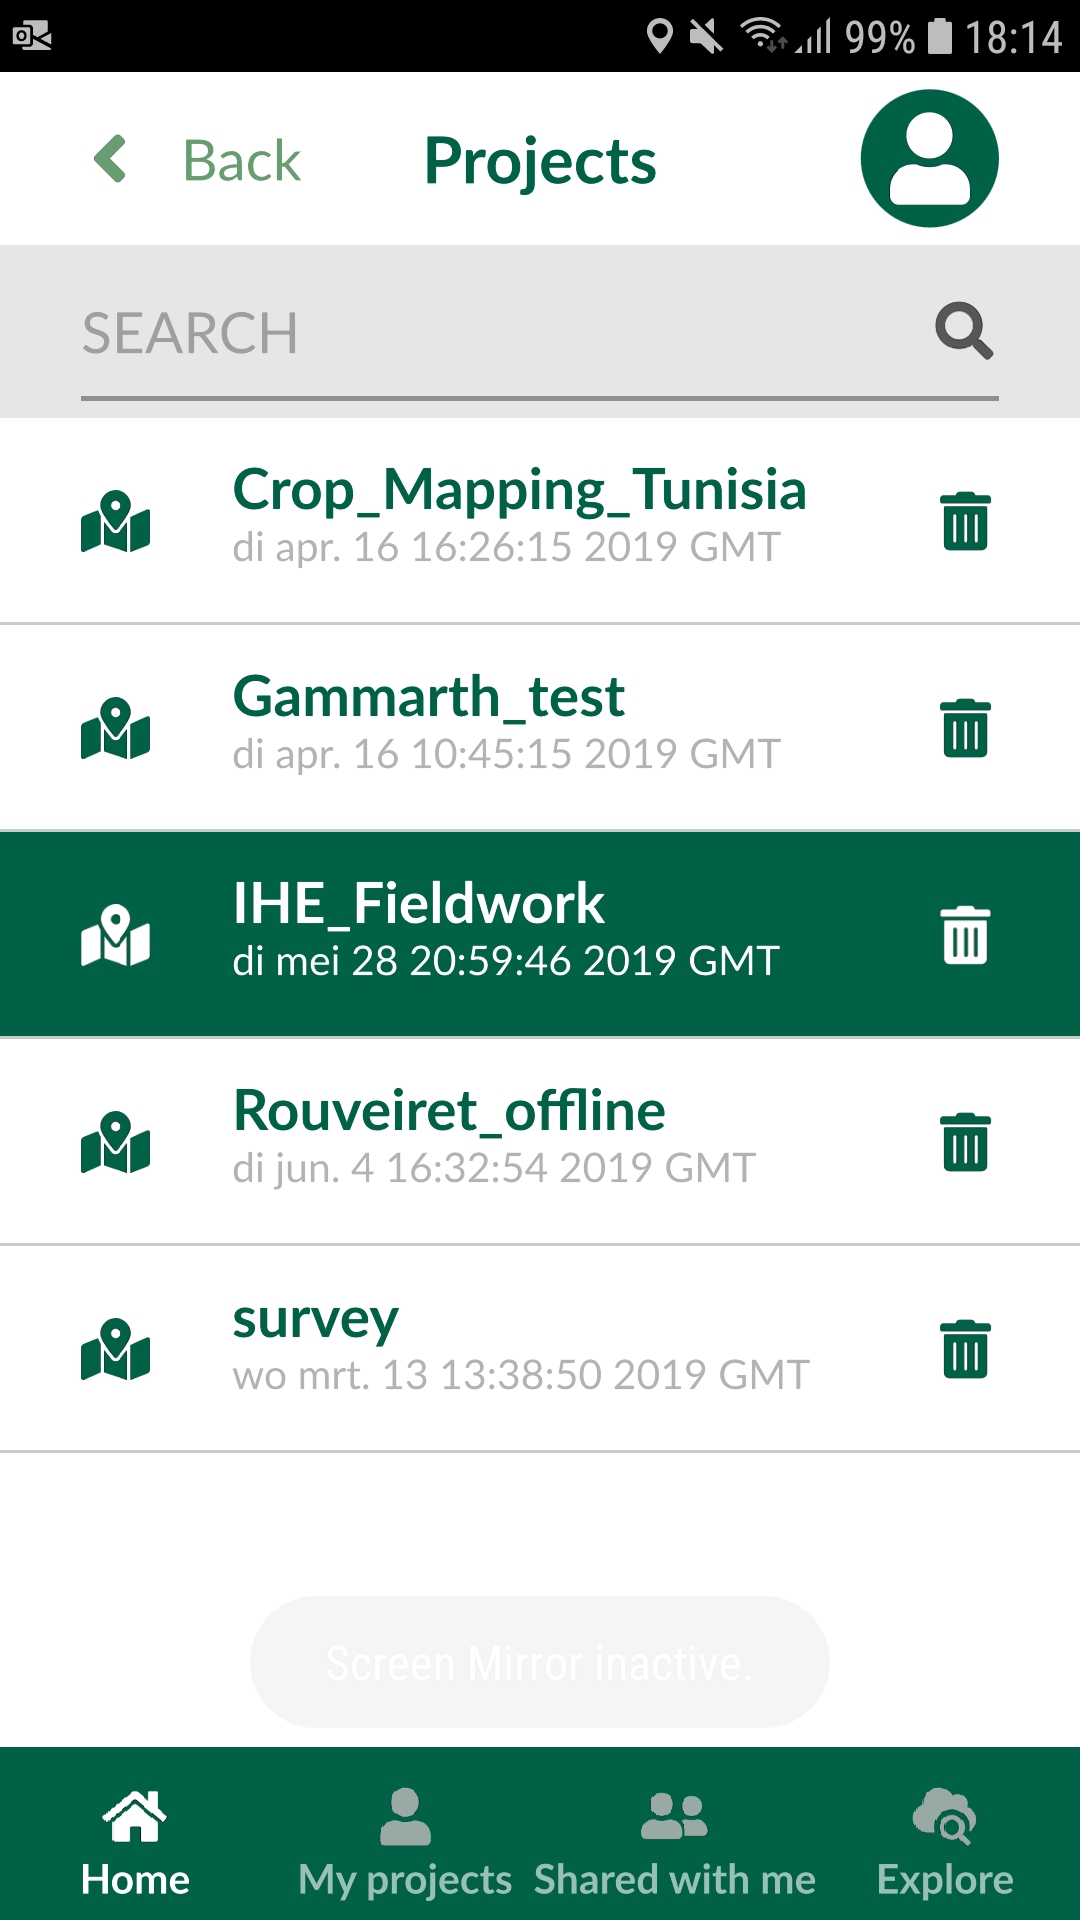
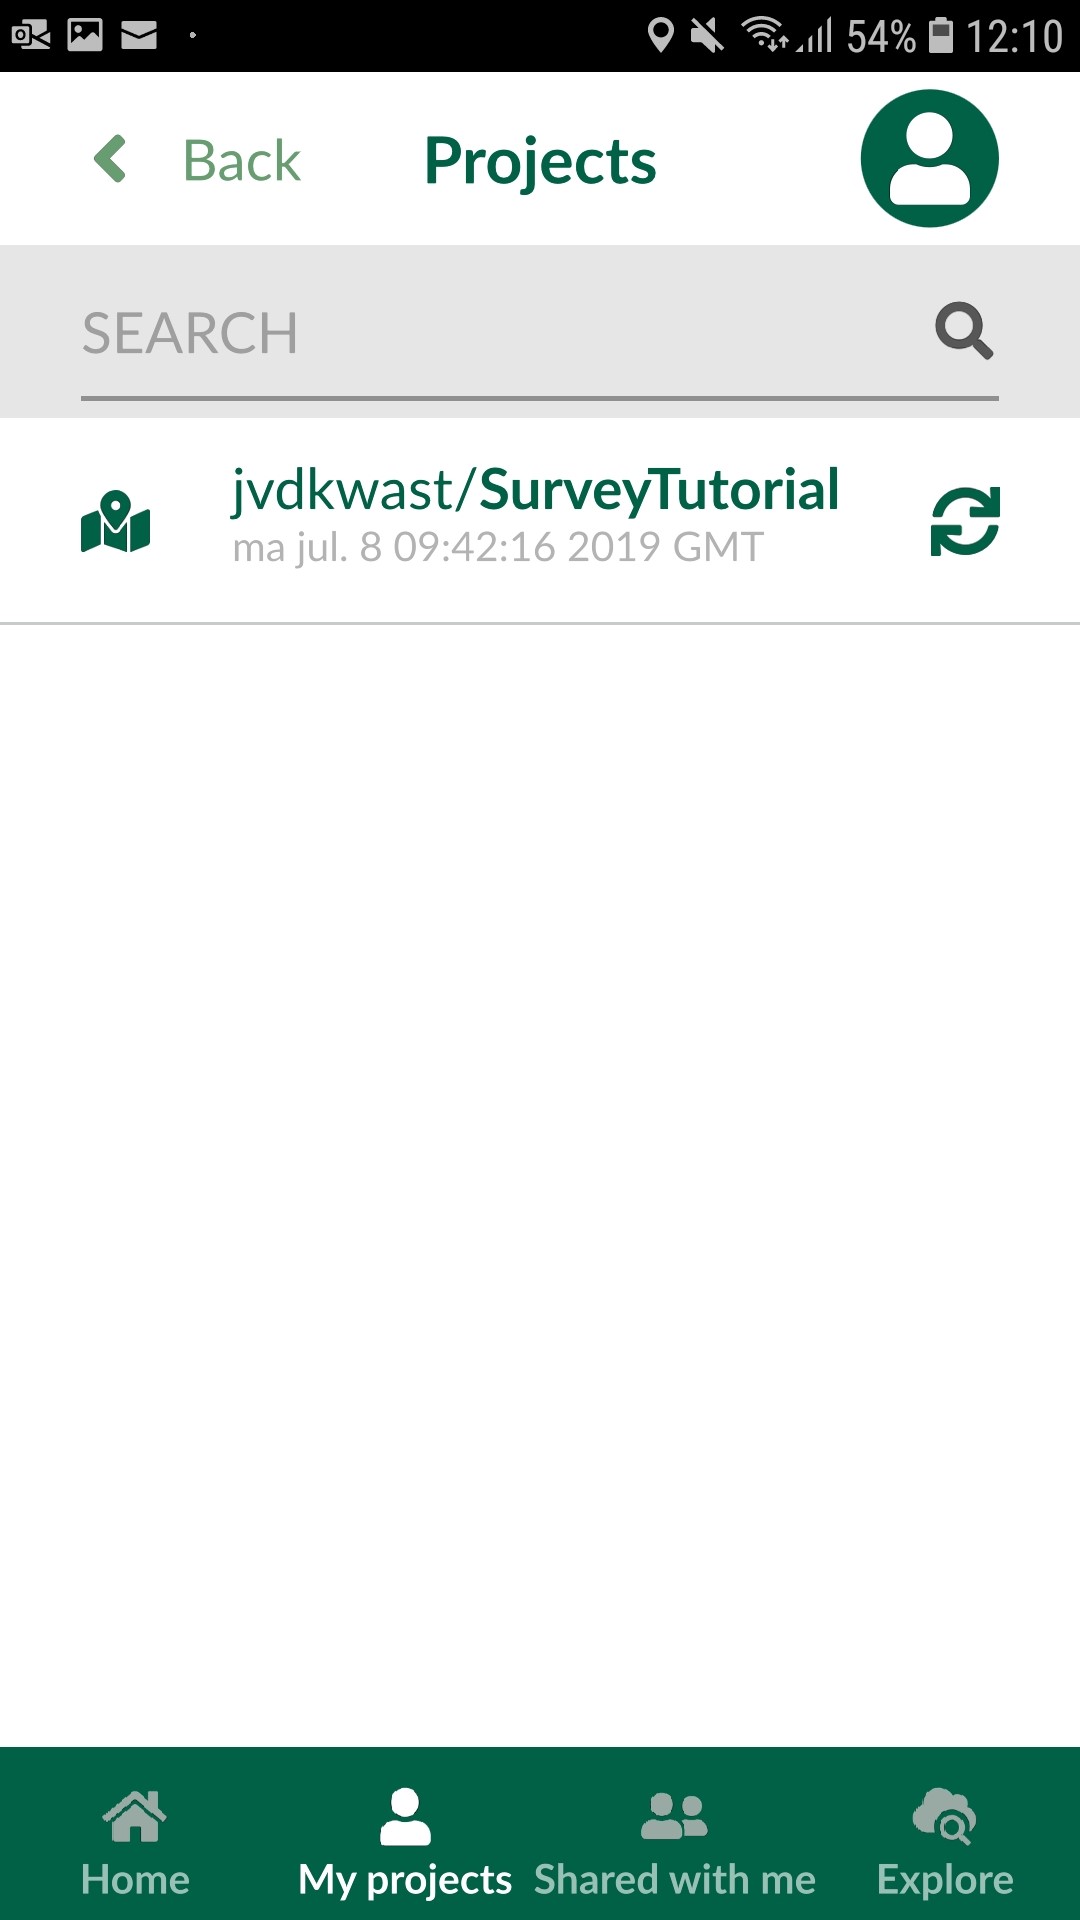
2. To access your projects on the Mergin cloud, select My projects. You will need your log in details to sign in to Mergin:

Once logged in, you can download your project to work on it locally by pressing download button to the right of the project.
3. Download the survey project from the previous sections by tapping the cloud with the downward arrow.
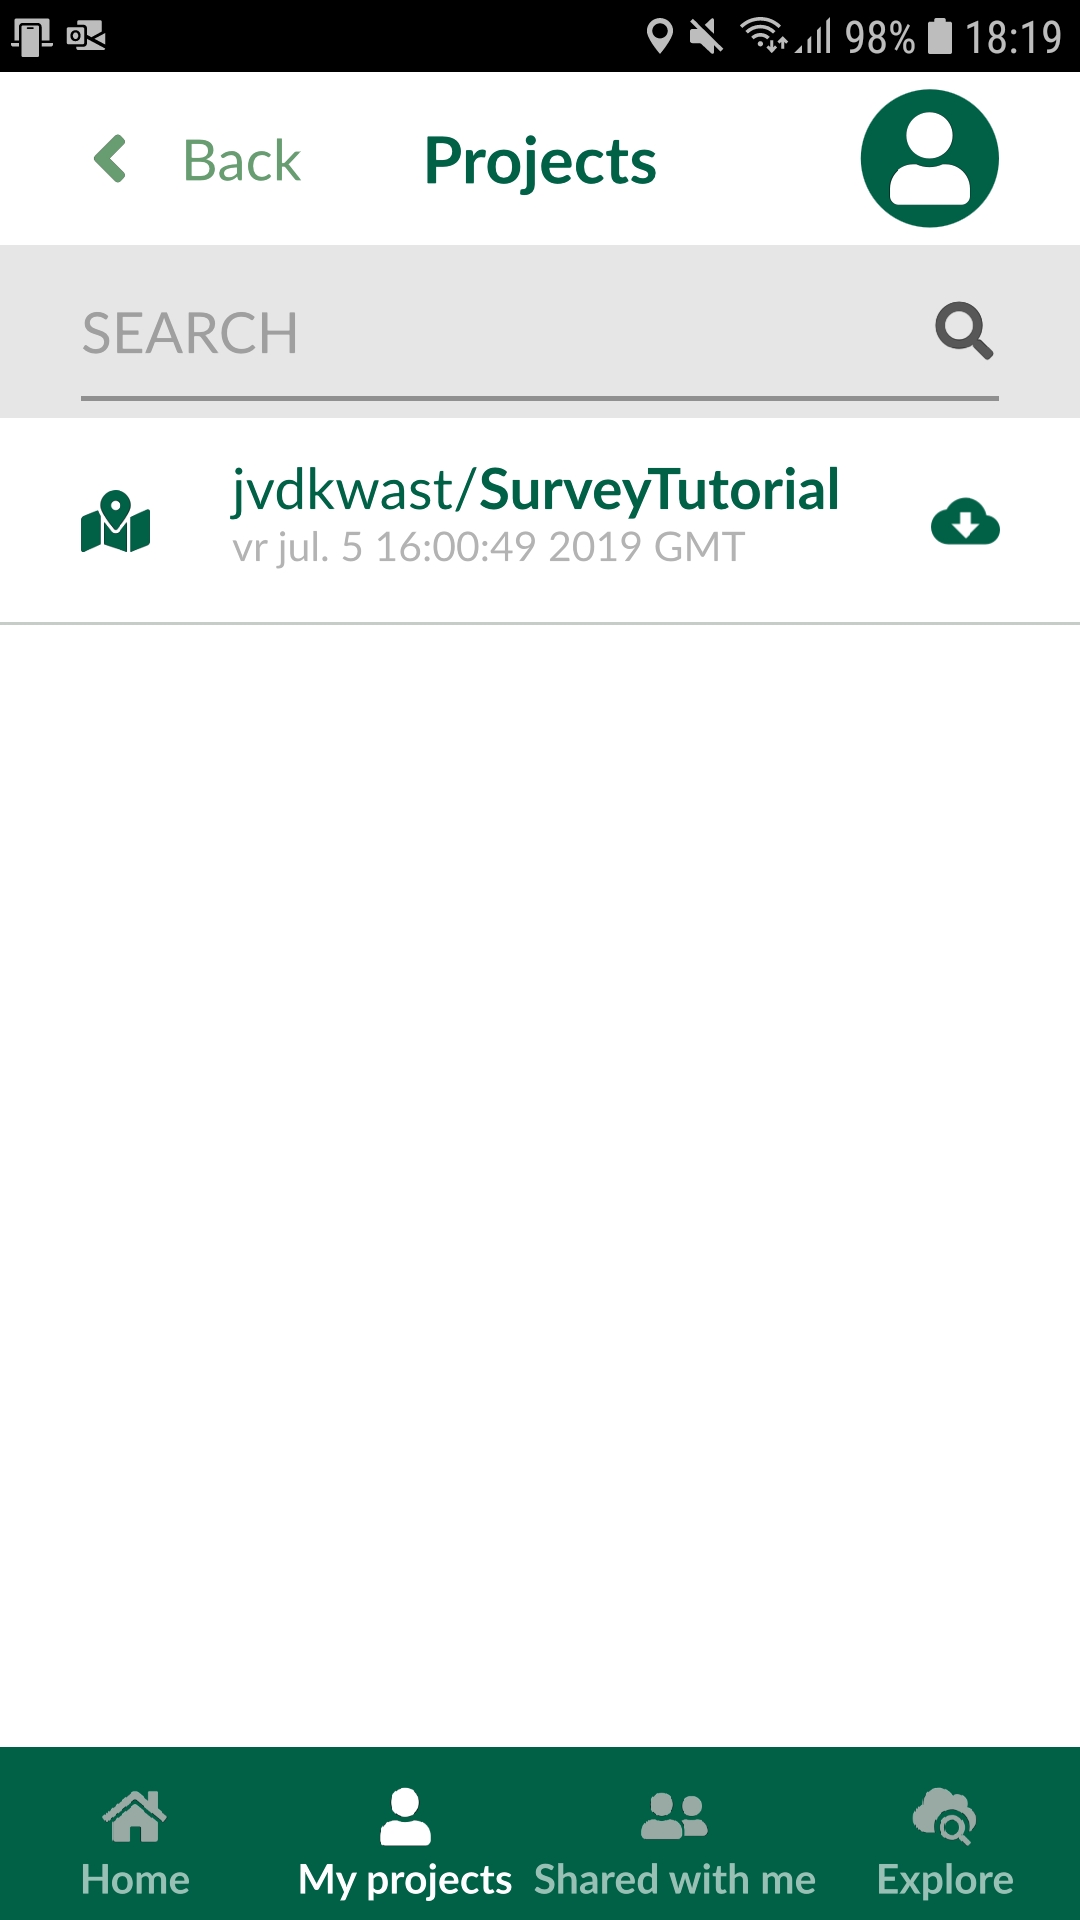
The project will be available for loading in Input after you download it locally.
4. Select Home and you should be able to see your downloaded project:
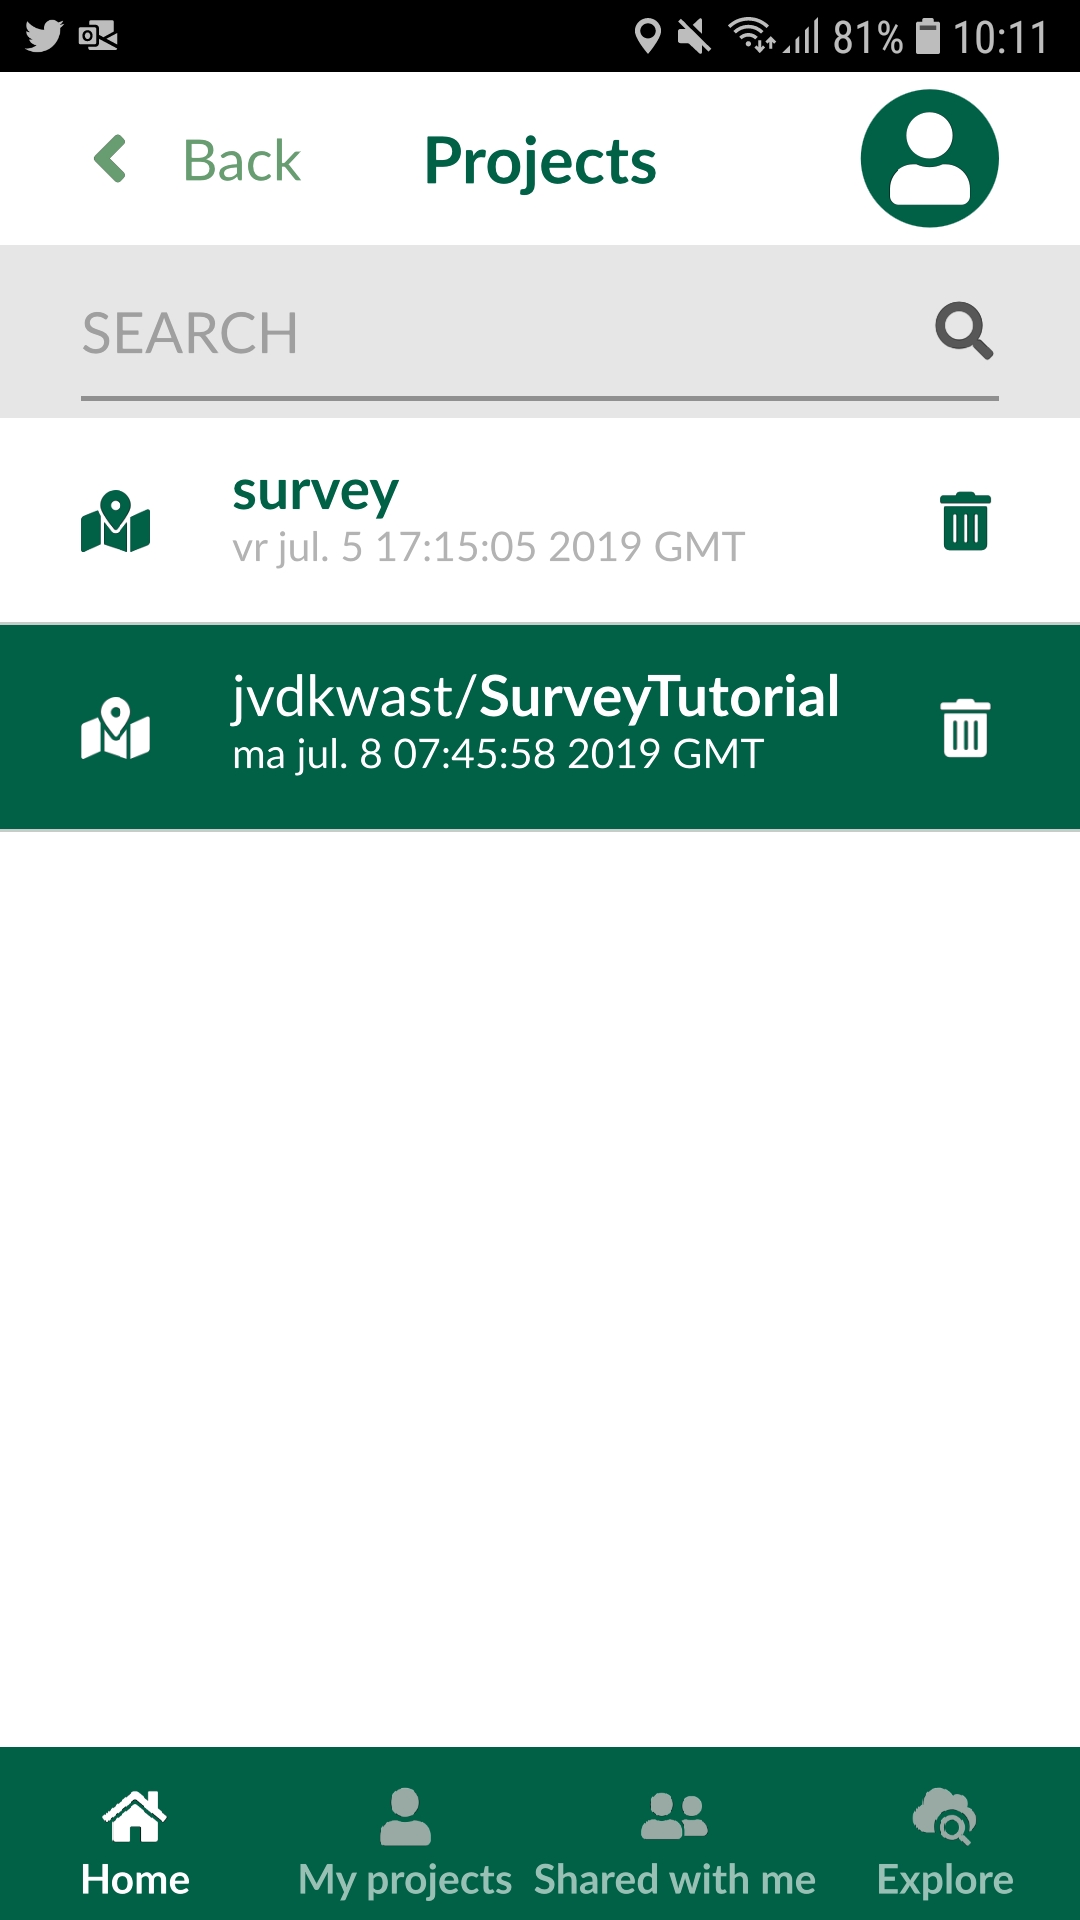
5. Tap the project under to open it in Input.
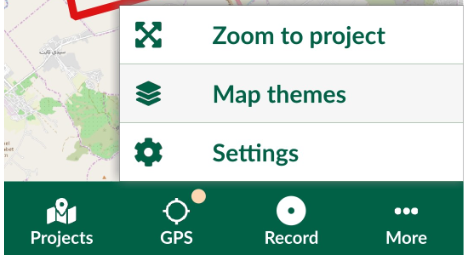
You'll now see one of the map themes.
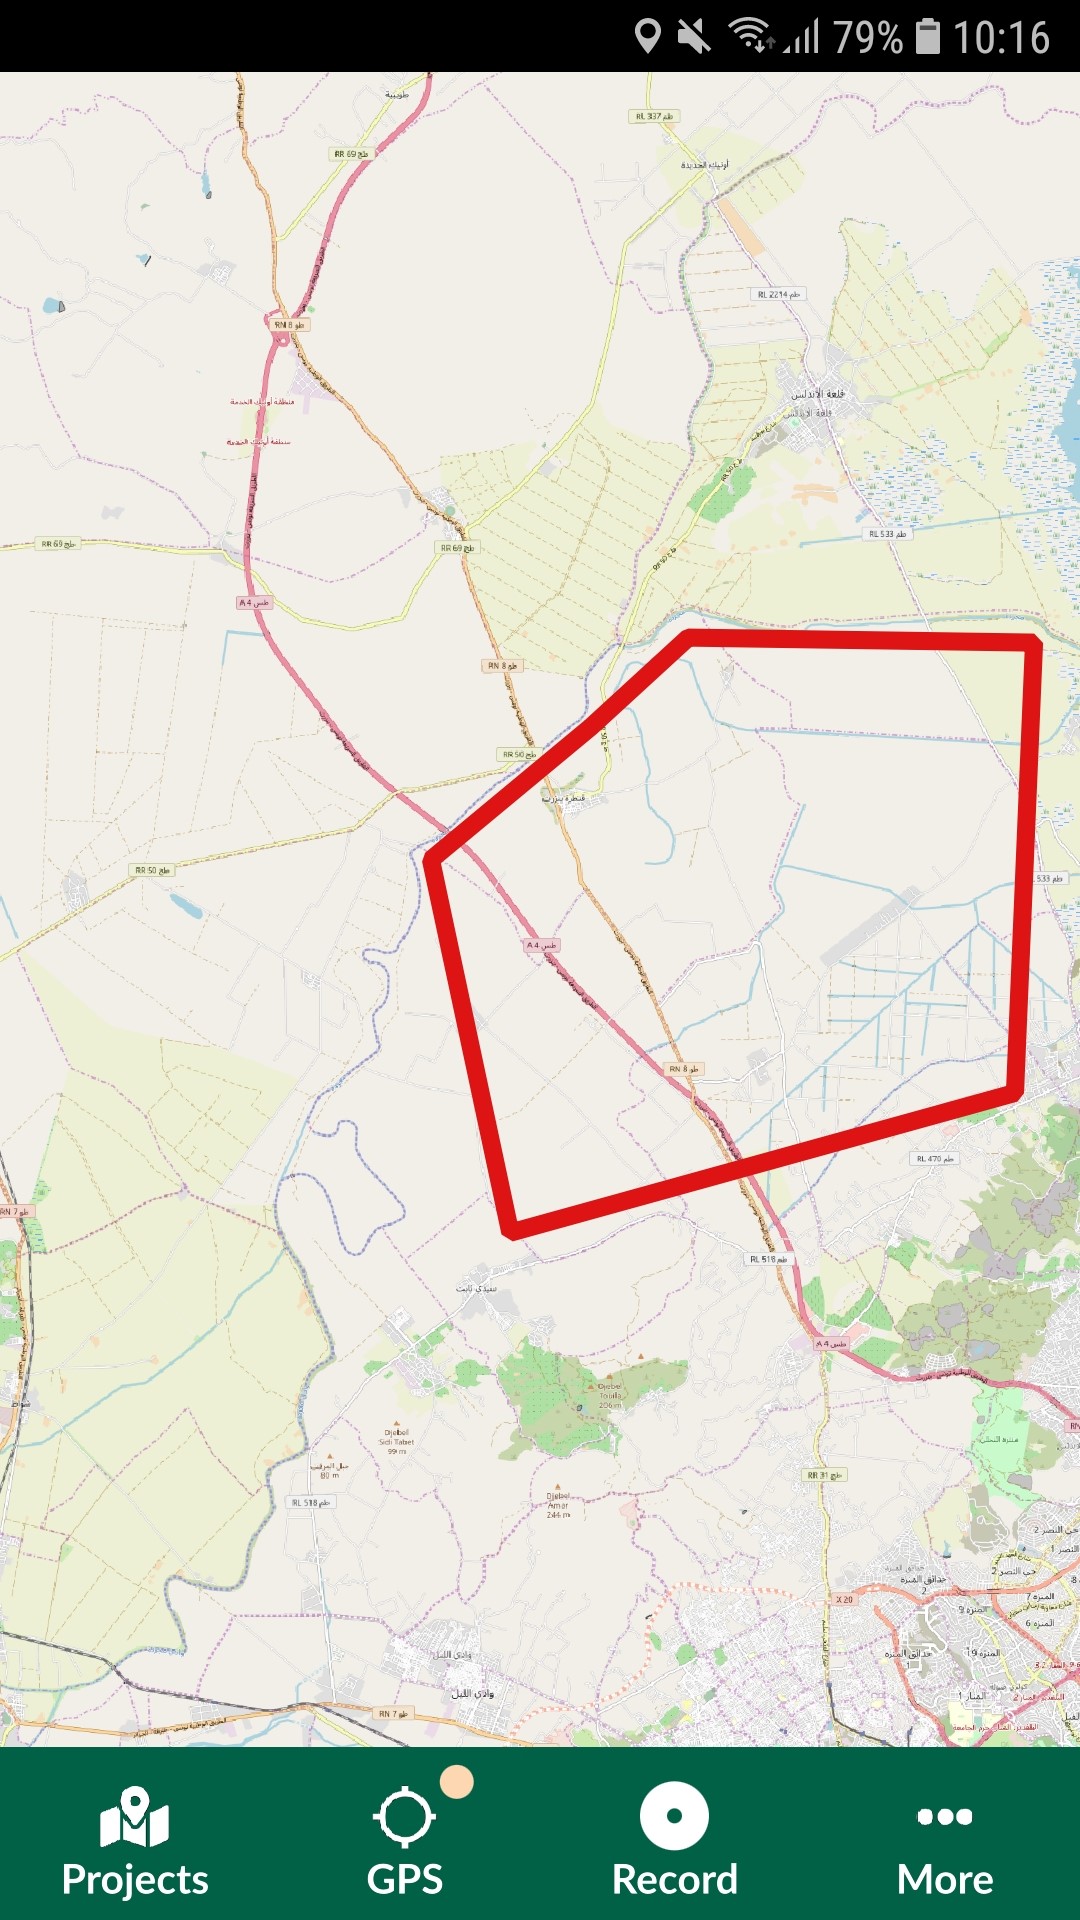
Change background layers
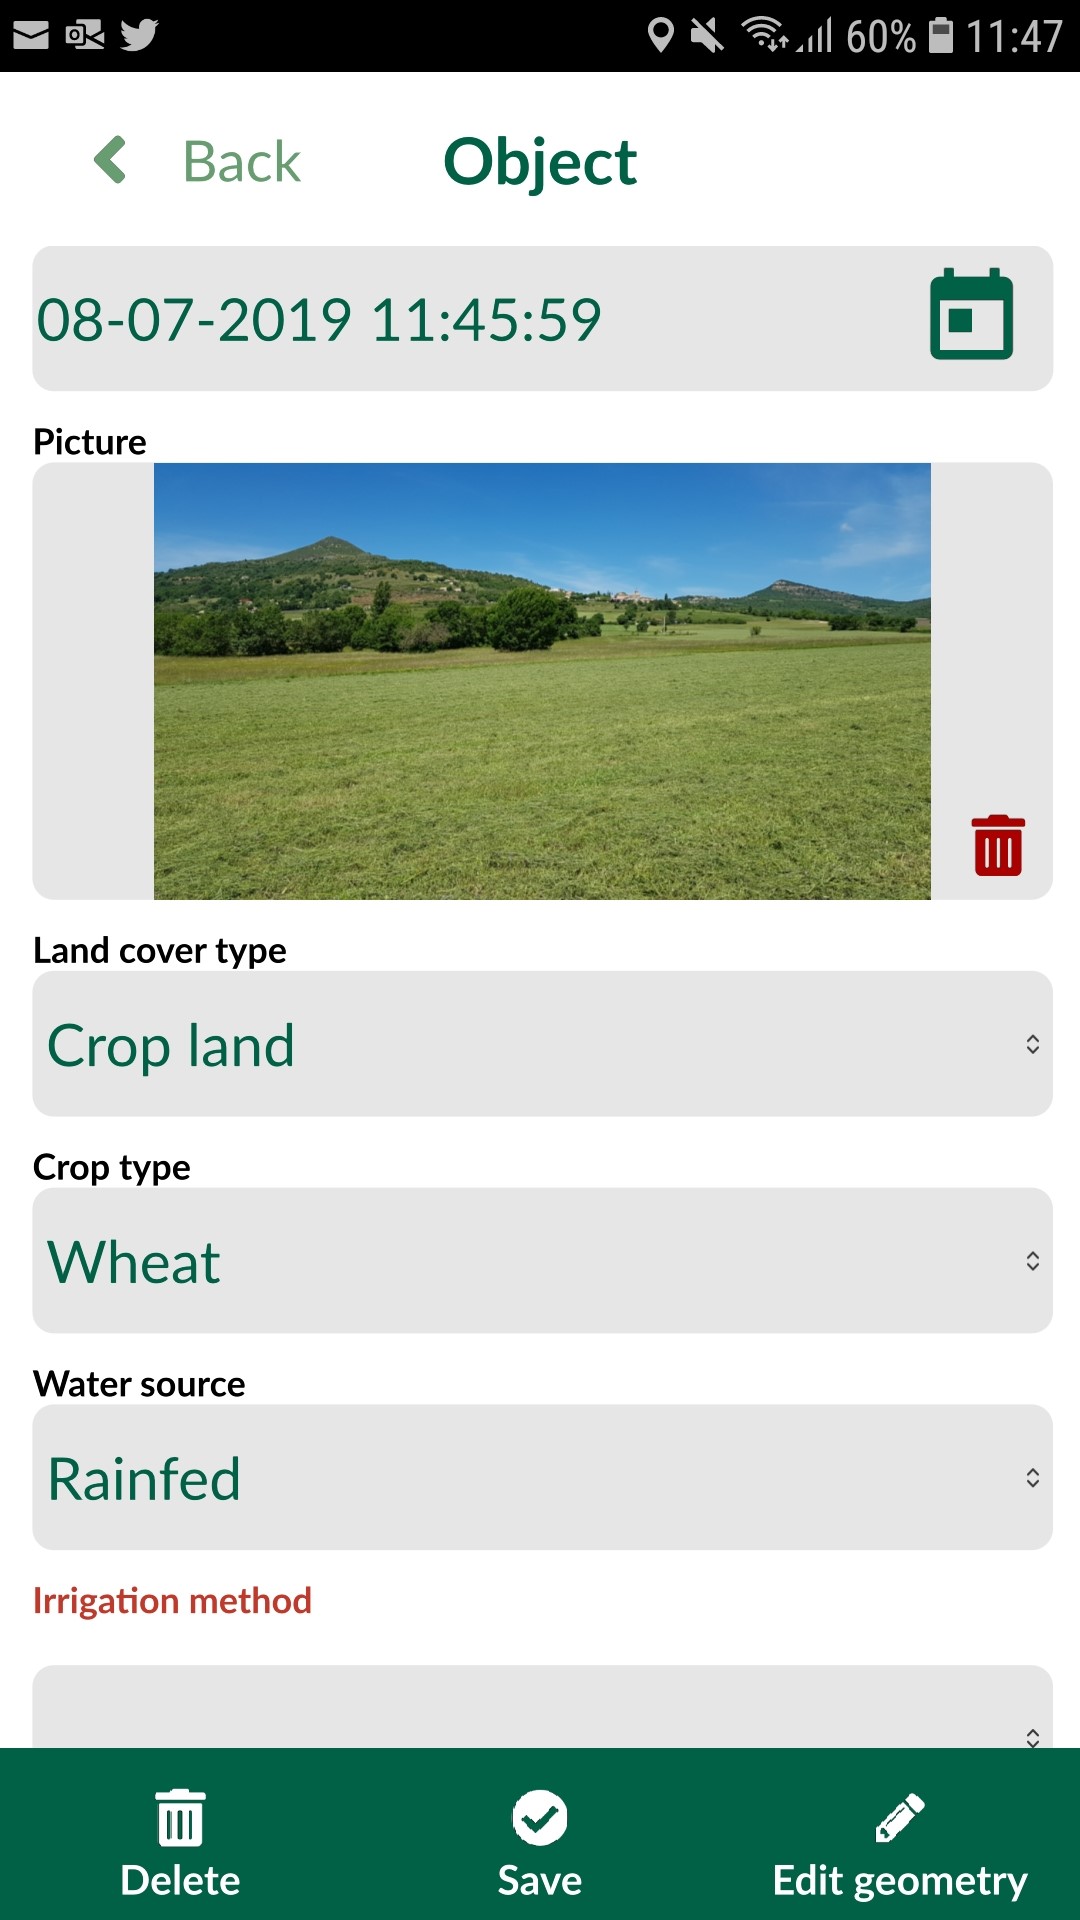
Adding/editing features
10. To add a feature, tap the Record button  from the lower panel. When you tap on the record button, it will list all the
layers, you can edit. In our case that's only the Groundtruth layer.
from the lower panel. When you tap on the record button, it will list all the
layers, you can edit. In our case that's only the Groundtruth layer.
In Input, you have two modes to capture feature:
-
GPS location or streaming (if you are capturing lines/areas)
-
Free hand: by adding points or nodes to lines or areas
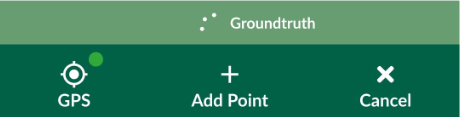
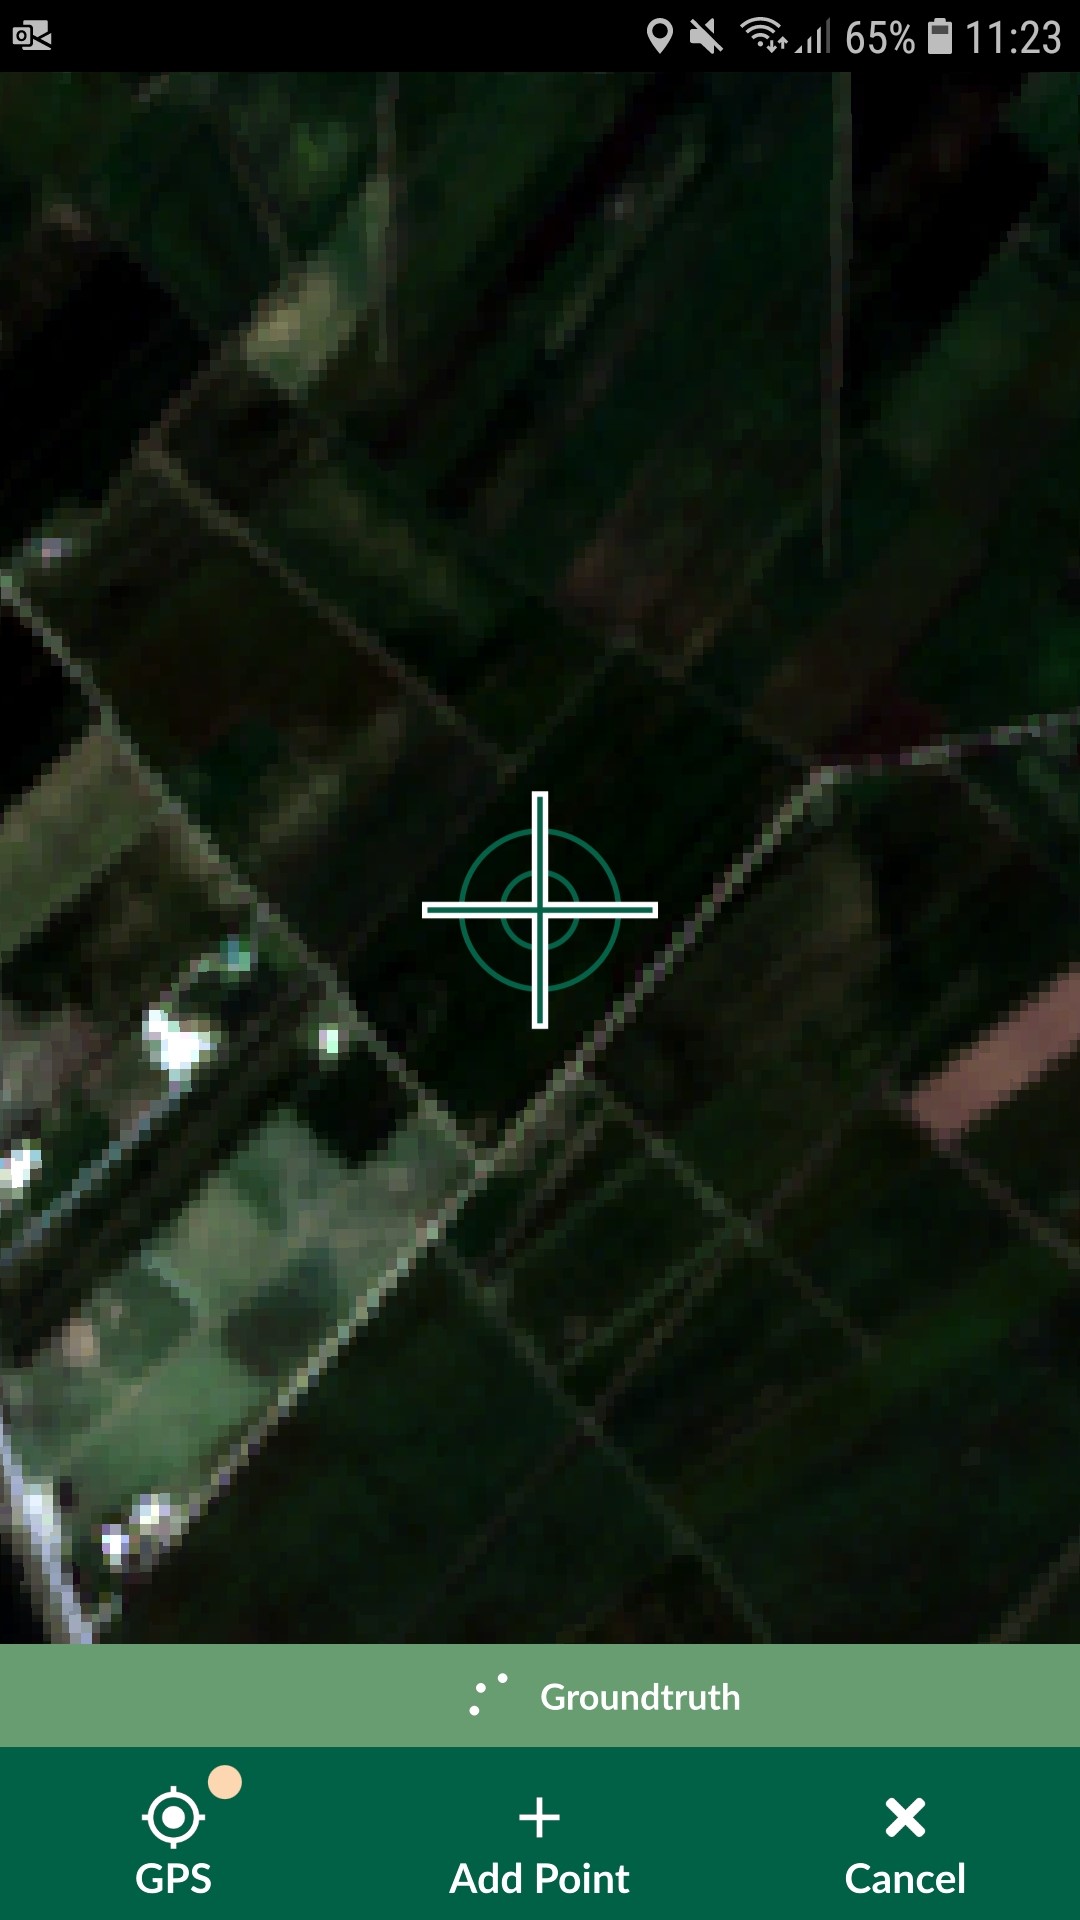
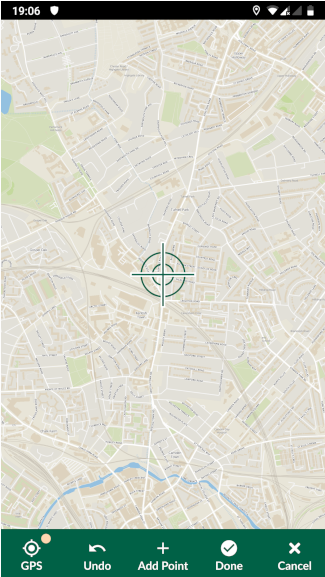
Capturing points
Our survey layer is a point layer, it will show a cross-hair at your GPS location.
11. Move the map to the parcel that you are observing and tap Add Point ![]() . The point
below the cross-hair will be used as the recorded location. You can move
back to your location if needed, by tapping GPS
. The point
below the cross-hair will be used as the recorded location. You can move
back to your location if needed, by tapping GPS ![]() . If needed you can switch to other Map themes to better orient yourself.
. If needed you can switch to other Map themes to better orient yourself.
Edit captured points
Synchronisation of data/ projects
Download the data into QGIS
Now we want to further process the data in QGIS.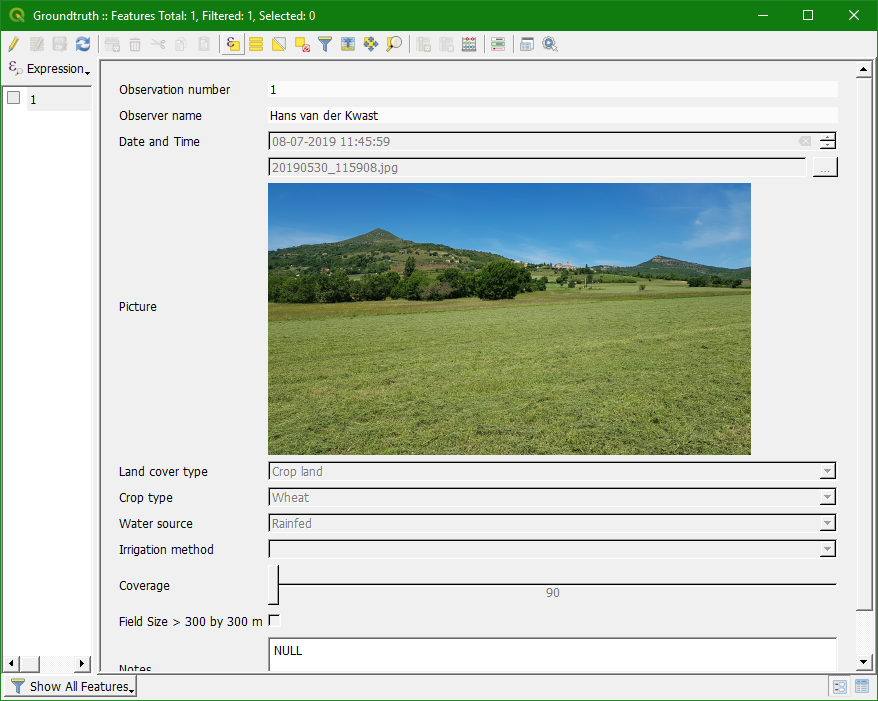
Capturing lines or areas
If your survey layer is a line or area, the panel at the bottom changes to a figure similar to the one below:
You can:
-
Use Add point
 to define the shape of your line or area manually by navigating through the map
 -
If you want to stream the GPS to shape your line or area, press and hold GPS button
 on the bottom left corner.
Once finished, press Done. If your feature is an area, it will join the last point to the first point to close the shape.