Tutorial - crop monitoring using vegetation indices
| Site: | OpenCourseWare for GIS |
| Course: | Processing drone images with WebODM |
| Book: | Tutorial - crop monitoring using vegetation indices |
| Printed by: | Guest user |
| Date: | Sunday, 26 July 2026, 12:31 PM |
Description
This tutorial takes you through different steps from extracting different vegetation indices from RGB drone images in WebODM to further analysis in QGIS.
1. Introduction
In this tutorial you'll learn how to create different indices in WebODM, download and analyse them in QGIS.
Pre-requisite
You must have followed the first WebODM tutorial.
Learning objectives
- Generate various Vegetation indices
- Visualize in the 2D map view of WebODM
- Adjust the color palette in WebODM
- Download the vegetation indices as GeoTiff
- Visualise the indices and clip to Maize field boundary in QGIS
- Produce histogram of these indices over two dates
- Calculate univariate statistics from these indices
2. Theory
Vegetation indices are widely used to understand the vegetation coverage in the study area. For applications related to precision agriculture, it gives information about crop health and growth parameters.
The most common vegetation index in Normalized Difference Vegetation Index which is computed using the Red and Near InfraRed (NIR) reflectance bands. The NDVI is computed using the following equation: NIR - Red/NIR + Red
However the drone flights we used for monitoring Maize field in Moatize has only RGB camera, which means there is NO NIR spectral images available for these flights dated 18/12/2019 and 22/01/2020.
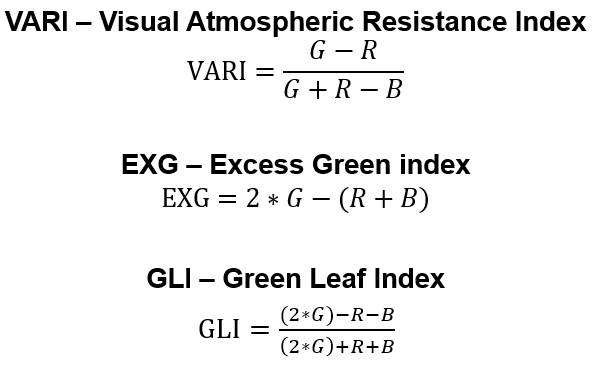
There are vegetation indices computed from Red, Green and Blue (RGB) bands. In this tutorial we will cover the following vegetation indices as shown in the below figure:
Read more about these indices in these papers:
VARI
Gitelson, A. A., Kaufman, Y. J., Stark, R., and Rundquist, D. (2002). Novel algorithms for remote estimation of vegetation fraction. Remote Sens. Environ. 80, 76–87. doi: 10.1016/S0034-4257(01)00289-9
EXG
Woebbecke, D. M., Meyer, G. E., VonBargen, K., and Mortensen, D. A. (1995). Color indices for weed identification under various soil, residue, and lighting conditions. Trans. ASAE 38, 259–269. doi: 10.13031/2013.27838
GLI
Louhaichi, M., Borman, M. M., and Johnson, D. E. (2001). Spatially located platform and aerial photography for documentation of grazing impacts on wheat. Geocarto Int. 16, 65–70. doi: 10.1080/10106040108542184
3. Vegetation Indices in WebODM
The main advantage of using WebODM is that, it comes with pre-defined vegetation indices which can be derived from multi-band ortho photo. In this tutorial you will generate the three vegetation Indices VARI, EXG and GLI in the WebODM interface.
Following sub-sections in this chapter takes you through following topics
3.1 Generate vegetation indices
3.2 Import Maize field boundary
3.1. Generate vegetation indices
1. Visualizing maps in WebODM
Once the processing of both date images (18/12/2019 and 22/01/2020) are finished the WebODM interface will look like the following screenshot:
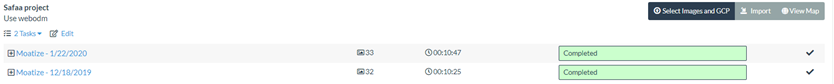
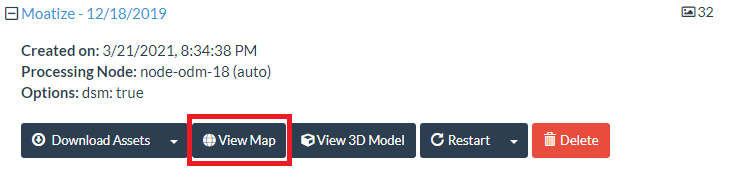
Now lets go to the task - "Moatize - 12/18/2019" and open the "View Map" to open the 2D map interface.
In the 2D map interface on the right top, you will see three tabs: "Orthophoto", "Plant Health" and "Surface Model". By default the interface opens with "Orthophoto" selected.
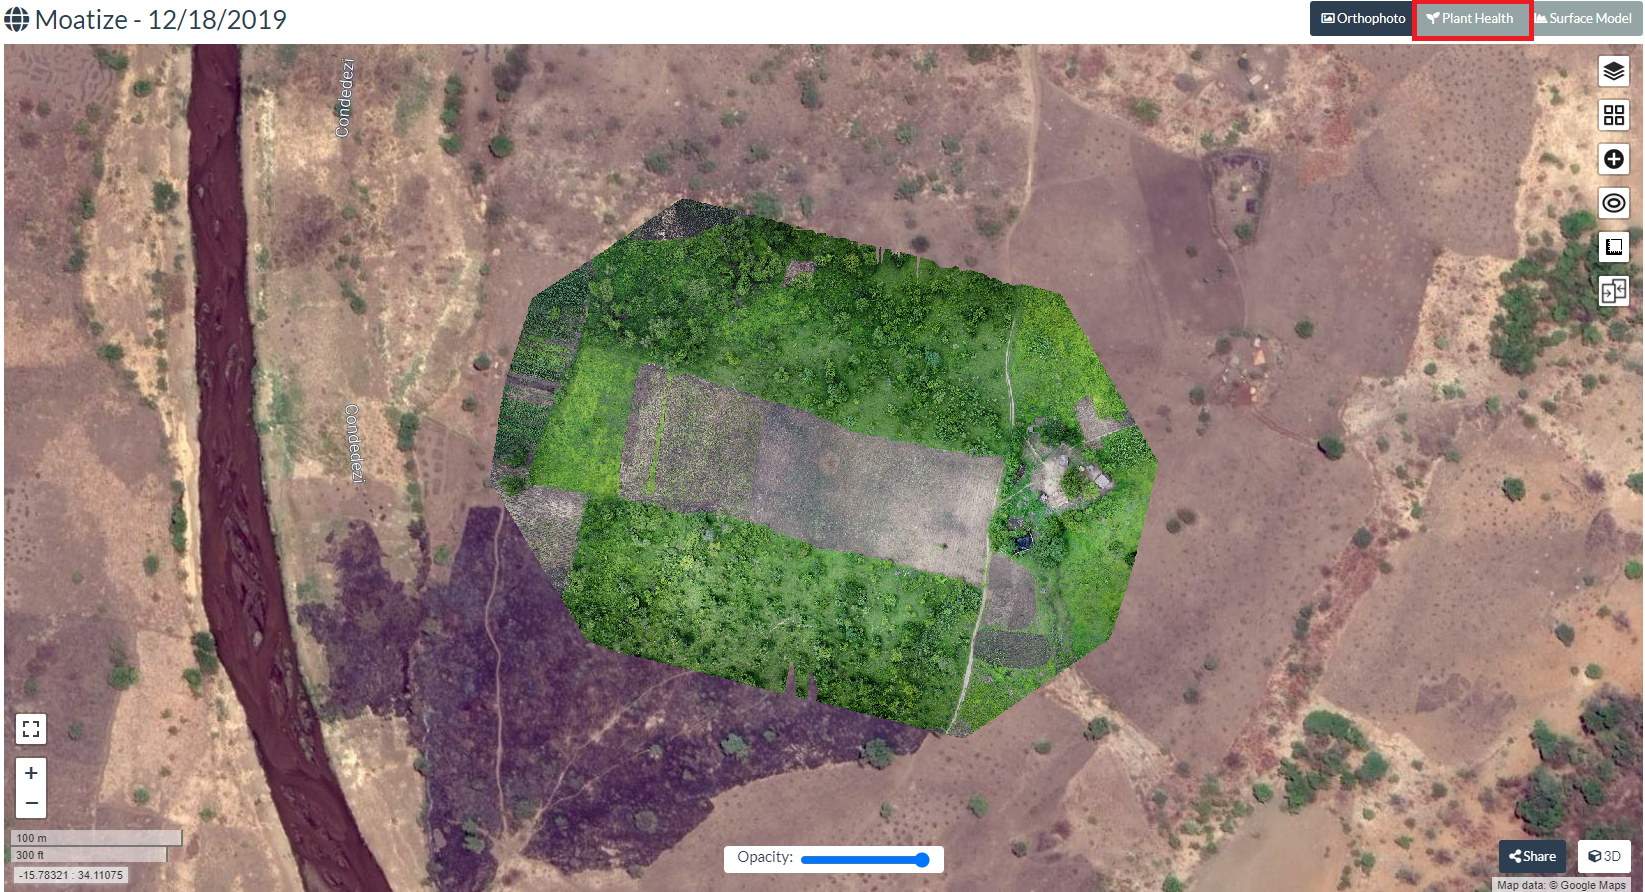
From the above window select "Plant Health" tab to generate various Vegetation indices.
2. Vegetation indices in WebODM
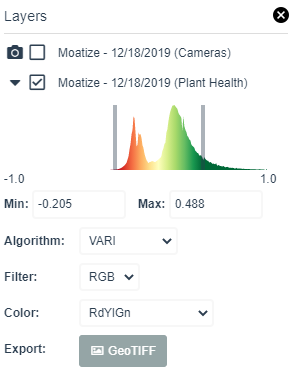
Once you select "Plant Health" you will see the below map which by default the NDVI index generated by WebODM. However as there is no NIR band let us explore other indices as explained before. Click on  icon for layer manager and also where you can select various indices.
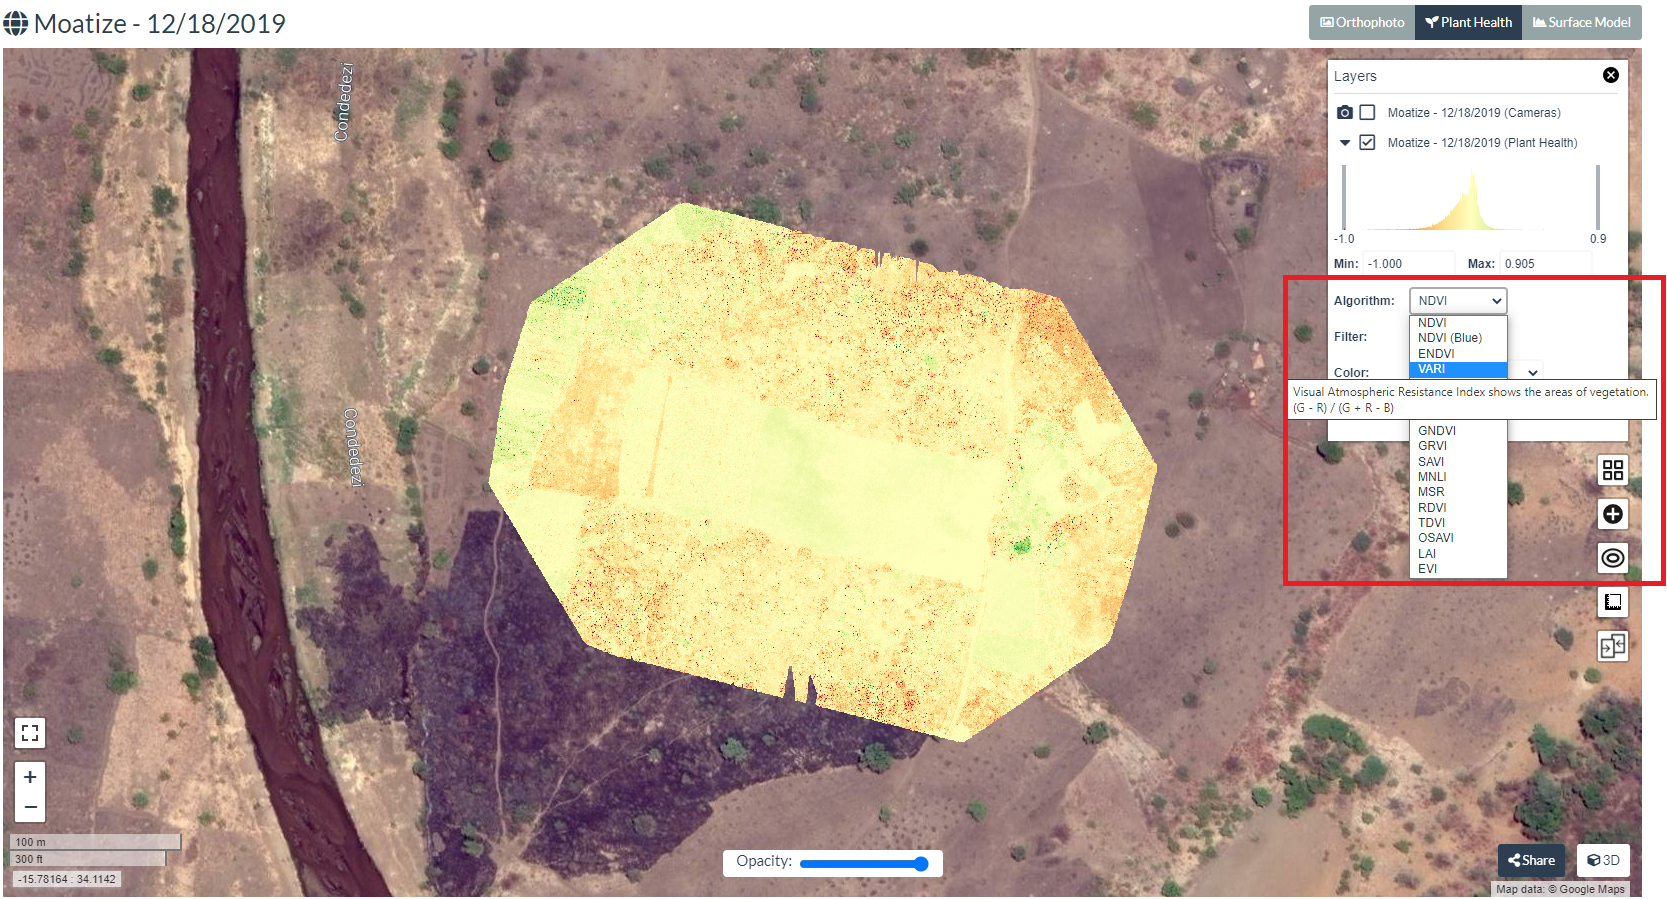
As shown in the above screenshot select the index from the drop down which will be generated and visualized in the map upon selection. Select VARI to generate and visualize this index. Note that as you hover the drop down the equation behind each index is displayed.
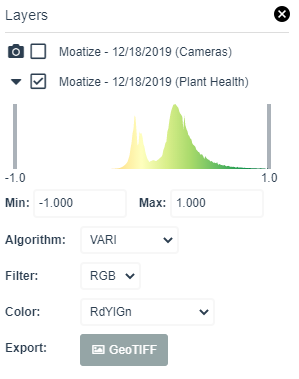
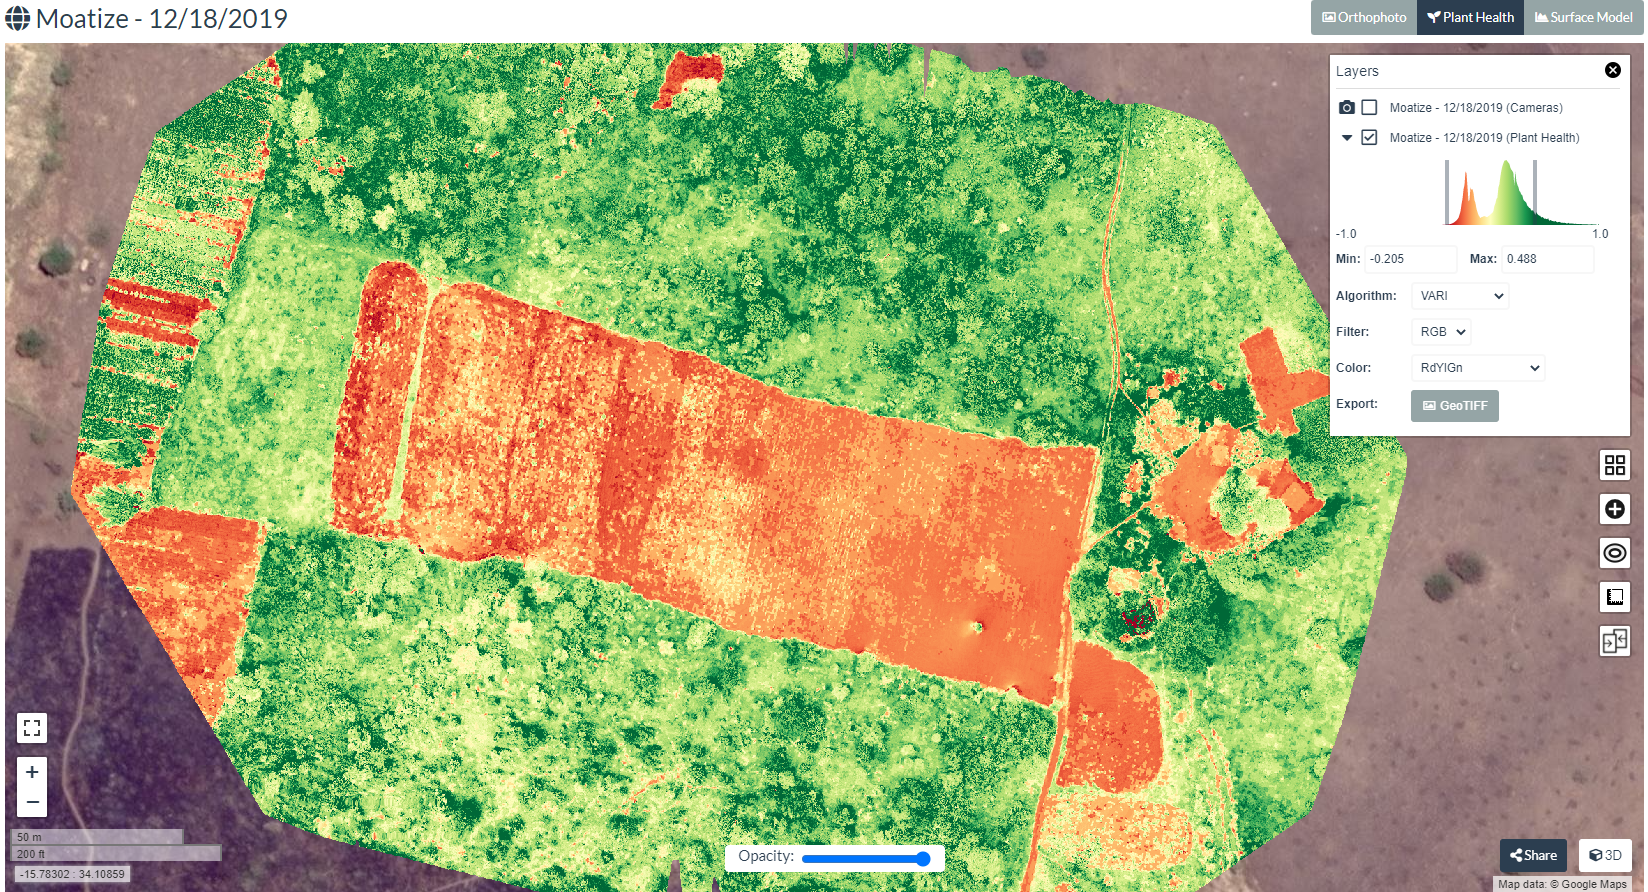
Adjust the color palette to increase the contrast to see the heterogeneity in the field. Adjust the two bars in the color histogram to stretch or sharpen the colors. Map after adjusting the color palette is shown below.
3.2. Import Maize field boundary
1. Import shapefile to WebODM
In webODM, it is possible to import the shapefile representing a boundary which will help us in focused analysis. In this case let us import the maize boundary which we will will further analyse in QGIS as well.
To import the shapfile:
- Prepare a zip file with the shape file(s) of the Maize boundary. You can download it from here.
- Upload the zip file using the
 icon on the right side of the interface
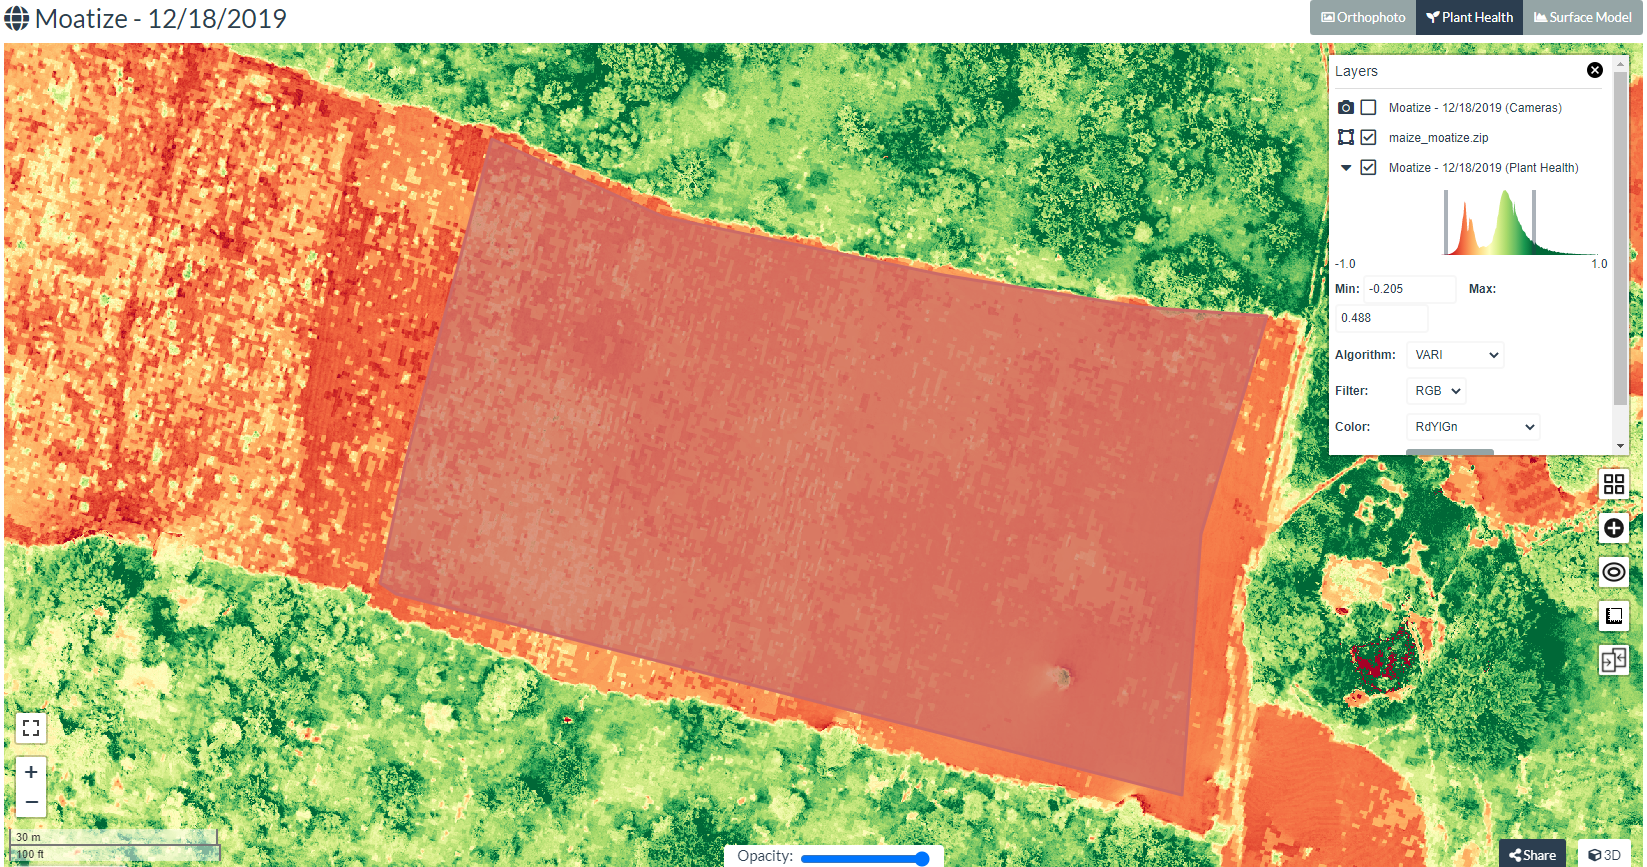
The below screenshot shows imported maize boundary over VARI.
2. Download the vegetation index - VARI as GeoTIFF, for further analysis in QGIS
Click on the Export: ![]() button in the layer manager to save as geotiff into your local drive. Note the folder where you are saving the geotiff file.
button in the layer manager to save as geotiff into your local drive. Note the folder where you are saving the geotiff file.
- Generate the two other indices EXG and GLI for the date 18/12/2019
- Download these two indices as geotiff files
4. Analyzing vegetation index in QGIS
Once you have the vegetation indices downloaded from WebODM, we can perform further analysis in QGIS to understand the vegetation status in the Maize field.
Following sub-sections in this chapter takes you through following topics
4.1 Clip the vegetation index
4.2 Histogram and univariate statistics
4.1. Clip the vegetation index
1. Visualize VARI geotiff raster image in QGIS
Open "QGIS with GRASS GIS" by clicking on the following logo in the programs.
![]() (Note that the following steps should work other QGIS versions as well (greater than version 3.12)
(Note that the following steps should work other QGIS versions as well (greater than version 3.12)
Once the QGIS is open, start a "New Empty Project"
"Open Data Source Manager" in QGIS using the  icon
icon
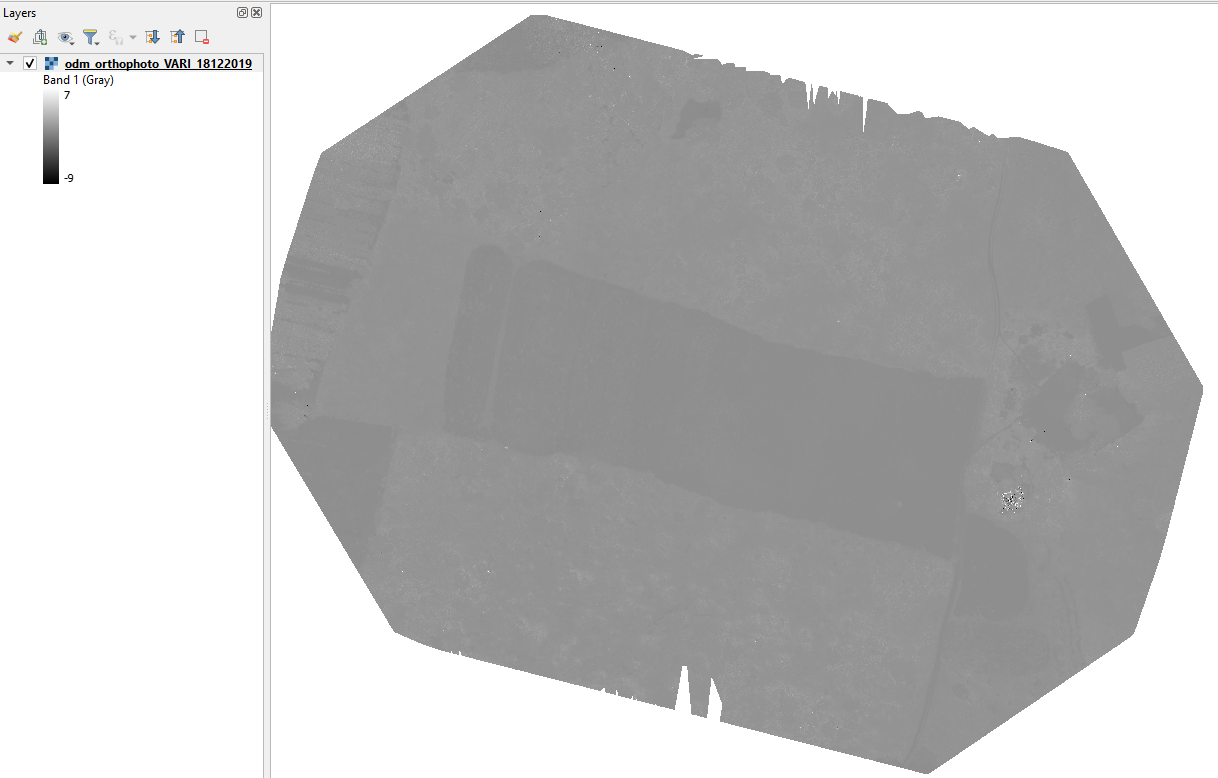
Select  on the left side and browse to the folder where the VARI GeoTIFF file is saved, click "Add" to see the VARI image in Map view in QGIS.
The VARI image will appear in gray scale as shown below:
Change the styling:
- Right click on the VARI image in the Layer manager and select properties.
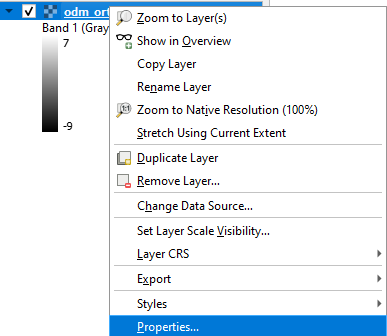
- In the properties panel select "Symbology" tab on left side. Select Render type as "Singleband pseudocolor". Change the Min and Mac values to -0.2 and 0.5. Select the color ramp you prefer and click on "Classify" to set values to palette. Once the settings are done, click on "Apply"
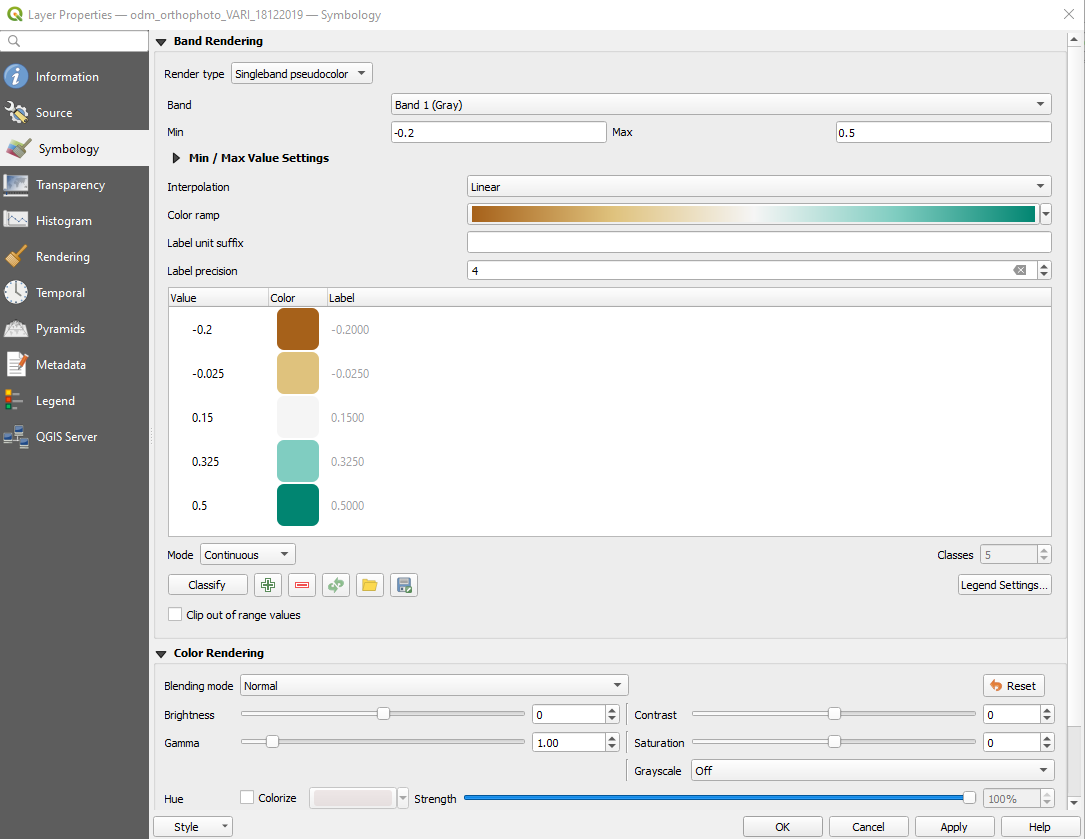
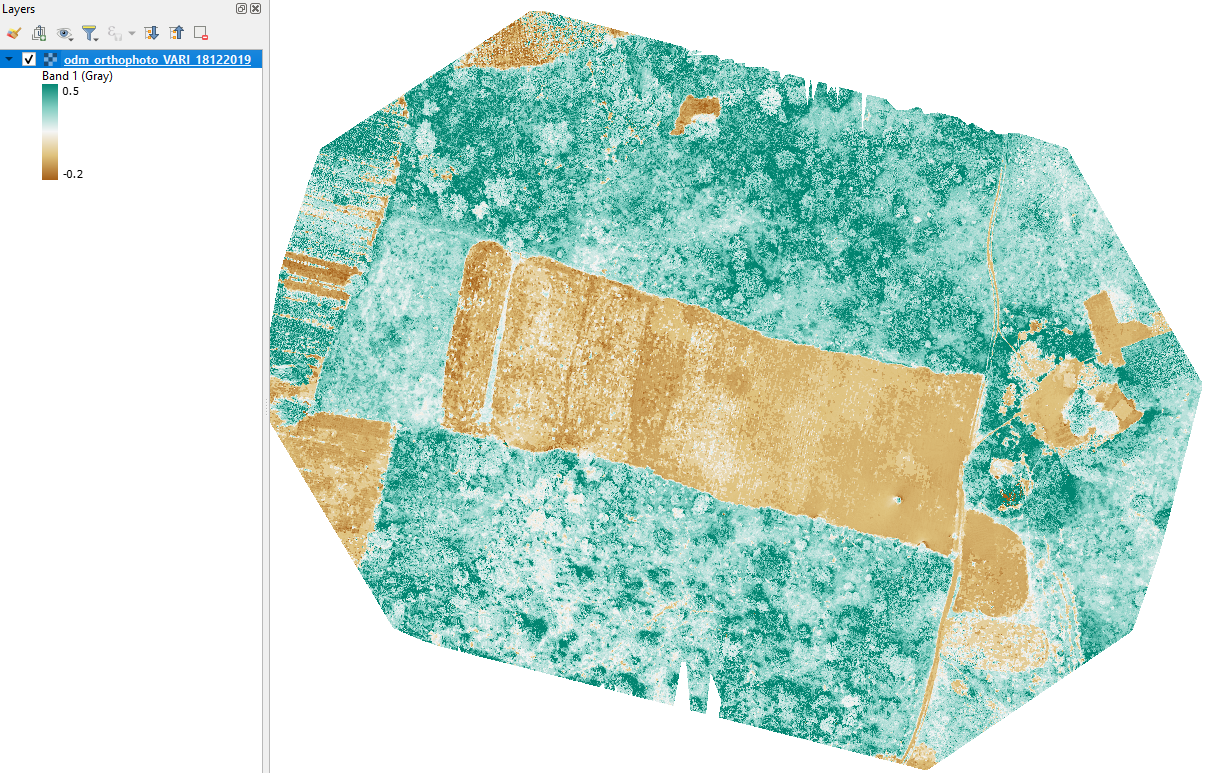
Here is the VARI map after applying the symbology:
2. Clip VARI to Maize field
Next step would be to clip the VARI image to Maize field boundary. Follow the steps explained in video below:
3. Your tasks
Perform these steps for EXG and GLI indices for the date 18/12/2019
4.2. Histogram and univariate statistics
1. Watch the below video for steps to compute histogram and univariate statistics.
2. Your tasks
Follow the above steps for EXG and GLI to compute histogram and statistics.
4.3. Comparing vegetation index from two dates
In this section watch below video to see some tips and tricks to compare VARI from two dates. The same steps can be taken for other indices too.
Check out the previous tutorial to see installation of Map Swipe Tool plugin in QGIS.