Create Your Own Processing Tools in QGIS
| Site: | OpenCourseWare for GIS |
| Course: | FOSS4G 2022 Workshop Hydrological analysis with PCRaster in QGIS and Python |
| Book: | Create Your Own Processing Tools in QGIS |
| Printed by: | Guest user |
| Date: | Friday, 10 July 2026, 4:14 AM |
1. Introduction
Now you've learned how to create PCRaster Python scripts, you can also create your own PyQGIS scripts that you can add to the QGIS Processing Toolbox.
In this tutorial you'll learn to:
- Download example scripts with the QGIS Resource Sharing plugin
- Create your own PyQGIS script based on an example
- Debug scripts
- Submit scripts to the PCRaster QGIS Resource Sharing repository
2. Download PCRaster PyQGIS Scripts
The best way to start making your own PCRaster PyQGIS scripts is by editing an existing one. You can download existing scripts from the PCRaster QGIS Resource Sharing repository.
1. Start QGIS Desktop.
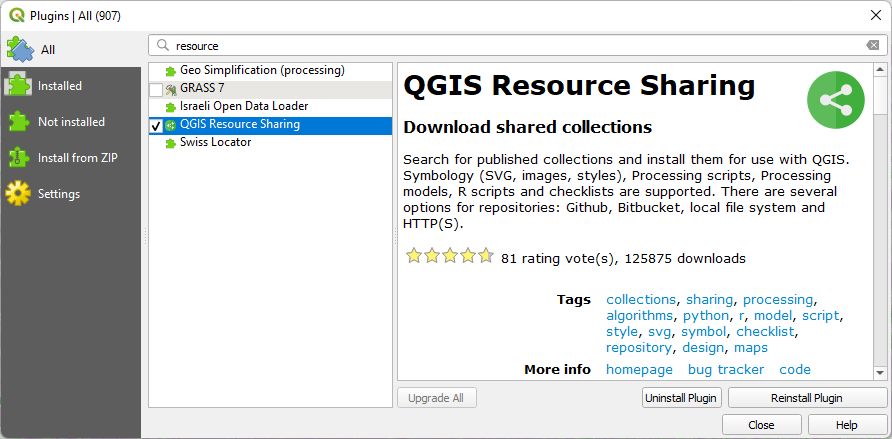
2. Install the QGIS Resource Sharing plugin from the Plugins manager.
3. Click the  icon that has been added to the toolbar.
4. In the QGIS Resource Sharing dialog, go to the Settings tab.
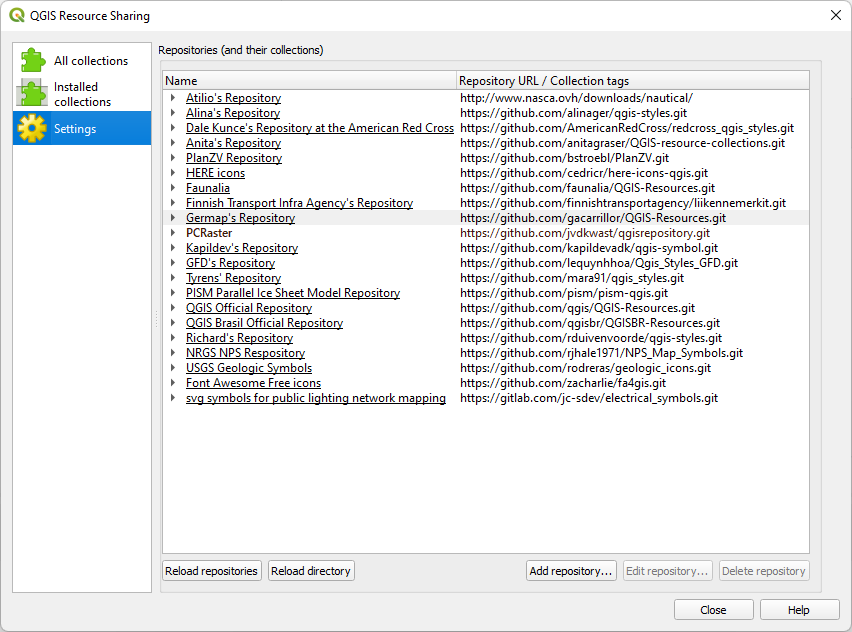
5. Click Add repository....
6. In the Repository Details type PCRaster at Name and paste this URL: https://github.com/jvdkwast/qgisrepository.git.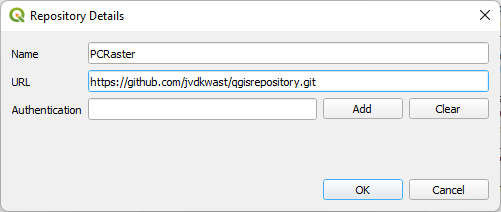
7. Click OK.
8. Go to the All collections tab and Install the QGIS PCRaster user script collection (PCRaster).
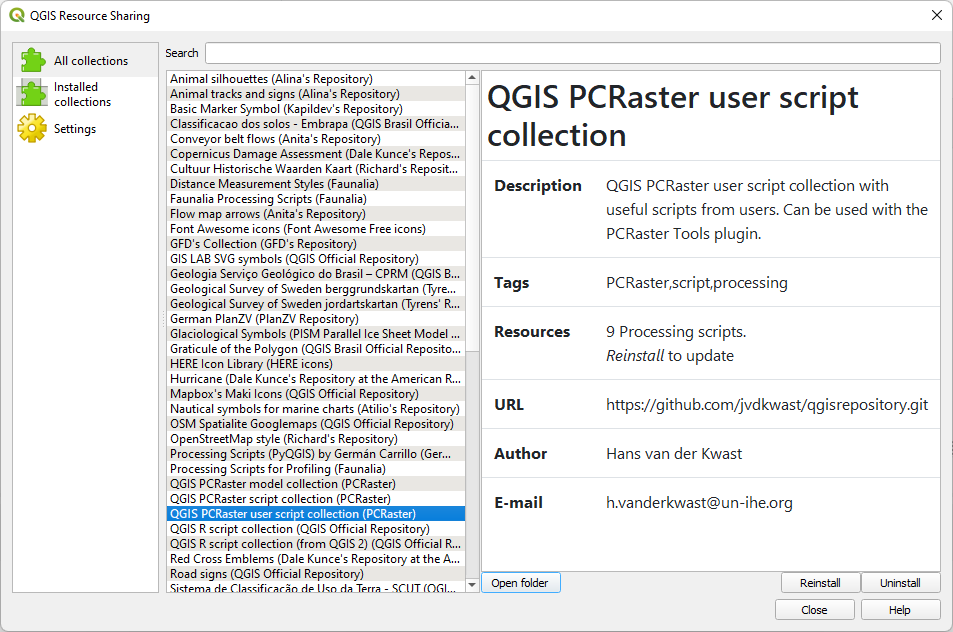
A popup indicates how many processing scripts have been added to the Processing Toolbox.
9. Close the dialogs.
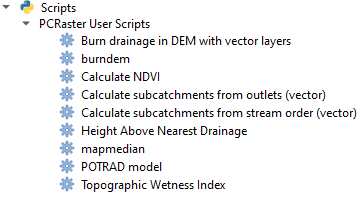
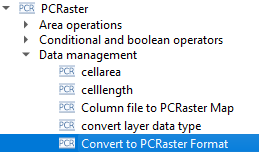
10. Go to the Processing Toolbox and expand the Scripts | PCRaster User Scripts sections to see the added tools.
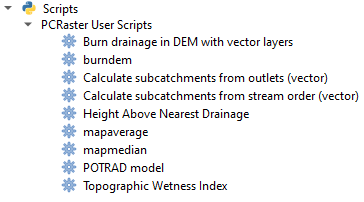
Next, we're going to edit an existing script to create our own tool.
3. Edit an existing tool
The PCRaster User Scripts that have now been added to your Processing Toolbox can be edited. We can use one as an example and modify it for our own tool.
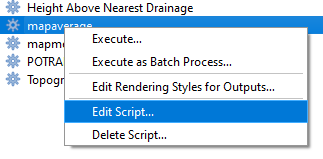
An easy one to modify is the mapaverage tool.
1. Right-click on the mapaverage tool and choose Edit Script... from the context menu.
Let's modify the script so it will calculate the Normalized Difference Vegetation Index from two raster layers.
The equation for NDVI is:
NDVI = (NIR - Red) / (NIR + Red)
Where:
NIR = near infrared band
Red = red band
It results in a raster with values between -1 and 1. Cells larger than 0 represent increasing biomass.
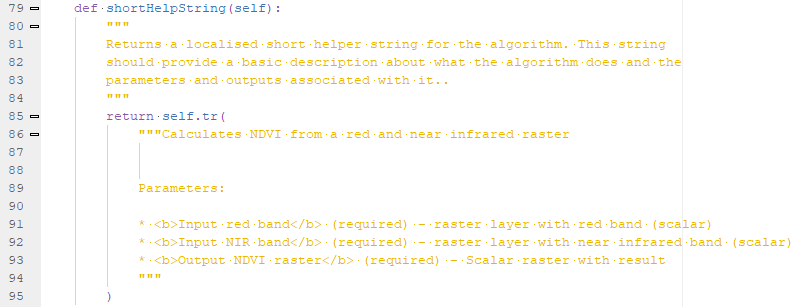
It is good practice to only import the functions that you need. Here we can delete many from the example.
2. Edit the functions that need from PCRaster so that we only have readmap, setclone and report.
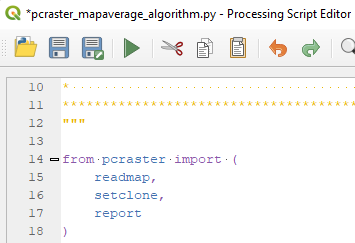
- readmap is to read the rasters from disk with the path provided by the user.
- setclone is to make sure that all rasters have the same dimensions for map algebra. We'll set the clone to the first raster that is loaded.
- report is needed to write the result of the calculation to disk, using the path provided by the user.
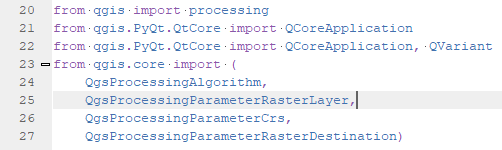
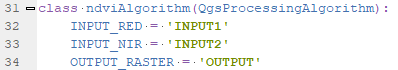
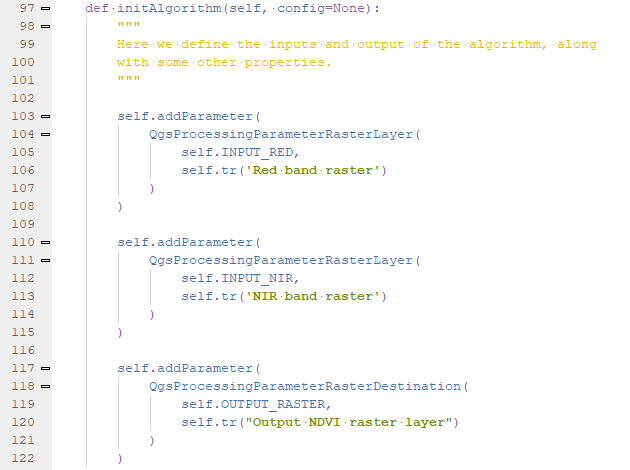
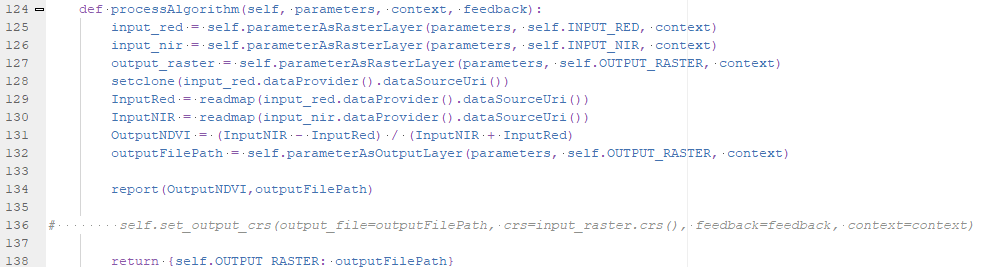
- self.parameterAsRasterLayer(parameters, self.INPUT_RED, context) reads the raster layer information for the red band selected by the user and this goes into the input_red variable.
- Same is done for input_nir in line 126 and the output_raster in line 127.
- In line 128 we use the PCRaster setclone function to set the clone/mask for the map algebra calculations to the properties of the the first raster (input_red). setclone needs the path to the raster., which is the string returned by input_red.dataProvider().dataSourceUri().
- In lines 129 and 130 we read the red and NIR band repectively from disk, using the readmap function and the path (same method as in line 128 to get the path). The variables InputRed and InputNIR are now the PCRaster maps that we can use in the calculation.
- In line 131 we calculate NDVI and store the PCRaster map in the variable OutputNDVI.
- In line 132 we assign the path of the output file, as defined in the dialog by the user, to the variable outputFilePath.
- In line 134 the result is written to disk using the PCRaster report function that needs the name of the variable and the path of the output file.
- Line 138 returns the result dictionary entry so it is opened in the QGIS map canvas.
 button an save it as pcraster_ndvi.py in the profile folder. Make sure you're not overwriting the mapaverage script!
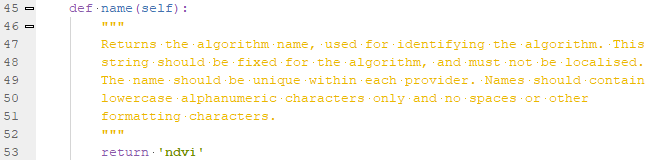
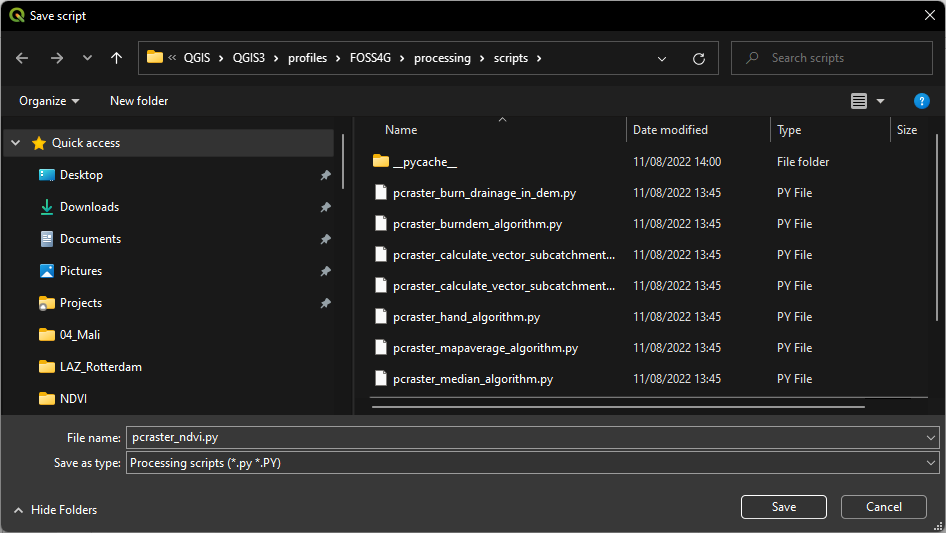
4. Debug Python errors
Now double click on your new tool to see the dialog.
If it shows up without an error, you've done well!
However, if you don't see the dialog, but:
![]()
There is a syntax error somewhere in your script.
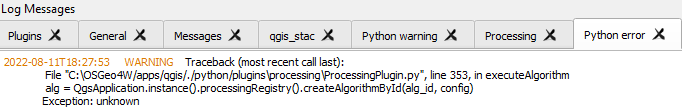
In that case, click View message log.
It opens the Log Messages panel.
Go to the Python Error tab to find out where and why the error occurs.
After the errors have been fixed, we're going to test the new tool with data.
5. Test the NDVI Tool
Now we're ready to test the new NDVI tool.
First we need to download the red and near infrared band from a satellite sensor.
We can do that in different ways, but here we'll use the STAC API Browser plugin and download Sentinel 2A bands for Florence, Italy.
Let's get the extent of Florence in the map canvas.
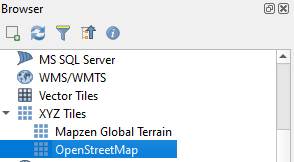
1. Go to the Browser panel, expand XYZ Tiles and drag the OpenStreetMap layer to the map canvas.
2. In the Locator Bar in the lower left of the screen type
> Florence
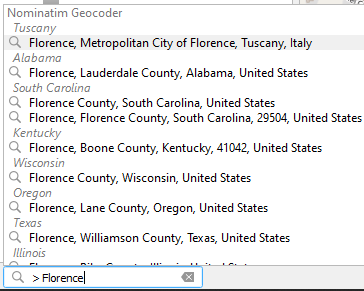
The Locator Bar uses the Nominatim Geocoder to search for the location of Florence.
3. Choose the first option. QGIS will zoom to the location.
Now let's use the STAC API Browser plugin to find a recent Sentinel 2A image.
4. Install the STAC API Browser plugin from the Plugins Manager.
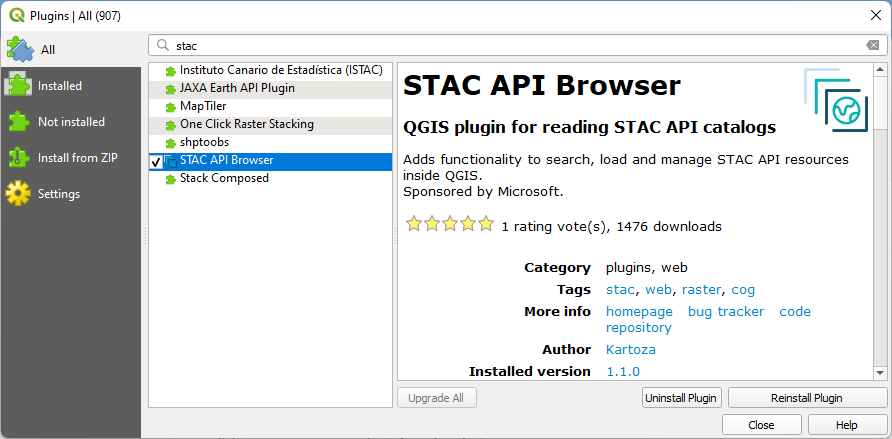
5. After installing, click the Open STAC API Browser  button that has been added to the Toolbar.
6. In the Search tab, choose Microsoft Planteray Computer STAC API under Connections.
7. Click Fetch collections.
8. Select Sentinel-2 Level-2A.
9. Expand the Filter by date section, check the box and select a recent date range.
10. Expand Extent section and click Map Canvas Extent.
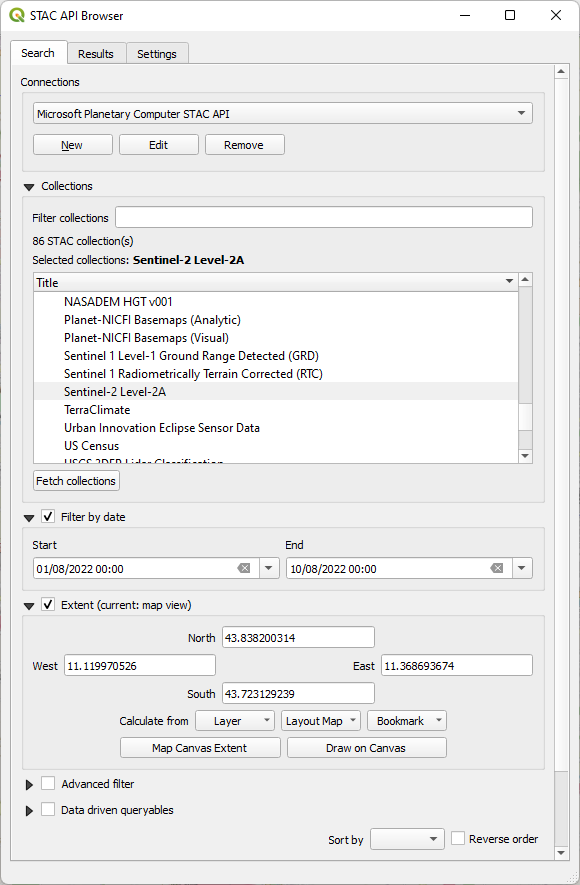
11. Scroll down and click Search.
The results will be shown under the Results tab:
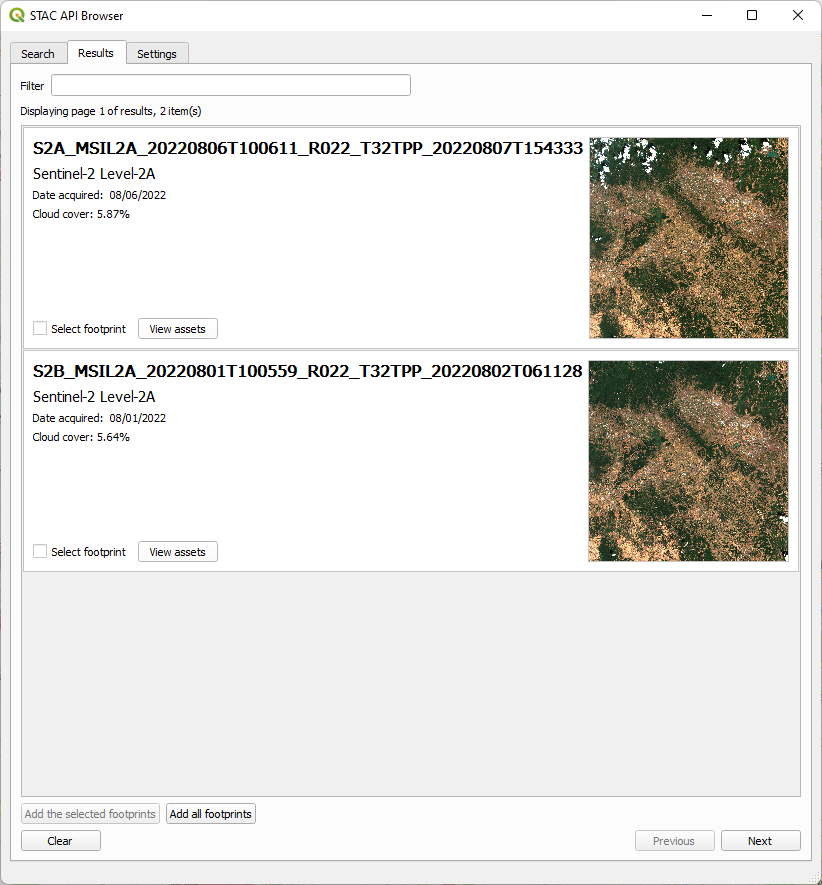
12. Click View assets of the result that you want to use.
13. For Band 4 (Red) and Band 8 (NIR) check the box to Select to add as layer.
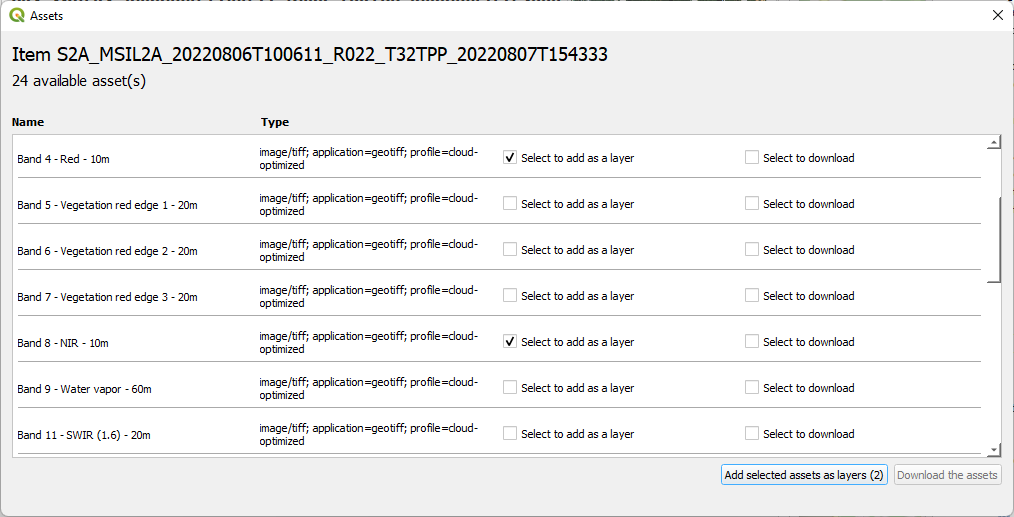
14. Click Add selected assets as layers to add them to the map canvas.
15. Close the dialogs.
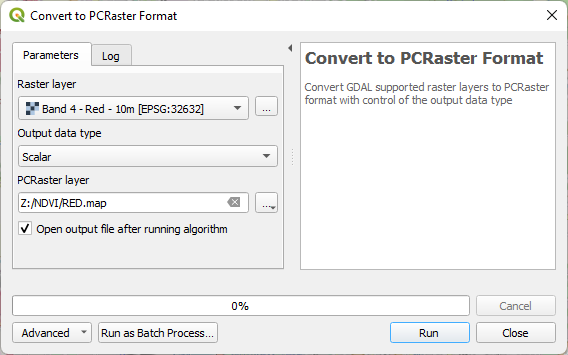
16. Use the Convert to PCRaster Format tool to convert both layers to scalar rasters.
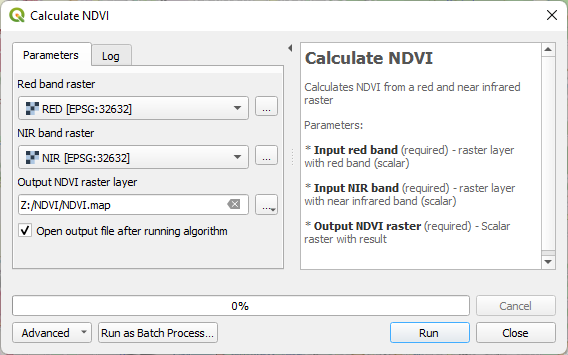
17. Run the Calculate NDVI tool with the two PCRaster scalar layers.
The output ends up somewhere in the ocean (aka NULL island), because PCRaster doesn't store projection information.
18. Click  to set the CRS to same projection as the Sentinel 2 rasters.
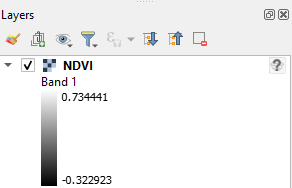
19. In the Layers panel, right-click on the NDVI layer and choose Zoom to layer(s) from the context menu. Check if the raster shows up at the correct location.
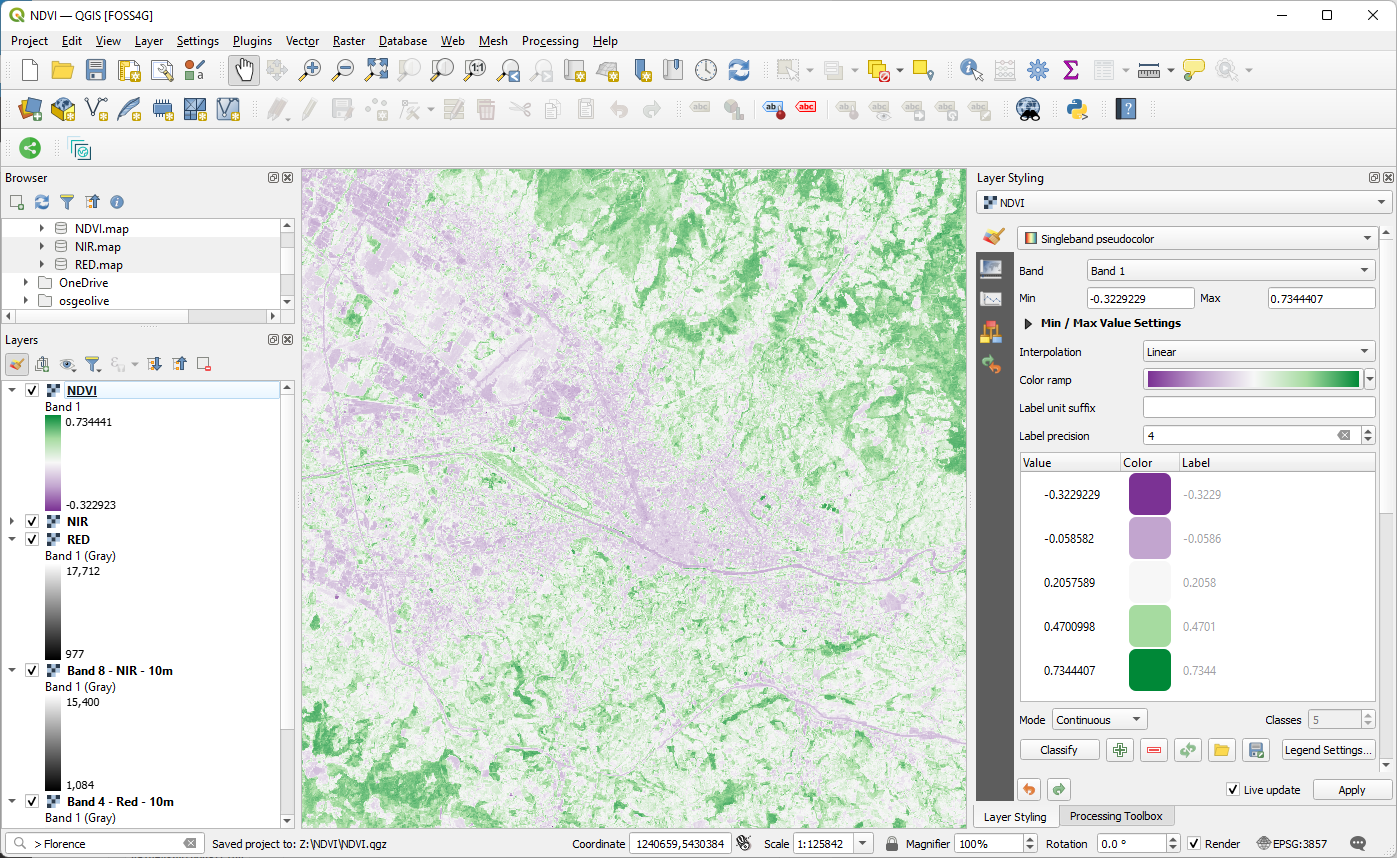
20. Style the raster with a color ramp that reflects well the NDVI values.
Next you'll learn how to share your tool.
6. Share your tool with other users
You can now share your new tool with other users through the PCRaster QGIS Resource Sharing repository.
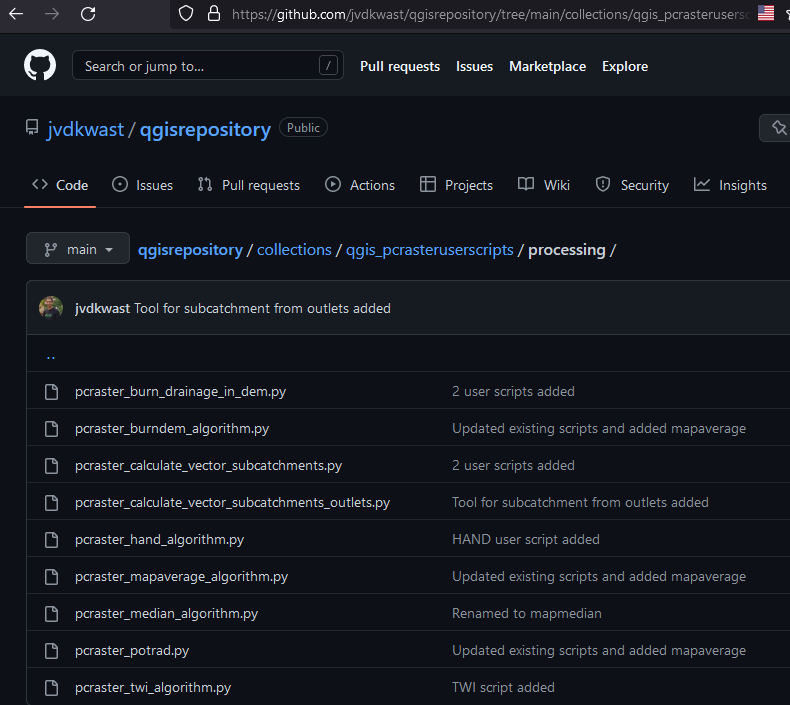
1. In the web browser, go to the PCRaster QGIS Resource Sharing repository: https://github.com/jvdkwast/qgisrepository.
2. Go to the folder collections/qgis_pcrasteruserscripts/processing.
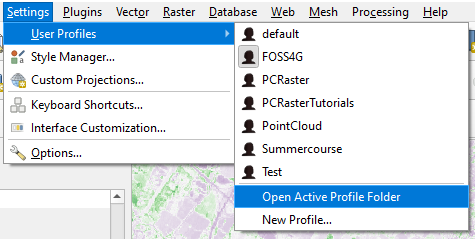
2. In QGIS locate the folder where the script is stored. In the main menu go to Settings | User Profiles | Open Active Profile Folder.
3. Drag the Python script from the local folder to the GitHub folder. You might need to do this twice to add the file and see this:
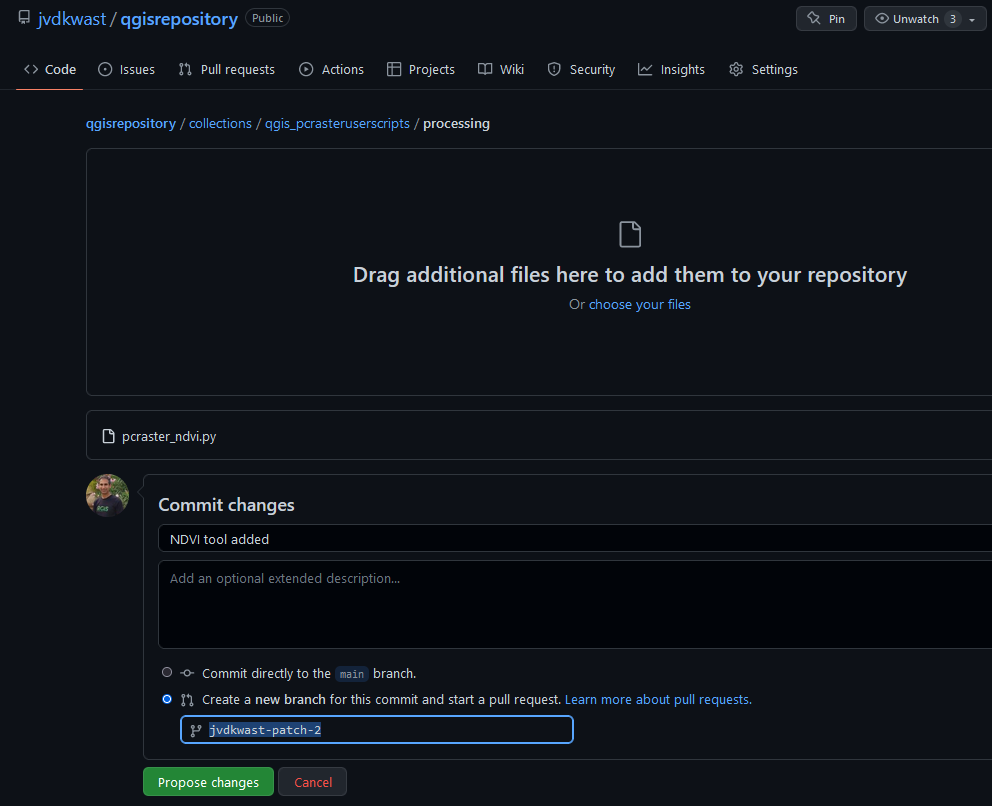
4. Type some comments on what you're submitting and select to create a pull request.
5. Click Propose changes and the script will be added after a review.
Other users can now find the script through the QGIS Resource Sharing plugin.