Tutorial: Stream and Catchment Delineation
6. Fill Sinks and Calculate Flow Direction
6.5. Styling the Flow Direction Layer using Arrows
We can further improve the styling of the flowdirection layer by adding arrows. This can be done using the mesh styling functionality of QGIS. To use that functionality, we need to convert the PCRaster LDD to a mesh format. We can do that with the Crayfish plugin.
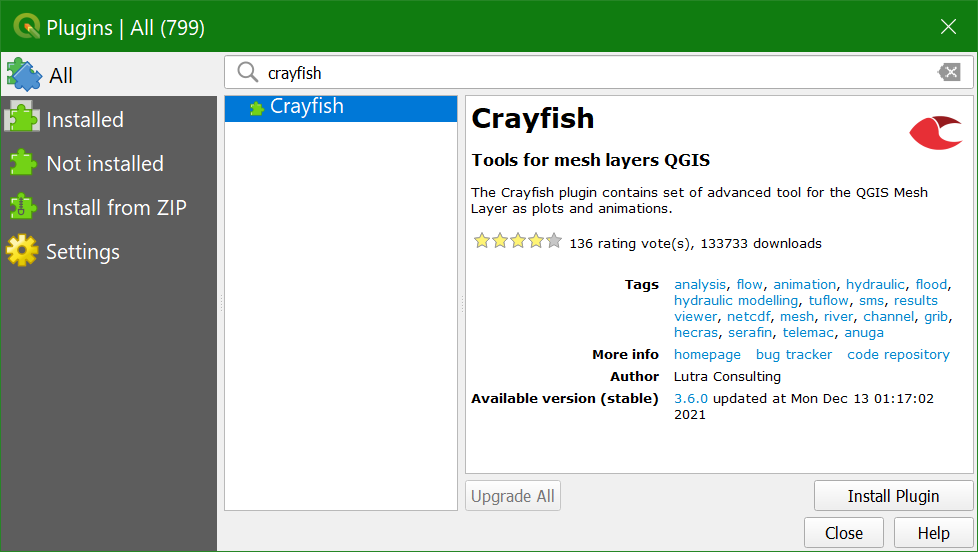
1. Install the Crayfish plugin from the Plugins Manager.
2. In the Processing Toolbox, go to Crayfish | Conversions | PCRaster LDD to GRIB.
3. In the PCRaster LDD to GRIB dialog, choose flowdirection as Input raster and flowdirmesh.grb as Output file (GRIB).
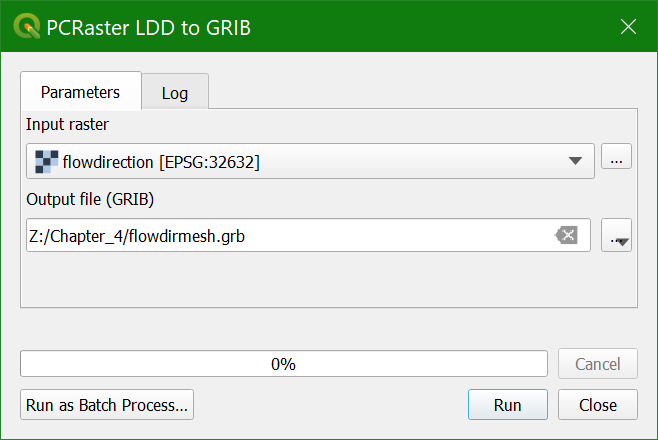
4. Click Run and Close to close the dialog.
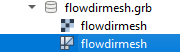
5. In the Browser panel, expand the flowdirmesh.grb group (you might need to refresh the Browser panel with the ![]() button) and drag the flowdirmesh layer with the mesh icon
button) and drag the flowdirmesh layer with the mesh icon ![]() to the map canvas.
to the map canvas.
This might take some time. If the file is too large for your computer’s memory, you can get errors. In that case, you can clip the flowdirection layer to a smaller area and repeat the steps to convert the file to the mesh format.
When the map canvas shows a completely yellow layer, the flowdirmesh layer has been loaded and we can start styling it.
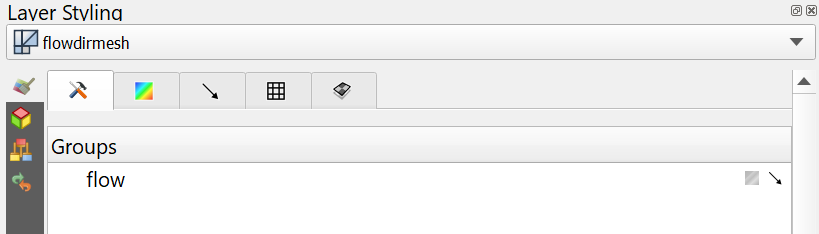
6. Select the flowdirmesh layer in the Layers panel and open the Layer Styling panel.
7. In the Layer Styling panel, go to the Datasets tab and click on ![]() to disable contours and click on the arrow to enable vectors. You might need to increase the size of your Layer Styling panel to see these icons.
to disable contours and click on the arrow to enable vectors. You might need to increase the size of your Layer Styling panel to see these icons.
Due to a bug, the yellow contours are still visible. You can hide these with the following work around: click again on the ![]() icon, but now go to the countours
icon, but now go to the countours ![]() tab and set the Opacity to 0.
tab and set the Opacity to 0.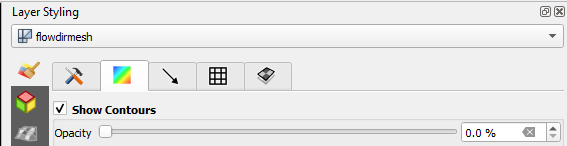
Now so many arrows are drawn in the map canvas that it turns black. Let’s tune the settings to improve this.
8. Go to the Vectors  tab and change the Arrow Length settings to Fixed and the Length to 2.00. Change the Color to dark blue.
9. Zoom in to see the flow direction with arrows.
10. Check the box to Display on User Grid to show the arrows fixed to a grid, e.g. with an X and Y Spacing of 10 px.
The settings are depending on your zoom level. Play with the settings to get a nice result. You can also try the other Symbology settings for visualization as Streamlines and Traces.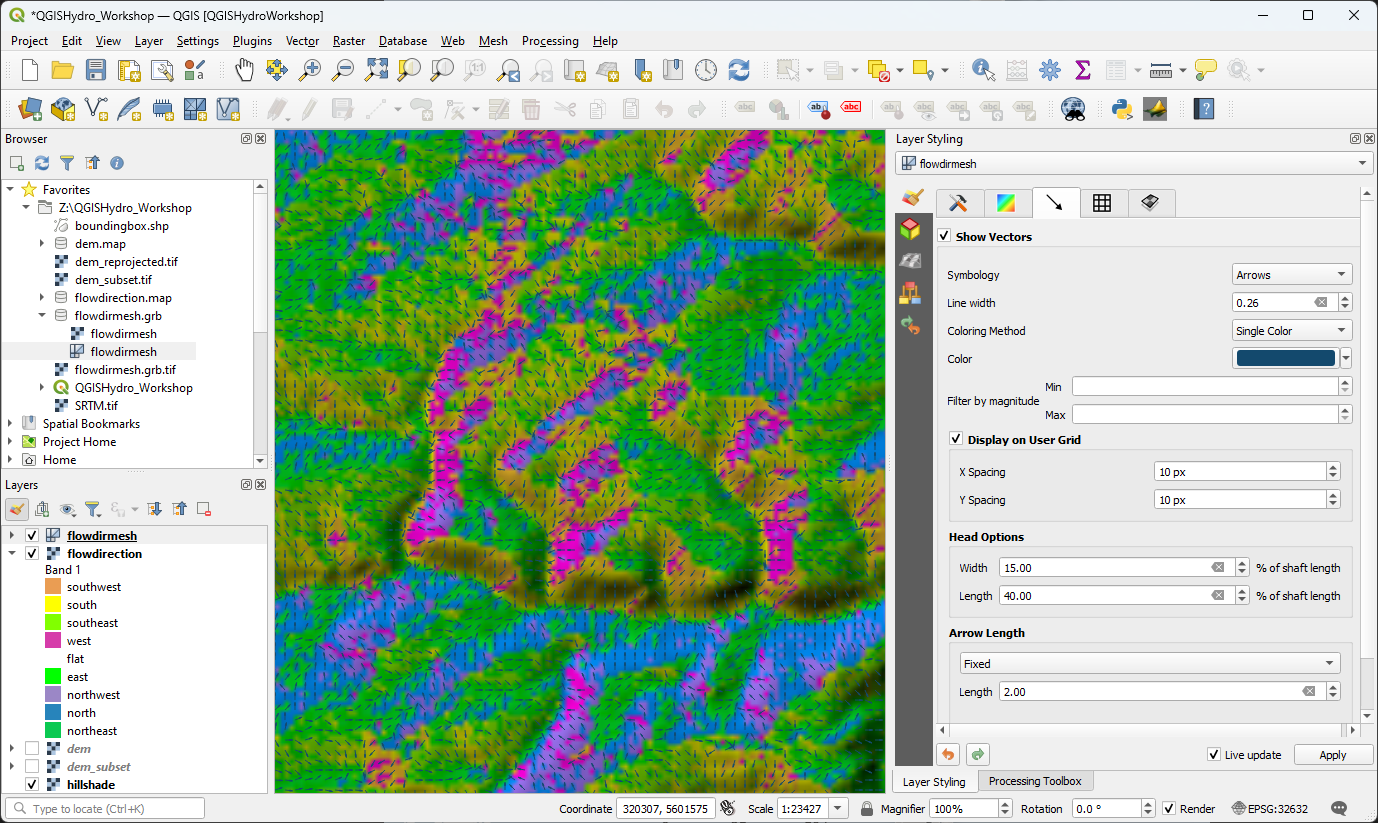
Watch this video to check the steps until this point: