Tutorial: WebODM
12. Use the results in QGIS
12.1. View results in QGIS in 2D
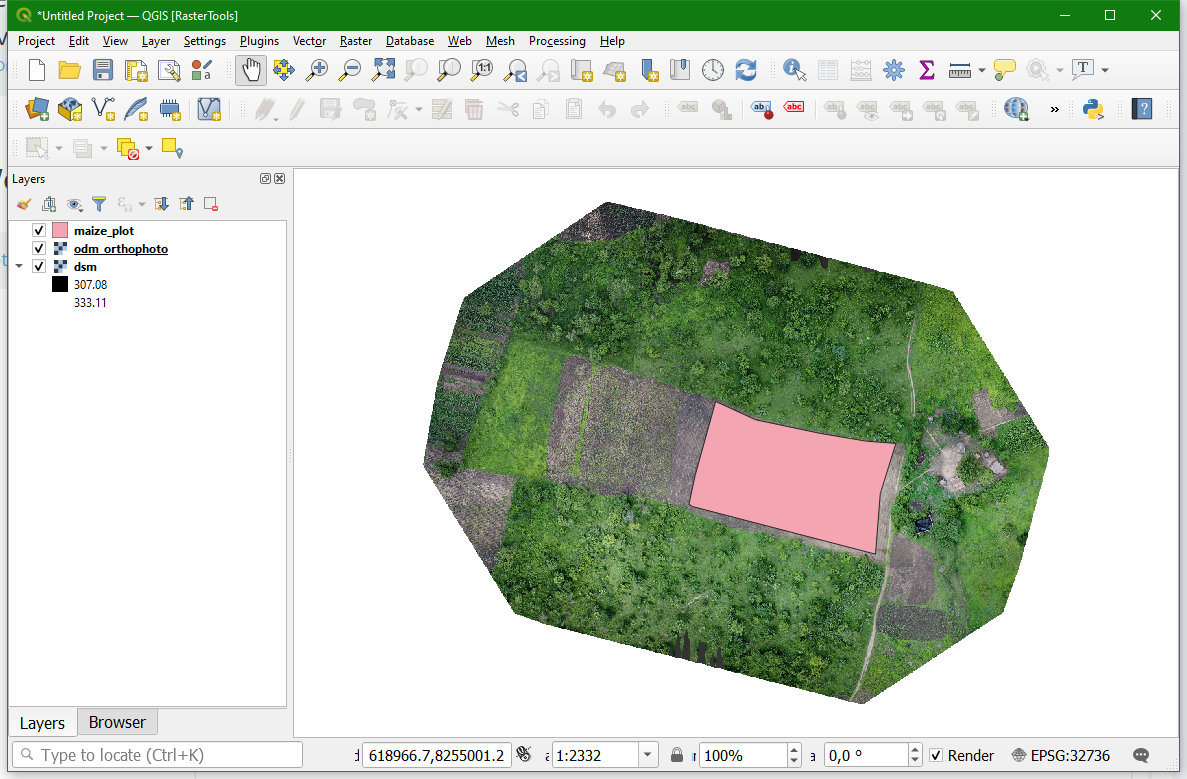
Let's visualise our orthophoto and Digital Surface Model in QGIS.
1. Start QGIS Desktop
2. Add odm_orthophoto.tif, dsm.tif and maize_plot.shp to the map canvas
Let's also add a backdrop to see more context around our study area. We're going to install the QuickMapServices plugin.
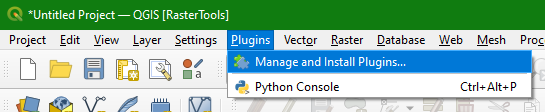
3. In the main menu go to Plugins | Manage and Install Plugins...
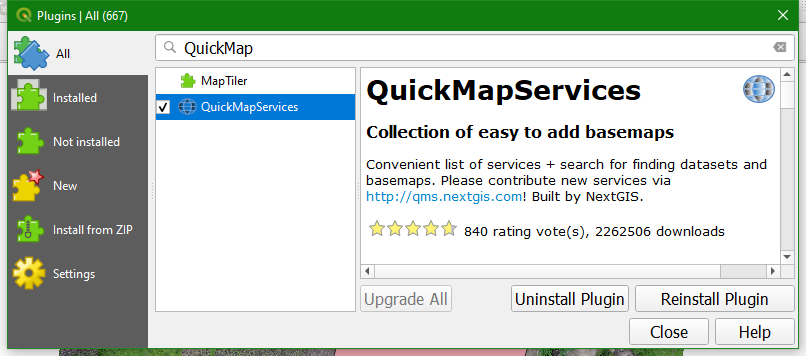
4. Install the QuickMapServices Plugin
5. In the main menu go to Web | QuickMapServices | Settings
6. Go to the More services tab
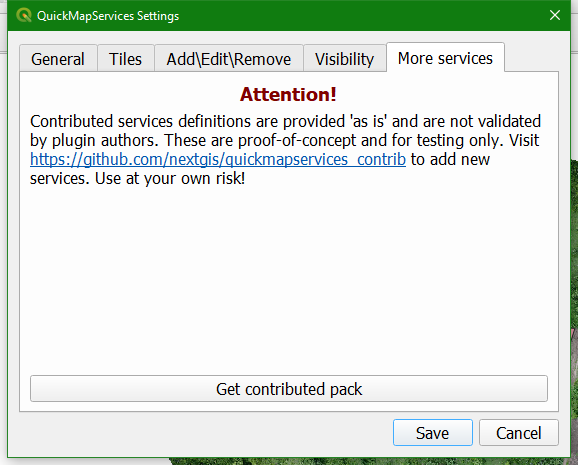
7. Click Get contributed pack
8. Click Save
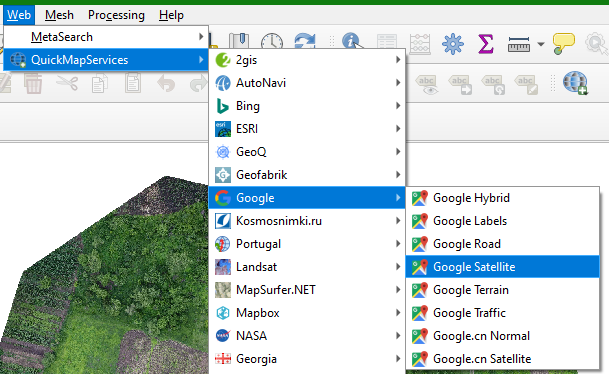
9. In the main menu go to Web | QuickMapServices | Google | Google Satellite
10. In the same way also add the Bing Satellite layer and compare the orthophoto with both satellite images.
- What is the projection of the products created in WebODM?
- What is the spatial resolution of the products?
11. Now you can also add the contour lines from section 9.3 from the GeoPackage to the map canvas.
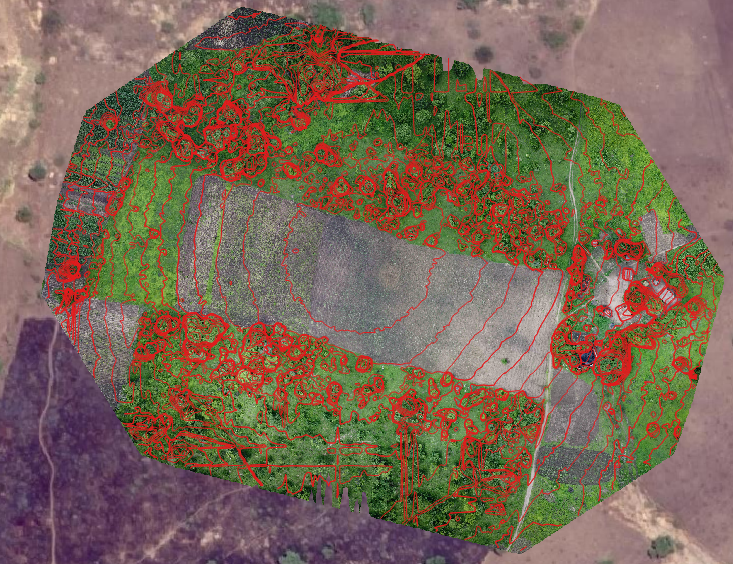
In the next section we'll have a closer look at the DSM.