Tutorial Zonal Statistics and Area Computations
6. Area computations with discrete rasters
6.1. Raster layer unique values report
Let's first reorganise our layers so we can work on the ones that we need for this part of the tutorial.
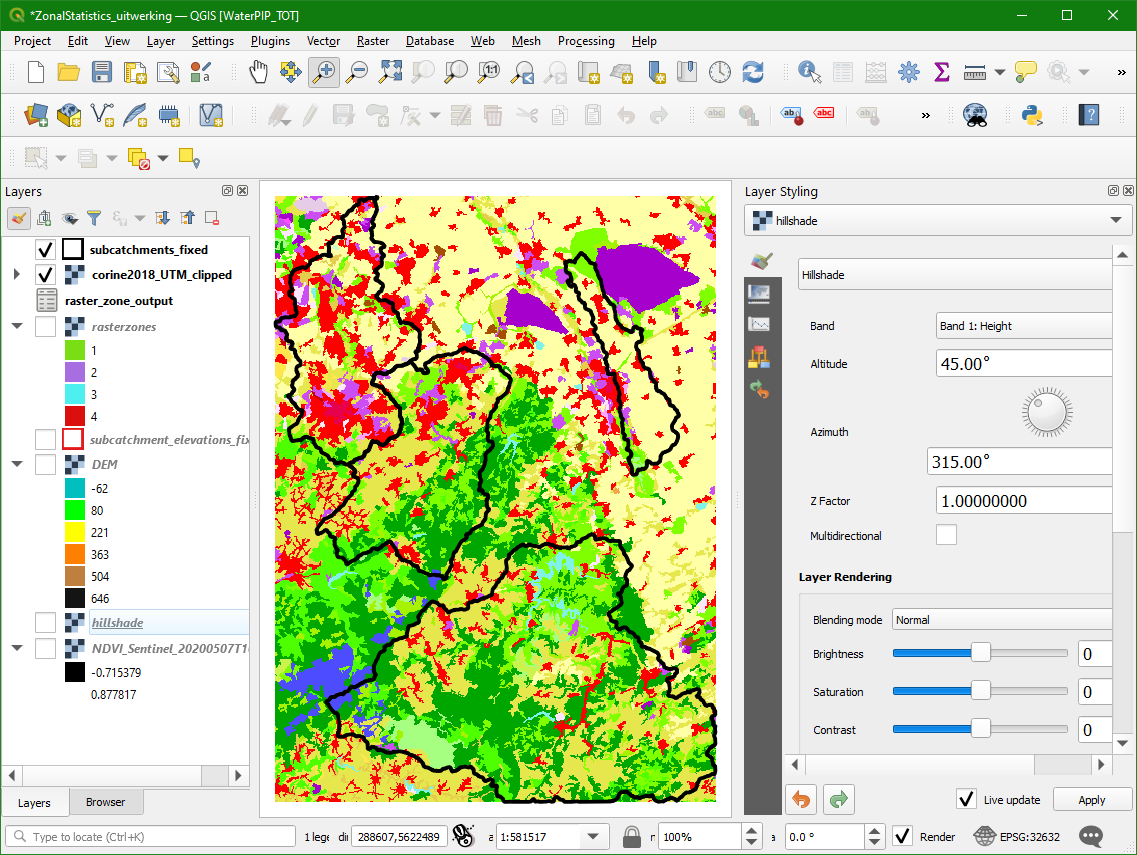
1. Move the subcatchments_fixed layer to the top and move the corine2018_UTM_clipped layer to the second position from the top.
2. Change the line colour of the subcatchments_fixed layer to black to make it more visible. Hide the other layers below.
Your screen should now look like this.
Now we're ready for the area analysis.
3. In the Processing Toolbox choose Raster analysis | Raster layer unique values report.

4. In the dialogue choose corine2018_UTM_clipped as Input layer.
5. We can generate a report in HTML format and/or as a table. Let's try both options. Save the Unique values report to report.html and save the Unique values table to our GeoPackage with the layer name unique_values.
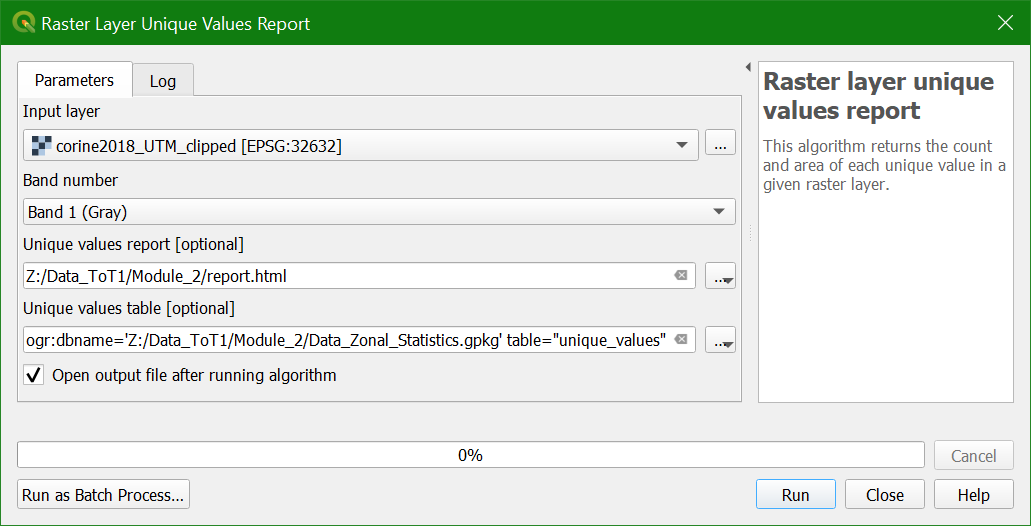
6. Click Run and Close the window after processing.
You can find the HTML results in the Results viewer panel:
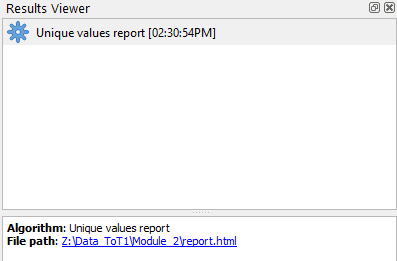
7. You can click on the item or open the html file. Check the result.
8. Now open the unique_values table that was added to the Layers panel (click right and choose Open Attribute Table).
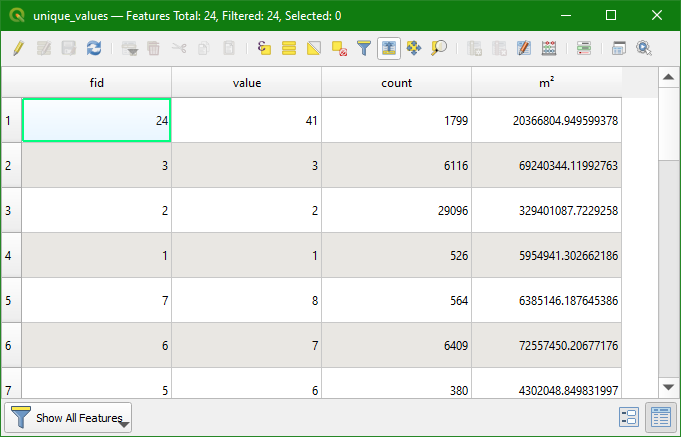
You can see that it gives for each class in the raster layer the count (nr. of pixels) and the area in m2.
In the next subsection we're going to calculate the are per subcatchment.