Tutorial Zonal Statistics and Area Computations
6. Area computations with discrete rasters
6.2. Zonal histogram
In the previous subsection we have derived the areas of all classes in the land cover map for the entire raster layer. However, we are more interested in the class area per subcatchment. We can calculate that with the Zonal histogram tool.
1. In the Processing Toolbox look for Raster analysis | Zonal histogram.
2. In the Zonal Histogram dialogue choose corine2018_UTM_clipped as Raster layer and subcatchments_fixed as Vector layer containing zones. Save the Output zones to the GeoPackage with the name zonal_histogram and click Run.
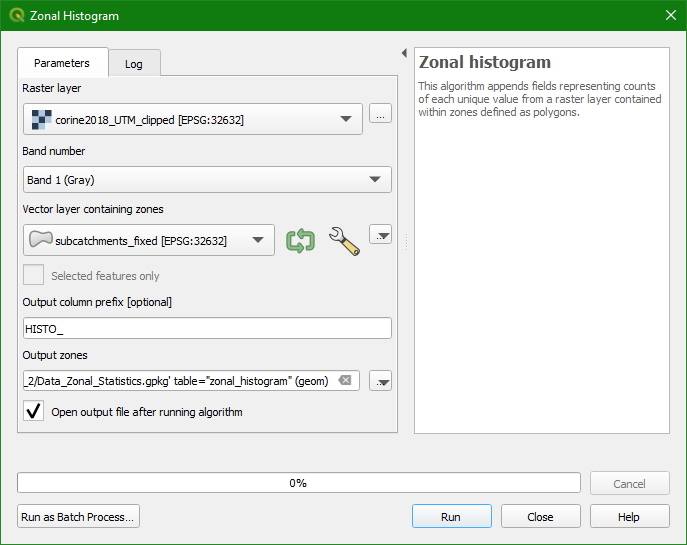
3. Click Close to close the dialogue.
4. In the Layers panel move the new zonal_histogram layer to the top and copy the style from the subcatchments_fixed layer to zonal_histogram.
5. Now open the attribute table of zonal_histogram and inspect the results.
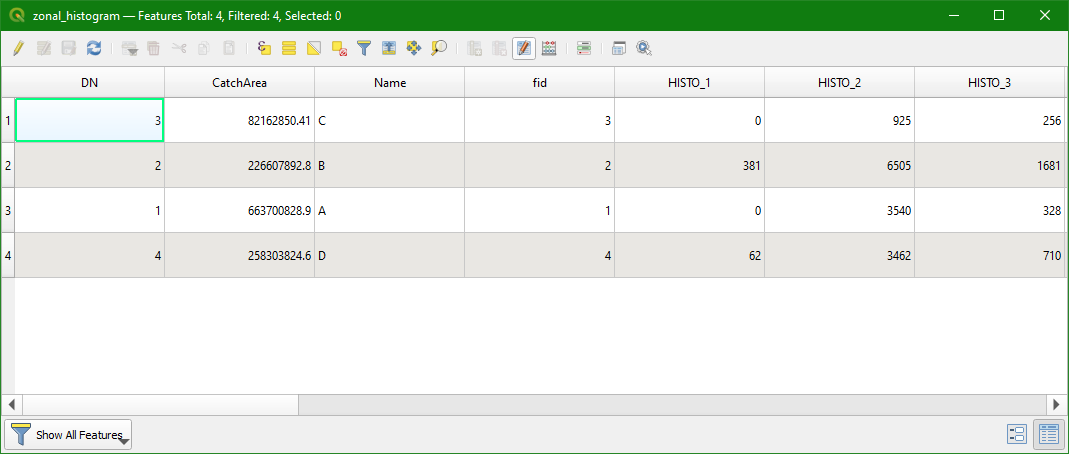
You can see that the features are the four subcatchments and that in the HISTO_# fields we have the number of pixels in each class.
- How can we calculate the surface area in m2 of each class in each subcatchment?