In this section we'll use a tool from the Processing Toolbox to calculate the zonal statics from the DEM using the subcatchment polygons. The Processing Toolbox
in QGIS provides a lot of tools for processing GIS data. Besides QGIS
tools, it also has tools from GDAL, GRASS, and SAGA that are very
useful.
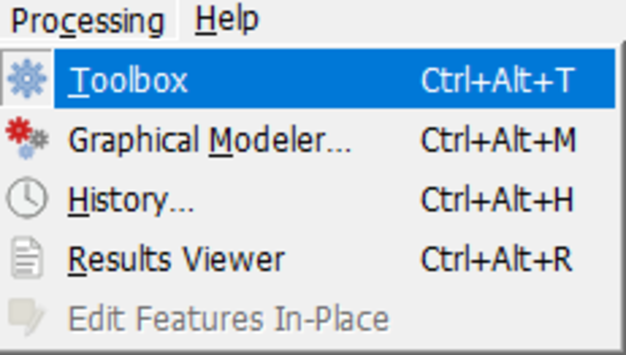
1. You can activate the Processing Toolbox by choosing Processing | Toolbox from the main menu.
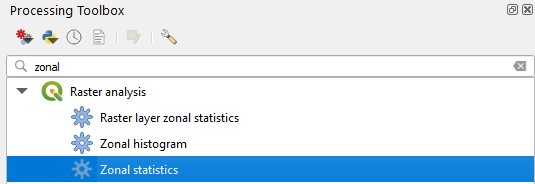
Now the Processing Toolbox panel shows up.
2. In the Processing Toolbox click on Raster analysis | Zonal statistics (you can use the search box to search for it)
3. In the dialogue choose subcatchments as Input layer and DEM as Raster layer. We leave the Output column prefix as default.
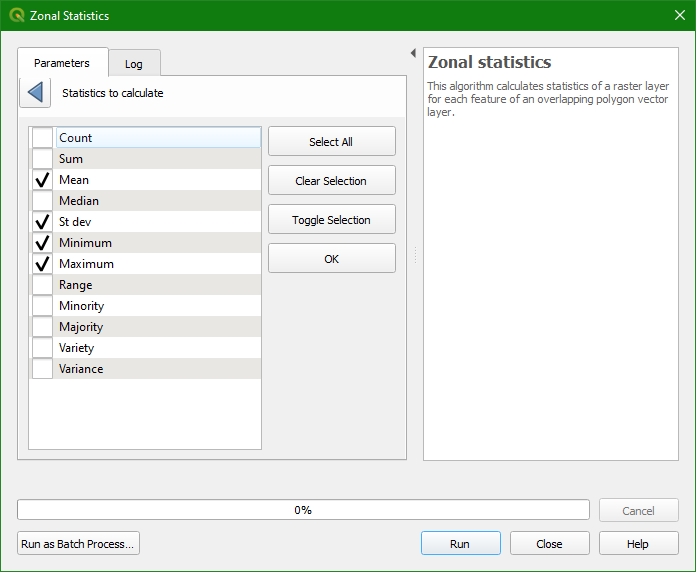
4. Click on  to choose the statistics that you want to calculate. Here choose Mean, St dev, Minimum and Maximum and click OK to return.
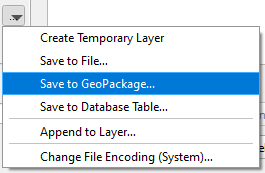
5. At the Zonal Statistics field use the dropdown menu to choose Save to GeoPackage. There browse to the GeoPackage of this project and indicate in the popup that you want to use subcatchment_elevation as the layer name.
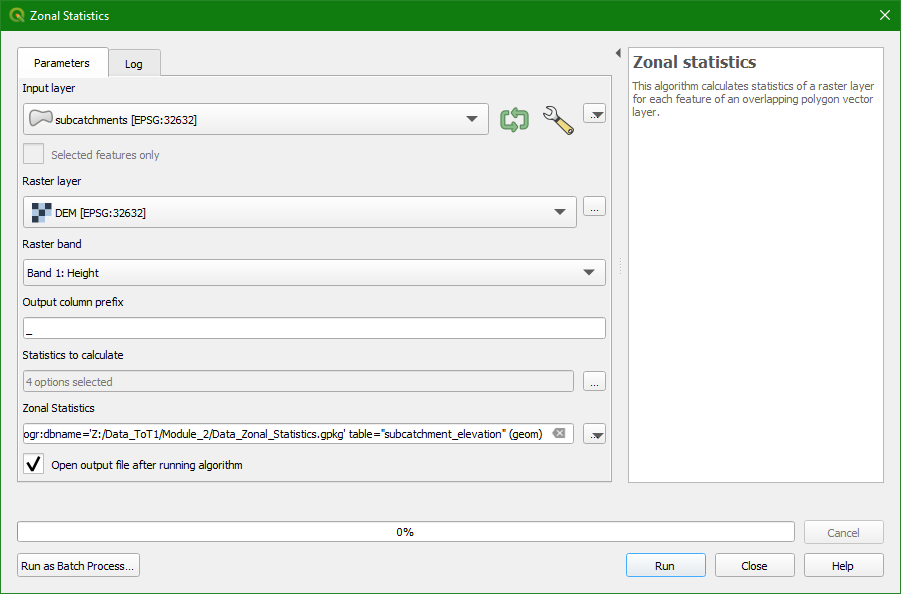
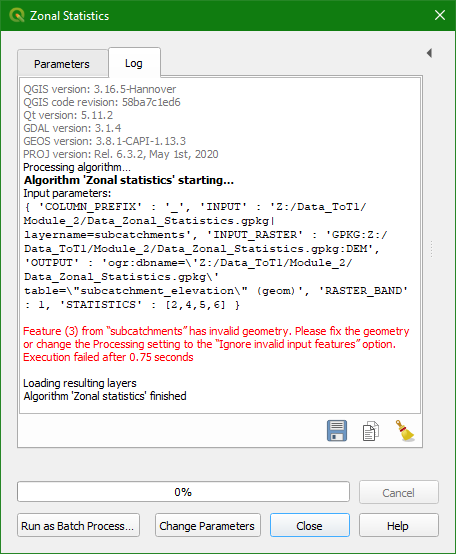
6. Click Run.
You'll get the following error:
This often happens when the polygon layer is derived from raster data, resulting in geometry errors. We can easily fix this.
7. Click Close to close the dialogue.
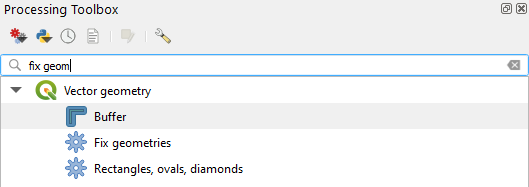
8. In the Processing Toolbox look for the tool Vector geometry | Fix geometries
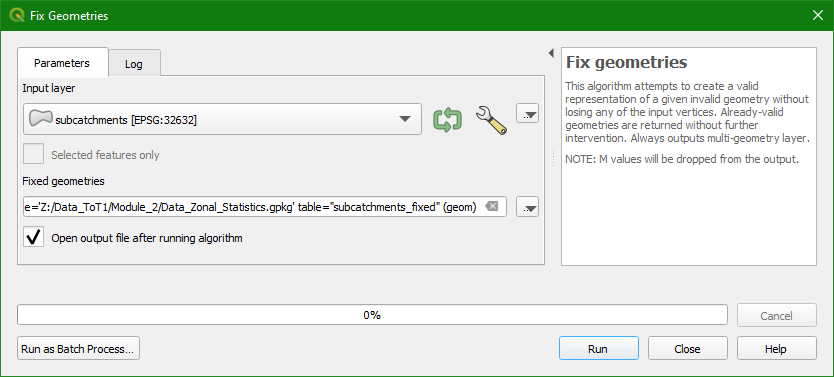
9. Save the Fixed geometries to the GeoPackage with the layer name subcatchments_fixed and click Run.
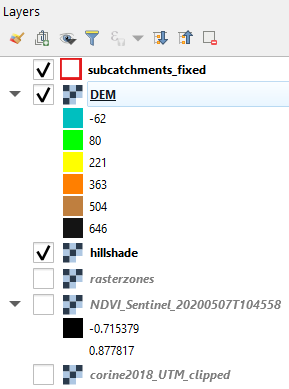
The subcatchments_fixed layer has now been added to the Layers panel.
10. Copy the style from subcatchments to subcatchments_fixed: click right on subcatchments and choose Styles | Copy Style | All Style Categories. Then click right on subcatchments_fixed and choose Styles | Paste Style | All Style Categories
11. Now remove the subcatchments layer from the Layers panel (click right on the name and choose Remove Layer.... Click OK in the popup to confirm. Note that the layer will not be deleted, but is only removed from the Layers panel. Make sure the subcatchments_fixed layer remains and is on the top of the list in the Layers panel:
12. Now repeat steps 2 - 6 with the subcatchments_fixed layer. Also save the output as subcatchments_elevations_fixed, because the other layer already exists.
You'll see the result added to the Layers panel.
13. Copy the style from subcatchments_fixed to subcatchments_elevations_fixed and hide the subcatchments_fixed layer by unchecking the box before the layer name.
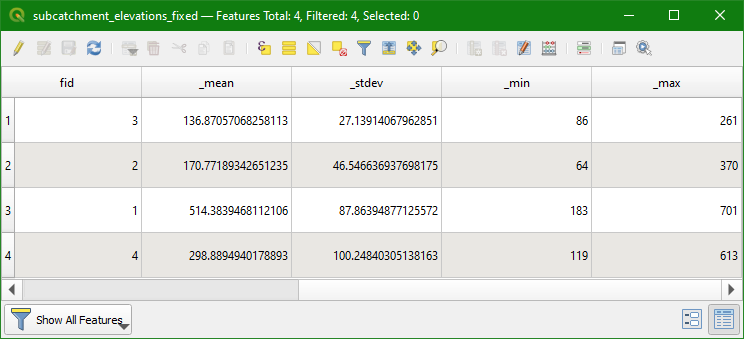
Let's check the result in the attribute table.
14. Click right on subcatchments_elevations_fixed and choose Open Attribute Table.
- Which subcatchment has the highest average elevation?
- Which subcatchment has the lowest elevation?
- Which subcatchment has the highest variability in elevation?
In the next chapter we'll calculate zonal statistics using two raster layers.