Tutorial Zonal Statistics and Area Computations
Completion requirements
3. Data exploration
Let's first start QGIS.
1. Start QGIS Desktop with GRASS. We'll need GRASS in Chapter 6 of this tutorial.
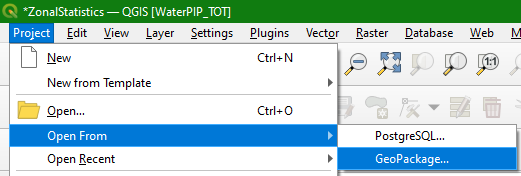
2. In the main menu choose Project | Open From | GeoPackage...
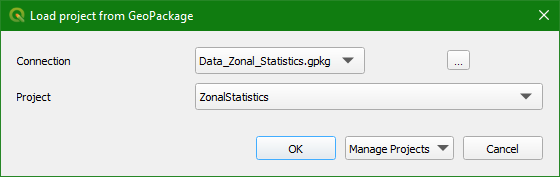
3. In the Load project from GeoPackage dialogue use the  button to browse to the provided Data_Zonal_Statistics.gpkg file, choose the ZonalStatics project and click OK.
Now let's explore the data.
4. Click right on subcatchments and choose Properties.
5. Go to the Information tab and check the metadata.
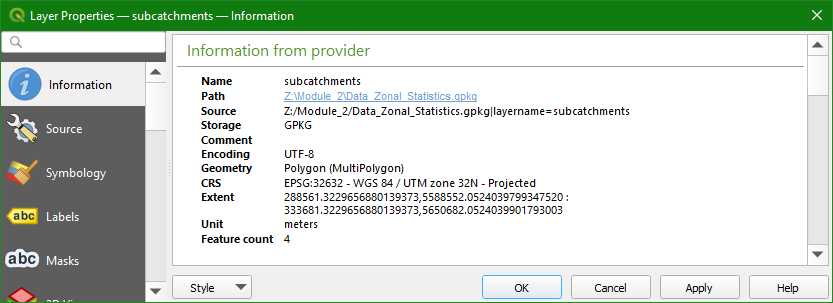
- Does the data contain points, lines or polygons?
- Where is the data stored?
- What is the projection?
- What are the attributes?
6. Click Cancel to close the window.
7. Now click right on DEM and choose Properties.
8. Go to the Information tab and check the metadata.
- Is this a raster or vector?
- Where is the data stored?
- What is the projection?
- What is the minumum, maximum and average values?
- What is the cell size?
9. Now go to the Histogram tab.
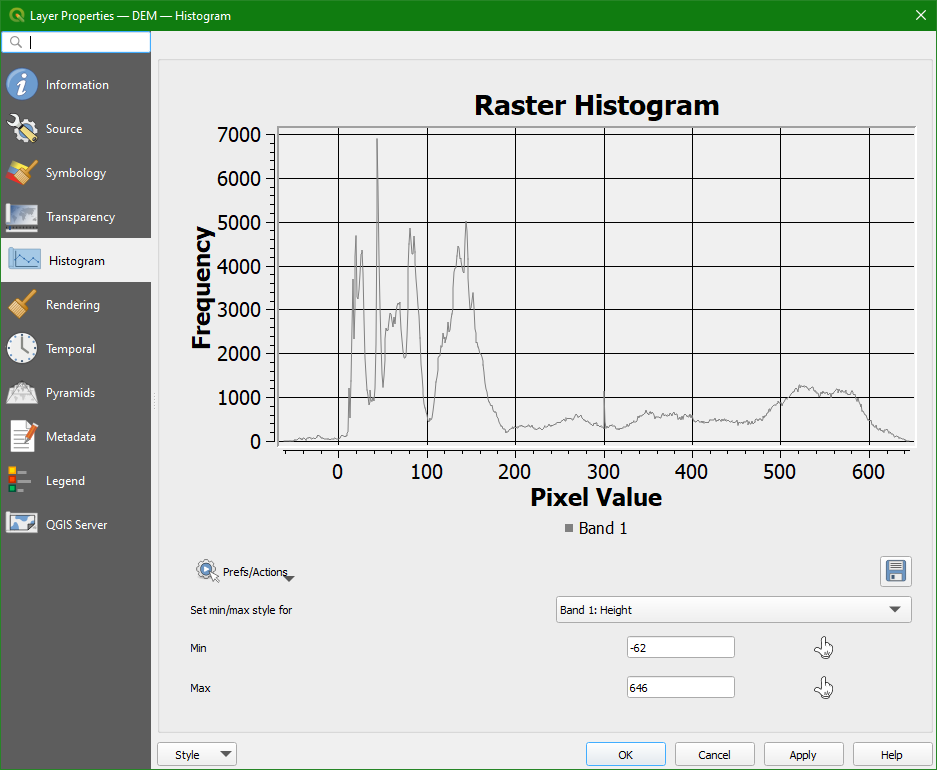
- Describe the distribution of the elevation values.
10. Click  to save the plot to a PNG file and check the result
to save the plot to a PNG file and check the result11. Click Cancel to close the window.
12. Repeat this for the other layers.
After this quick exploration of the data we'll continue with styling and caculating zonal statistics in the next chapter.