Tutorial Stream and Catchment Delineation using PCRaster in QGIS
7. Fill Sinks and Calculate Flow Direction
7.4. Styling the Flow Direction Layer
Next you will work on styling the flow direction raster. This will help you check the results and ensure they match what you were expecting. You will employ a circular color ramp to intuitively show southern oriented flows with warm colors and northern facing flows with cool colors.
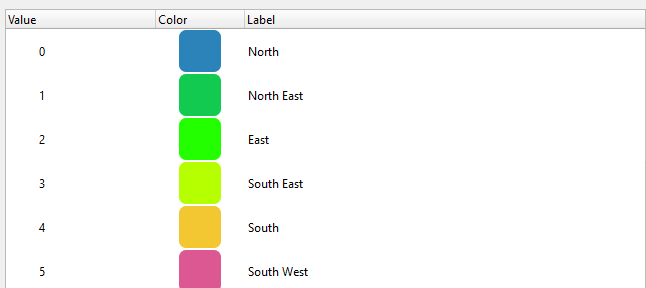
Because the flow directions in the PCRaster LDD format are in a complicated order to style (numbers on the numeric pad), we'll first reclassify the flow direction values using the values used by SAGA (0 = North, 1 = North East, ..., 7 = North West, 255 = Flat).
1. In the Processing Toolbox go to Raster Analysis | Reclassify by table
2. In the Reclassify by Table dialogue choose flowdirection as Raster layer and click  at Reclassification table to create the lookup table.
3. Fill in the table as the screenshot below and click OK to return to the main dialogue.
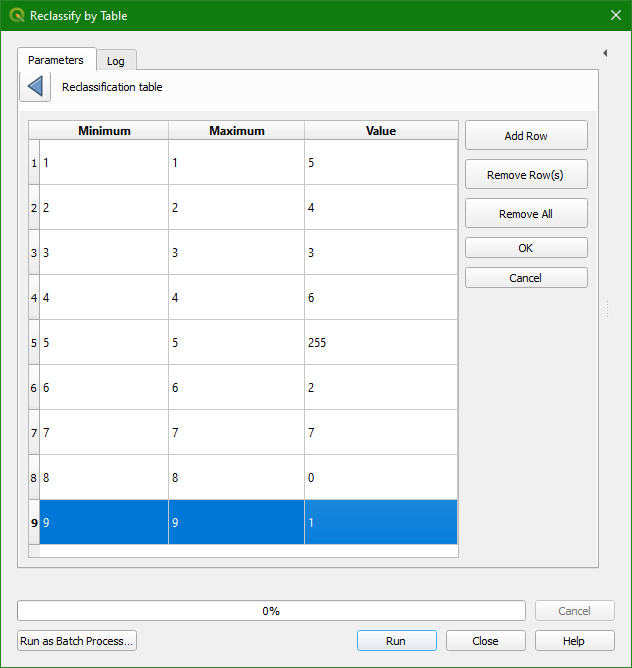
4. Change the Range boundaries so they include the min and max values, choose Byte for Output data type (1 byte = 8 bits = 256, which is enough to store the flow direction values) and save the Reclassified raster to flowdir.tif.
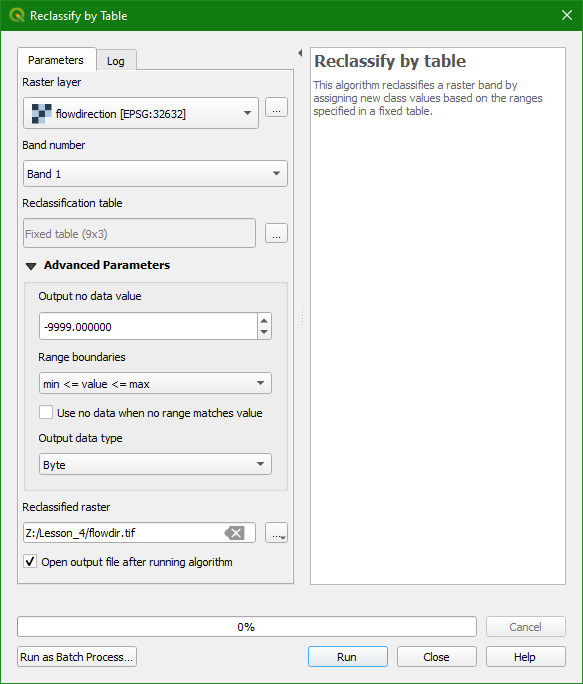
5. Click Run to perform the reclassification. Click Close to close the dialogue.
6. Using the Layer Styling panel set the target layer to flowdir.
7. Set the renderer to Paletted/Unique values and click Classify.
8. Since the value of 255 represents flat surfaces, select that value and click the Minus  button to remove it from the classification.
9. Choose the Spectral color ramp as a beginning point. Right-click on the color ramp and choose Edit Color Ramp.
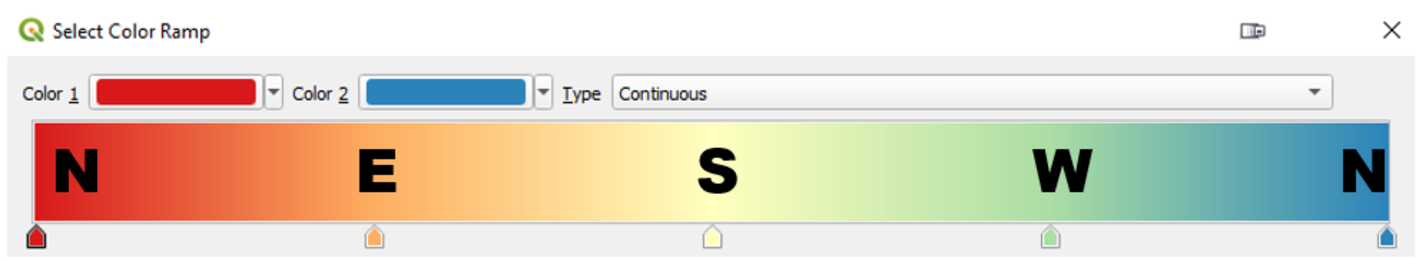
10. The Select color ramp window will open. Here you can edit the color stops for the ramp. The idea is that the far left and right sides will represent northern flows and you will set both of those stops to the same blue color. You will then set the center stop to a bright yellow for southern flows. The stop in the middle on the right will be western flows and the stop in the middle to the left will be eastern flows.
11. Click the drop-down menu for Color 1 and choose Pick color from the context menu. With the eye dropper cursor click on the Color 2.
12. Click the center stop that will represent southern flows and assign it a bright yellow by entering these RGB values: 255 | 255 | 0.
13. For the eastern stop assign the color green by entering these RGB values: 0 | 255 | 0.
14. For the western stop use a magenta color, RGB: 214 | 60 | 170.
Note that the last stop in fact will represent NW. Therefore you could improve the ramp by giving the last stop a colour between magenta of west and blue of North.
15. Click OK to accept the new color ramp.
16. Click the Plus ![]() button to add a new value to the classification for the Value type 255. This represents the flat areas you initially removed before creating the circular color ramp. Click the color patch and choose white.
button to add a new value to the classification for the Value type 255. This represents the flat areas you initially removed before creating the circular color ramp. Click the color patch and choose white.
17. Edit the labels in such a way the reflect the compass directions in a human readable way, instead of the pixel values.
18. To review the flowdir data you will now give it a Blending mode of Multiply and turn on the hillshade layer. This will allow you to see the detail of the hillshade through the flowdir layer. At this point just have the channels, flowdir, and hillshade layers turned on. Zoom in to some of the more mountainous terrain in the south of the study area where there are also channels present. Inspect the data.
You should see southern facing slopes being represented by warmer colors and northern by cooler colors, eastern flows will be greener and western flows more purple.