Exercise 6.2: Deploy your first web application
完成条件
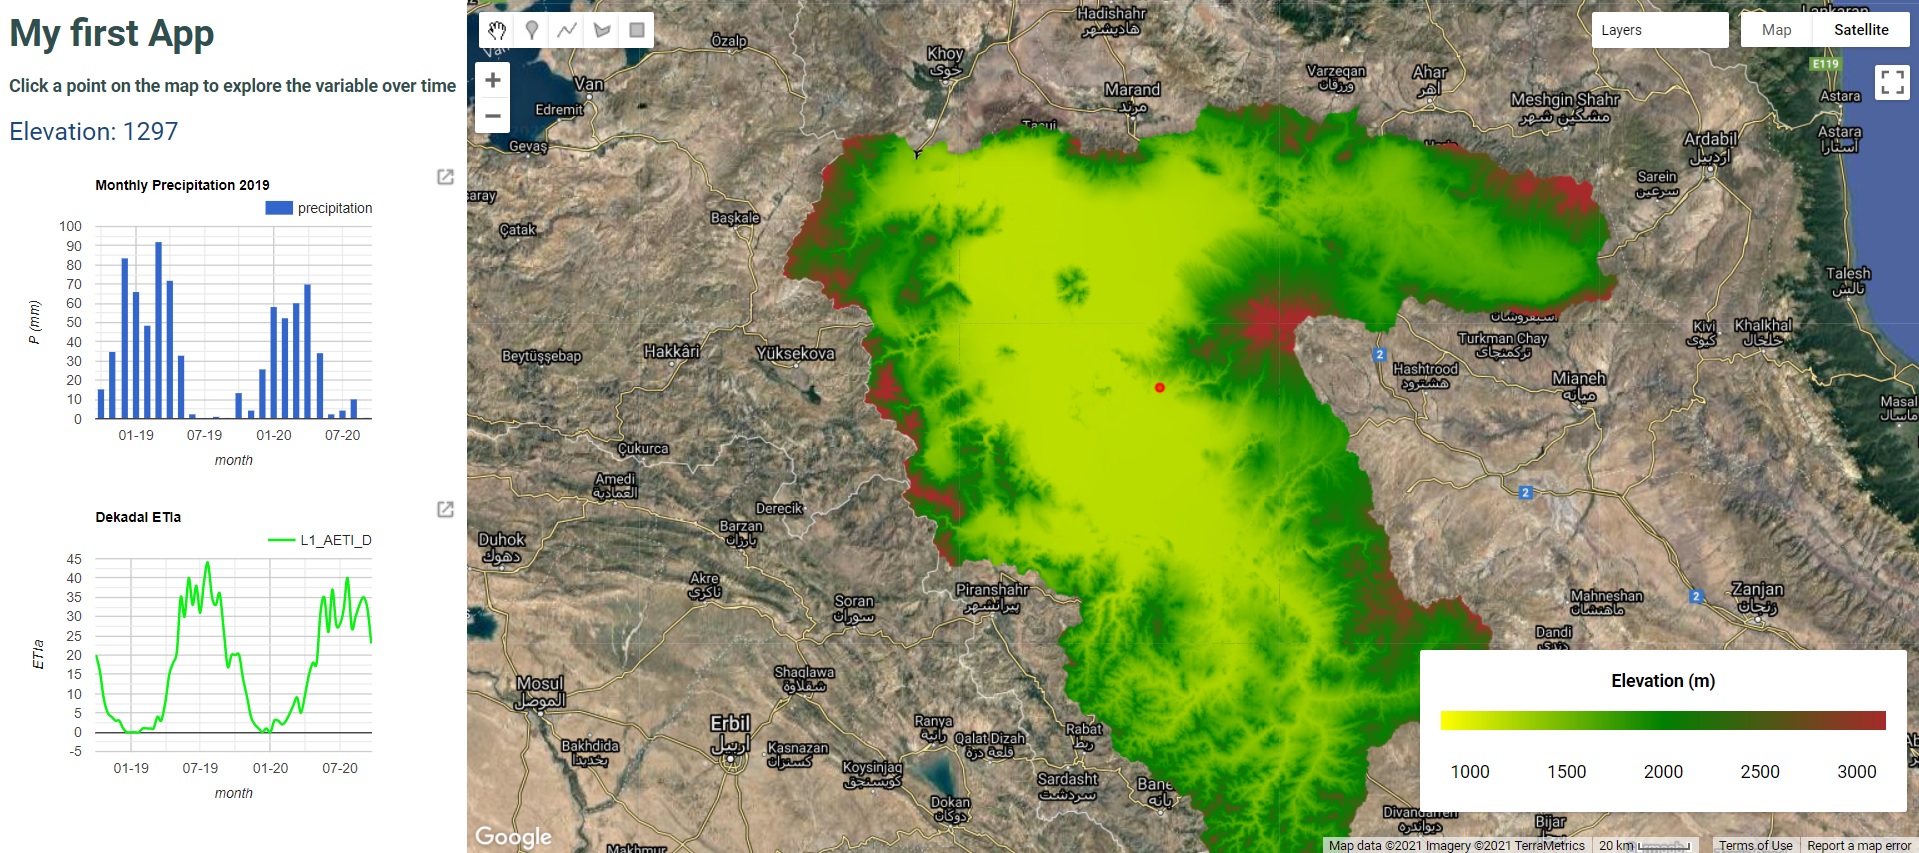
Objective: Develop a web application with the following features:
- Default background of very high resolution satellite data
- Elevation map in the layer list, show the legend of elevation map
- Confine the web app region to a study area (in this case ulb)
- Create a UX panel on the left side to display charts and text
- On click - display charts showing monthly variation of precipitation and ET of that pixel
- On click - display the elevation value of that pixel
- Able to import the chart values to csv
Steps:
Step 1: Follow this tutorial (Tutorial 6.2, next activity) to compile your script and save the script in your repository
Step 2: Follow the video given under Exercise 6.1 to deploy this newly developed script as a web application.
Step 3: Adapt the script to your own study area
最后修改: 2021年07月19日 星期一 15:51