Hand in Hand Tutorial
Completion requirements
2. Tutorial on Utilizing WaPOR Data in the HiH Geospatial Platform
2.2. Data Analysis Tool
In this chapter three types of analysis will be presented, including Point Time Series, Area Time Series, area and Land Cover Classification.
A. Point Time Series
To get started, import the data layer you wish to analyze for the given point. For example, here the monthly precipitation data from WaPOR was imported.
Click on the point where you want to analyze the data and the Feature Information tab will opened.
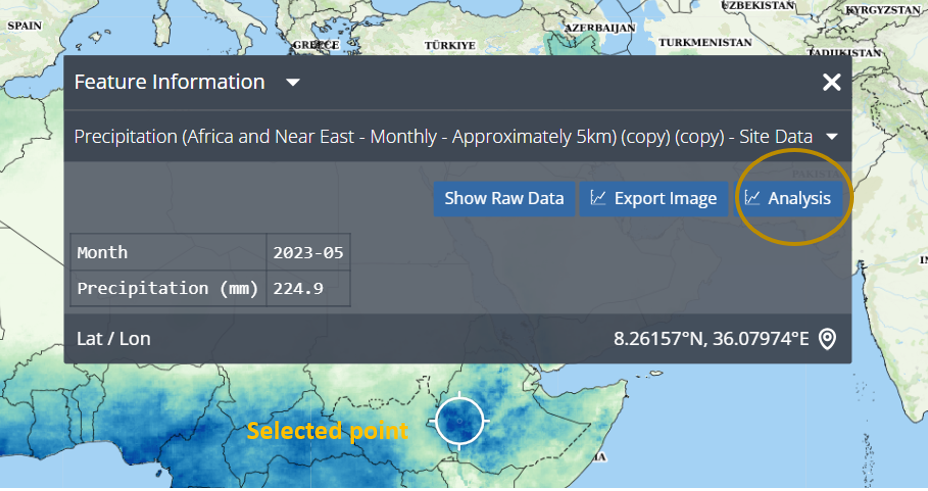
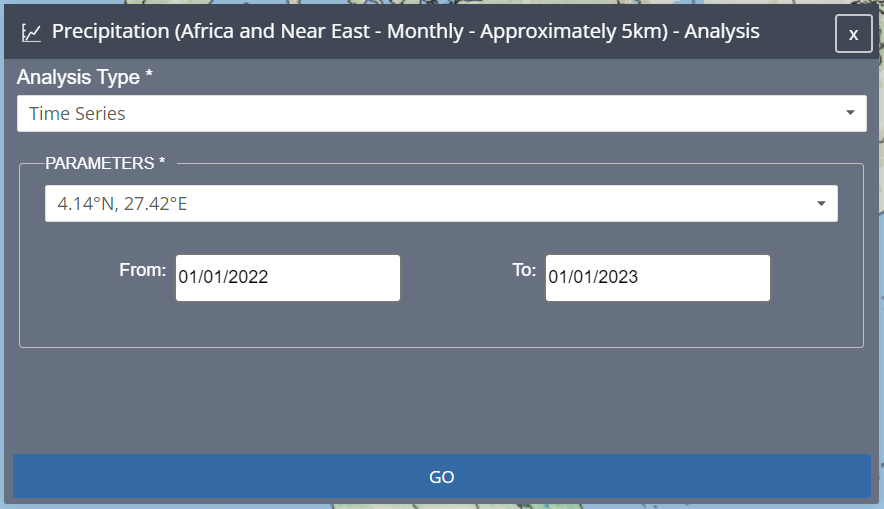
Under the Analysis option, there are three types of analysis available; Deviations from Average, Time Series, and Cumulative Time Series. For example, Precipitation data over time is displayed by selecting the Time Series option.
Also, choose the time frame you want to analyze and then click on the "Go" button.
Once you have selected the point, analysis type and give a time frame for analysis , you will be able to view the Chart Tab which displays the graph of time series. From there, you can download the data directly to your local computer.
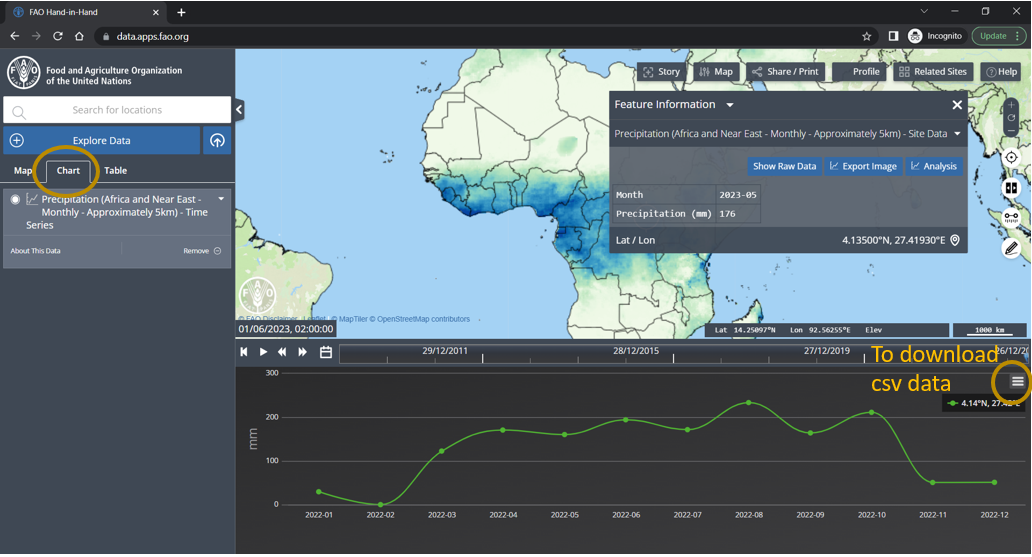
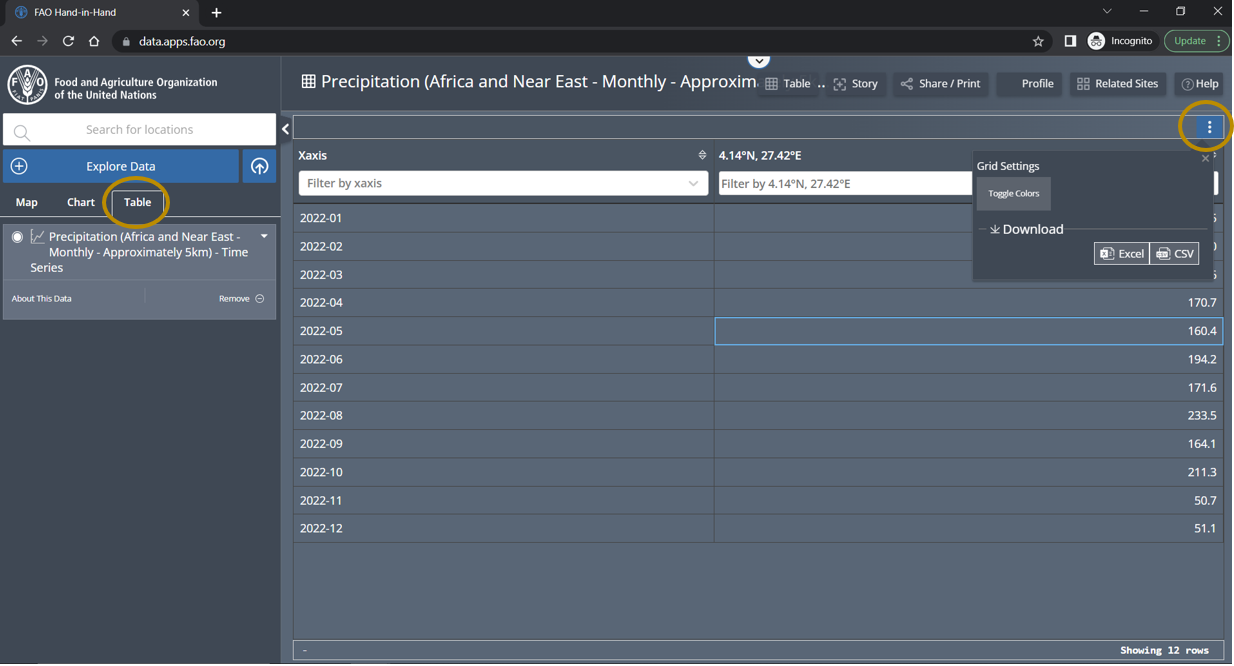
You can access the data table on the Table Tab and choose to download it in either Excel or CSV format. This allows you to work with the data in a way that best suits your needs. Refer to the image below for guidance.
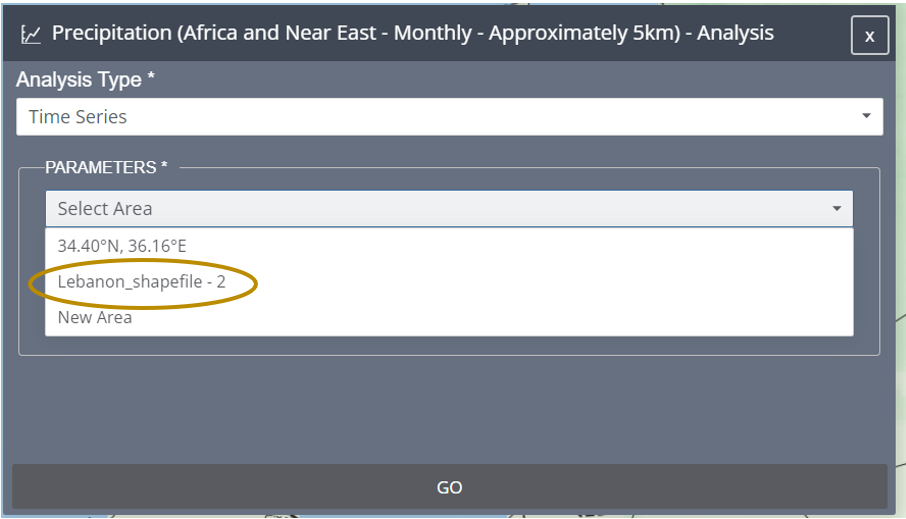
B. Area Time Series
To do the Area Time Series analysis, we have 2 options: draw an area or upload a file.
Here, the uploaded Lebanon shapefile has been used for the analysis as shown in the figure below.
Next, choose the time period for the analysis.
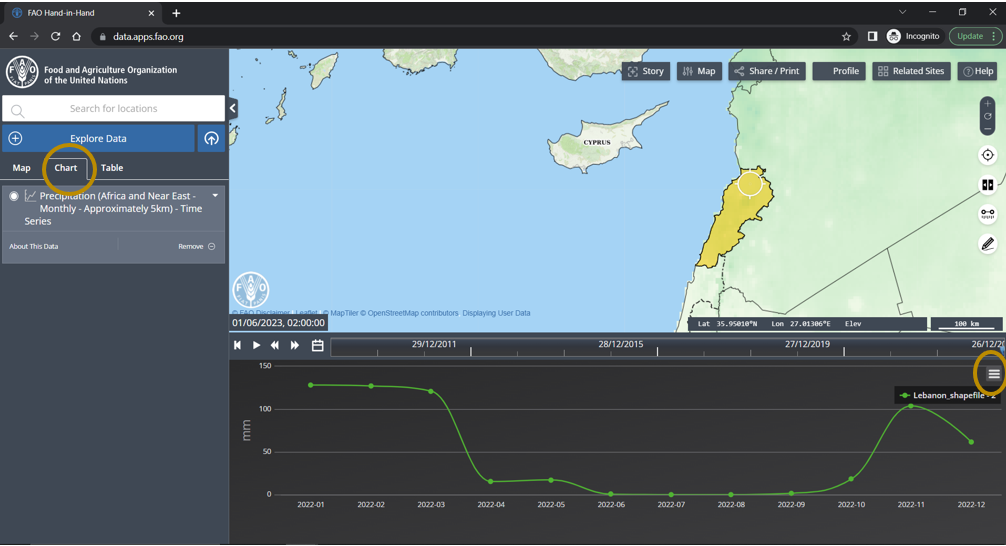
The graph and table can be retrieved and downloaded, similar to the point time series.
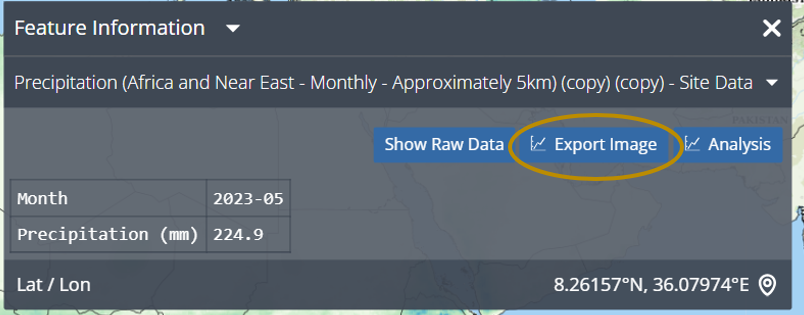
With Export Image option the Precipitation can be clipped to the selected area and downloaded as .TIF to be used for further analysis in QGIS.

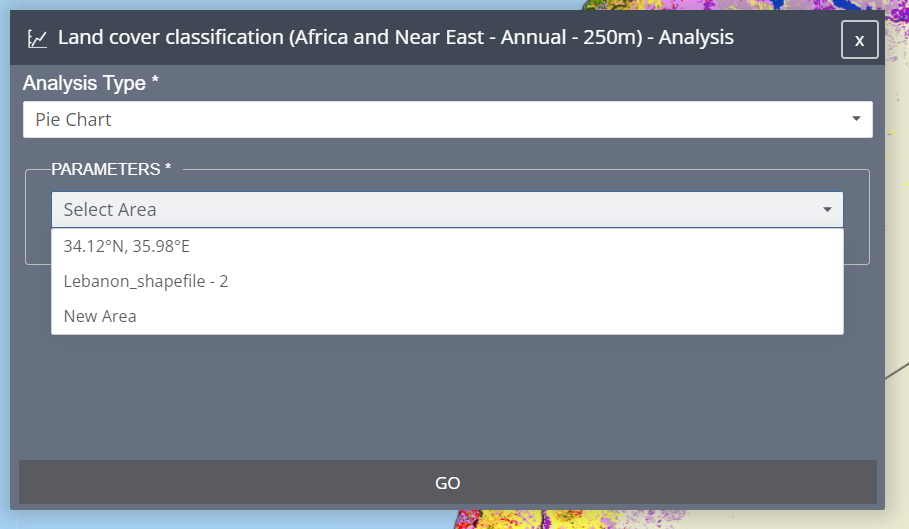
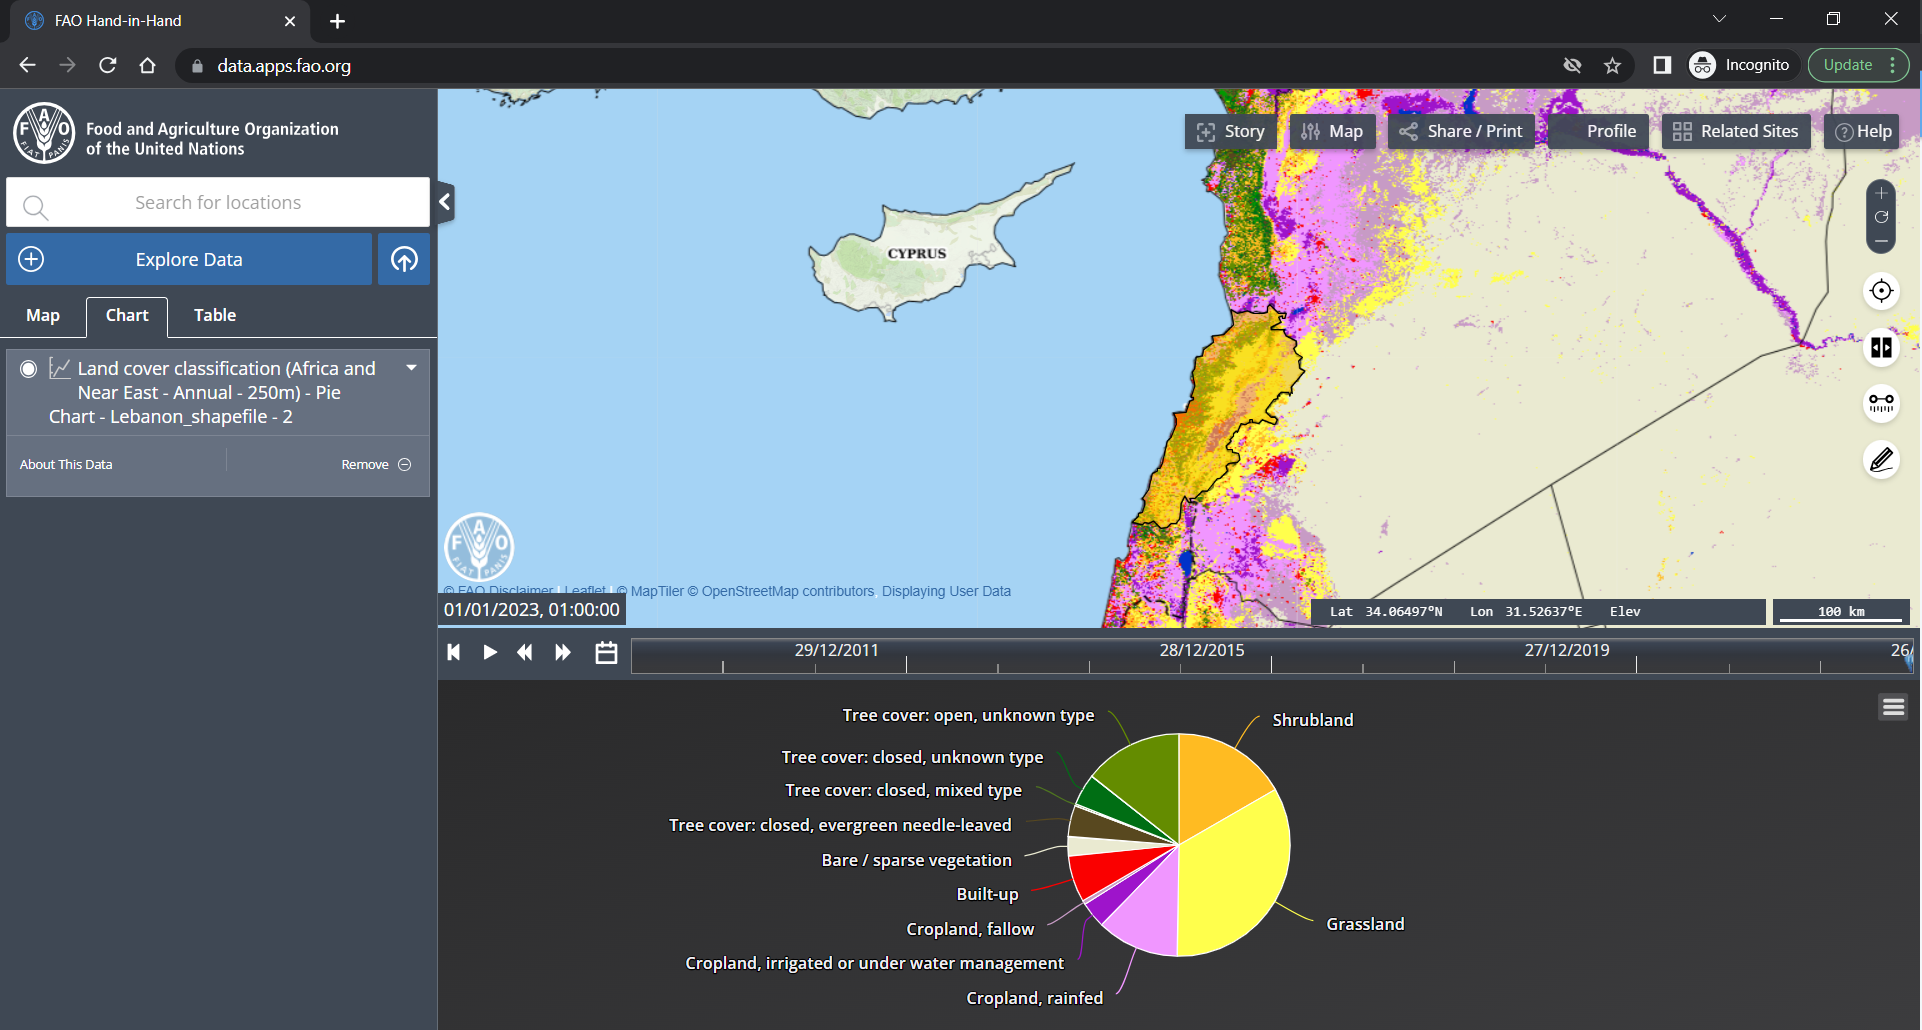
C. Land Cover Classification
Import the Land Cover Classification map from the Data Tab and select the area.
The results will be generated as an illustration of Pie chart as shown bellow.
The results will be generated as an illustration of Pie chart as shown bellow.
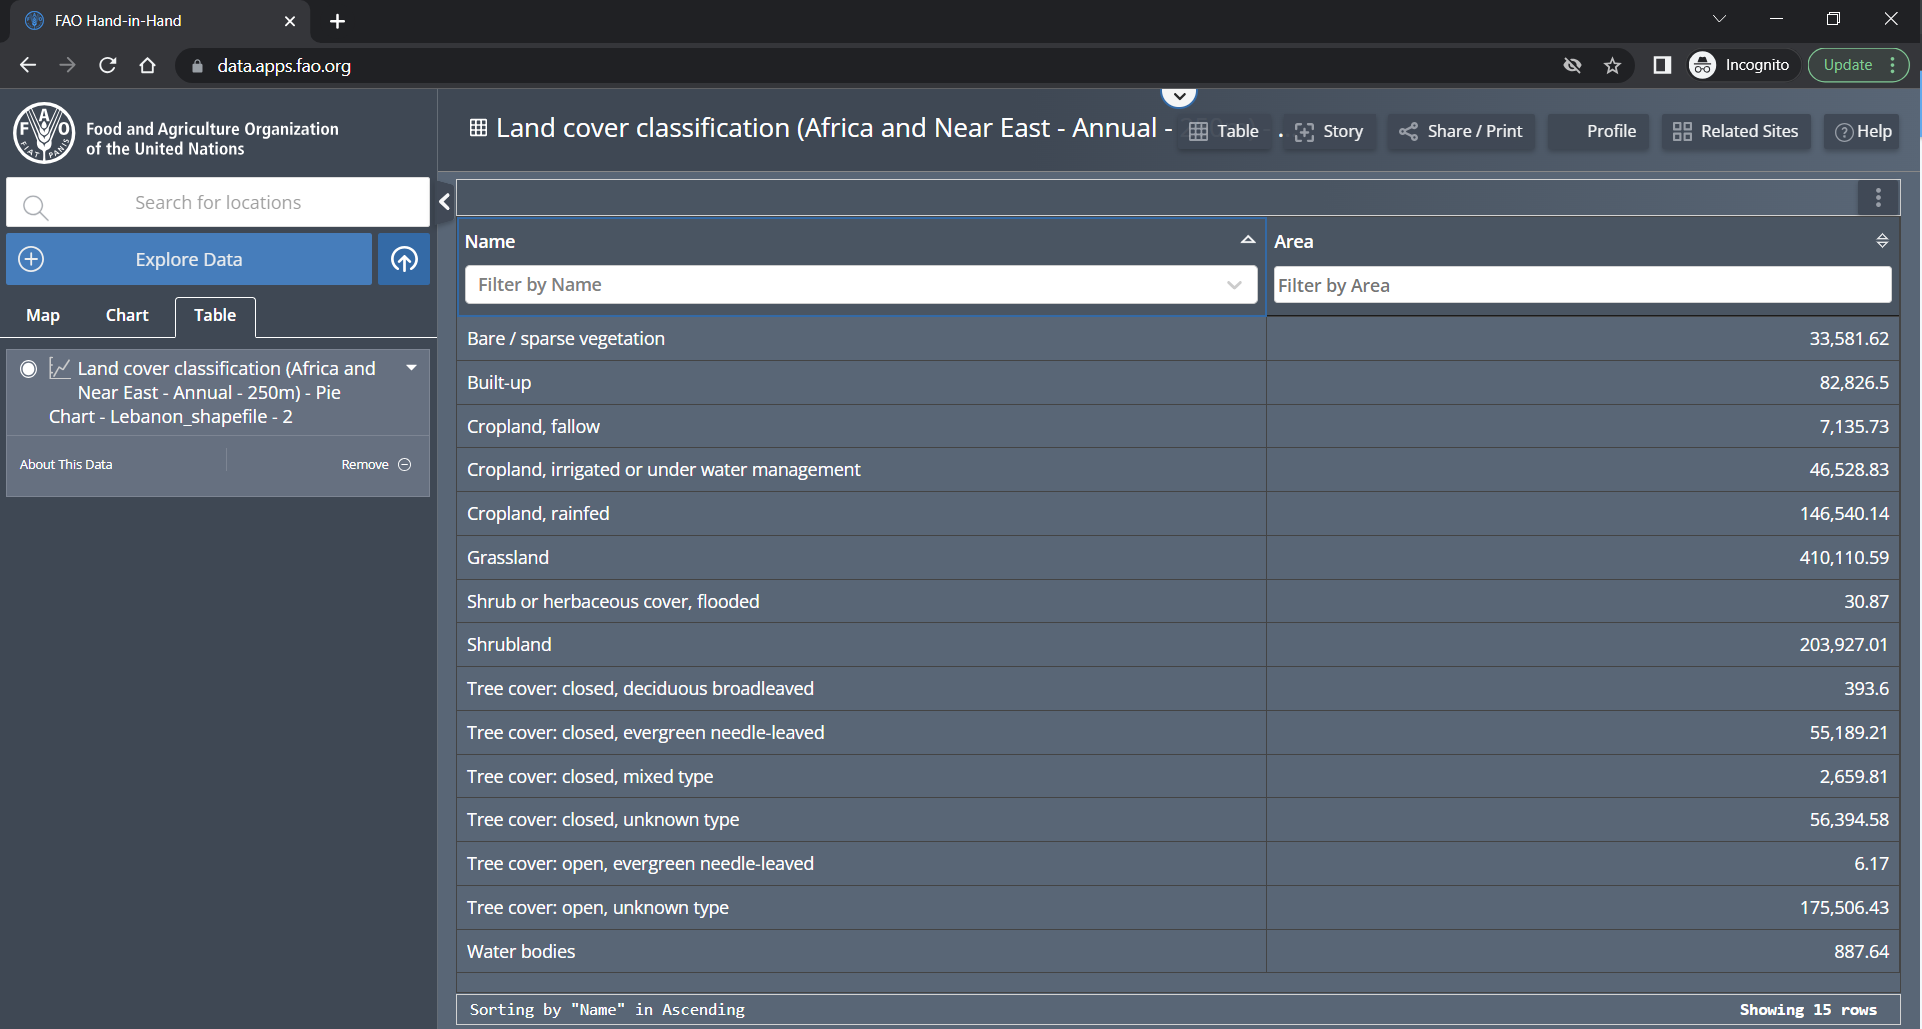
The Table generated from the data shows the area of each class and can be downloaded for further analysis.
Please refer to the video below for step-by-step instructions.
A. Point Time Series
To get started, import the data layer you wish to analyze for the given point. For example, here the monthly precipitation data from WaPOR was imported.
Click on the point where you want to analyze the data and the Feature Information tab will opened.
Under the Analysis option, there are three types of analysis available; Deviations from Average, Time Series, and Cumulative Time Series. For example, Precipitation data over time is displayed by selecting the Time Series option.
Also, choose the time frame you want to analyze and then click on the "Go" button.
Once you have selected the point, analysis type and give a time frame for analysis , you will be able to view the Chart Tab which displays the graph of time series. From there, you can download the data directly to your local computer.
You can access the data table on the Table Tab and choose to download it in either Excel or CSV format. This allows you to work with the data in a way that best suits your needs. Refer to the image below for guidance.
B. Area Time Series
To do the Area Time Series analysis, we have 2 options: draw an area or upload a file.
Here, the uploaded Lebanon shapefile has been used for the analysis as shown in the figure below.
Next, choose the time period for the analysis.
The graph and table can be retrieved and downloaded, similar to the point time series.
With Export Image option the Precipitation can be clipped to the selected area and downloaded as .TIF to be used for further analysis in QGIS.
C. Land Cover Classification
Import the Land Cover Classification map from the Data Tab and select the area.
The results will be generated as an illustration of Pie chart as shown bellow.
The results will be generated as an illustration of Pie chart as shown bellow.
The Table generated from the data shows the area of each class and can be downloaded for further analysis.
Please refer to the video below for step-by-step instructions.