The FAO Downloader Plugin
7. Inspect the downloaded data
The downloaded rasters are stored in a subfolder within your set download folder.
1. Use the QGIS Browser panel to check the folder.
2. Right-click on the download folder (FAO_data) and choose Add as Favorite to have easier access to the contents of the folder.
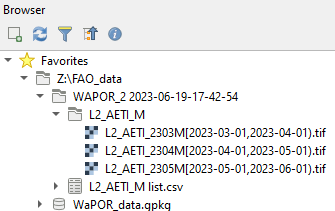
You can see that there's now a subfolder with the Workspace name and the data/time. Under that folder, there's a subfolder with the name of the product. Within that folder are the three rasters with the monthly AETI.
There's also a CSV file.
3. Drag the CSV file and the 3 rasters to the map canvas.
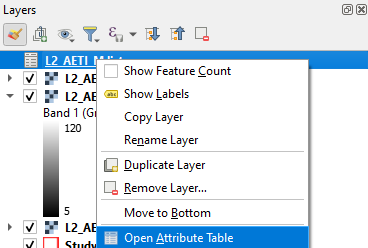
4. In the Layers panel, right-click on L2_AETI_M_list and choose Open Attribute Table from the context menu and inspect the contents of the CSV file.
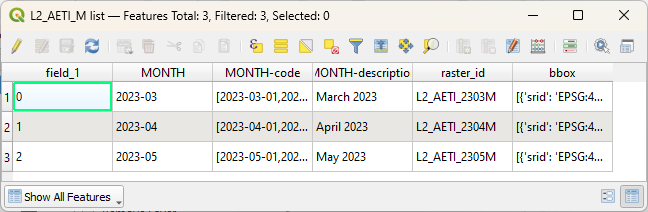
The attribute table show the downloaded months, raster ID's and the bounding box:
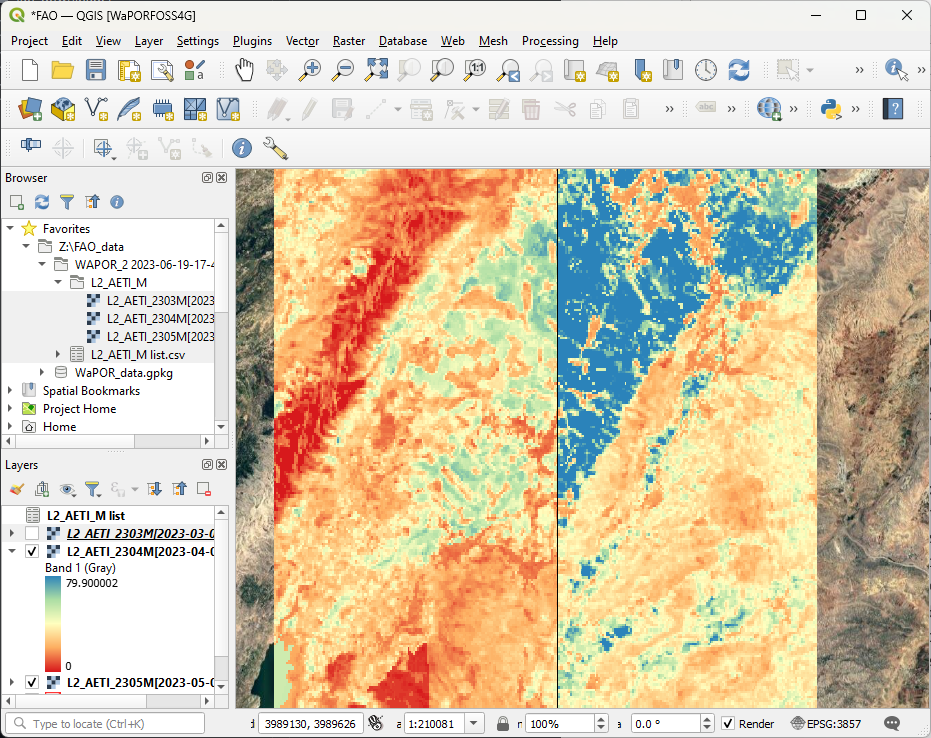
Let's style the raster layers and compare them.
5. Click on the first raster layer (March) and click  to open the Layer Styling panel.
6. Change the renderer from Singleband gray to Singebland pseudocolor.
7. Click the arrow at Color ramp and choose an appropriate one, e.g. Spectral.
To keep the same color range, we'll copy the ramp to the other layers.
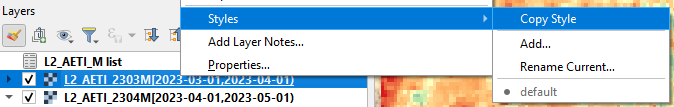
8. In the Layers panel, right-click on the raster that we've just styled and choose Style | Copy Style from the context menu.
9. Now right-click on the second raster layer (April) and choose Style | Paste Style from the context menu.
10. Repeat this for the remaining layer.
11. Hide / unhide the layers to see the difference.
Tip: An easier way to compare the layers is to use the MapSwipe Tool plugin.