Create an Animated Choropleth Map
10. Adding Decorators and Counter
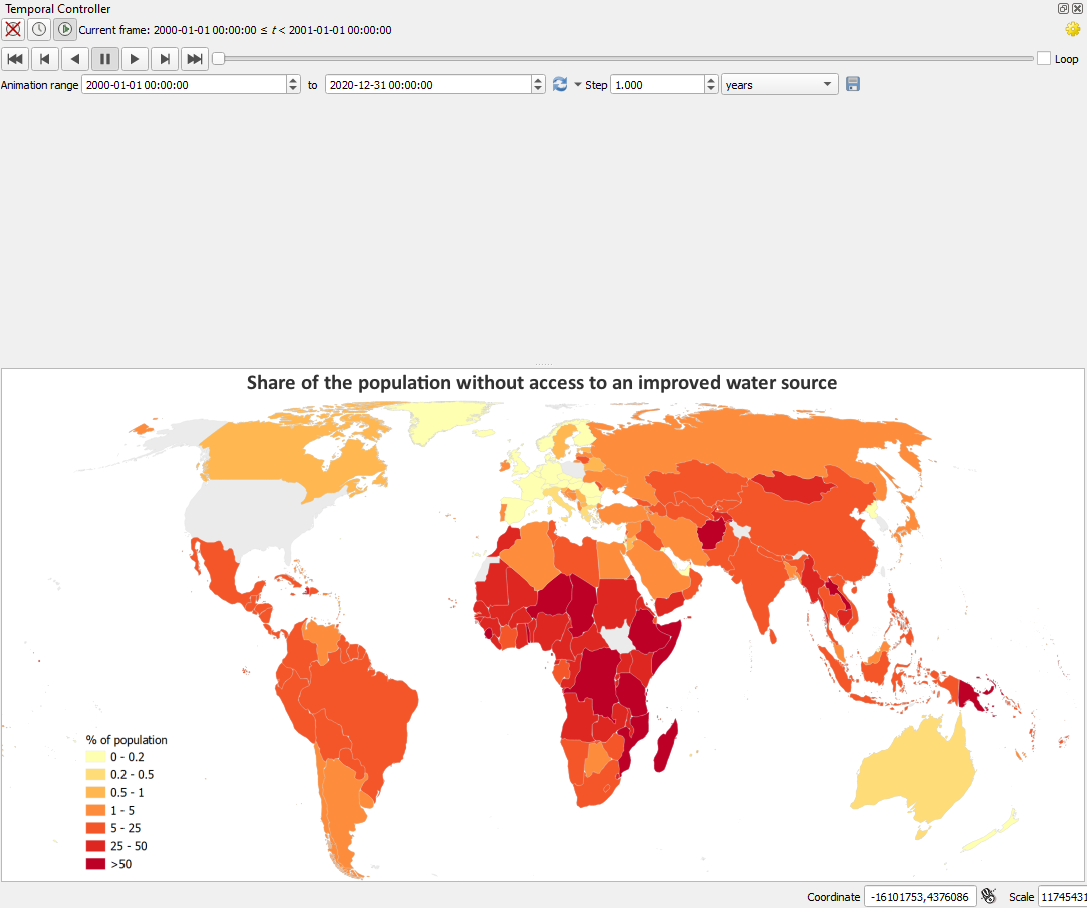
To give the user more context, in this section we're going to add a title, legend, data source and a counter.
Let's start with the title.
1. In the main menu, go to View | Decorations | Title Label....

2. In the Title Label Decoration dialog, check the box to Enable Title Label.
3. Type the following Title label text:
Share of the population without access to improved water source
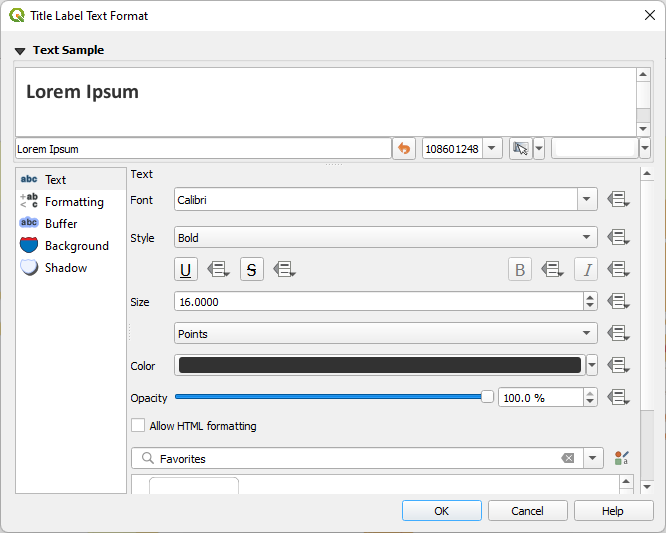
4. Change the Font to Calibri, Bold, 16 points. Change the background color to white.
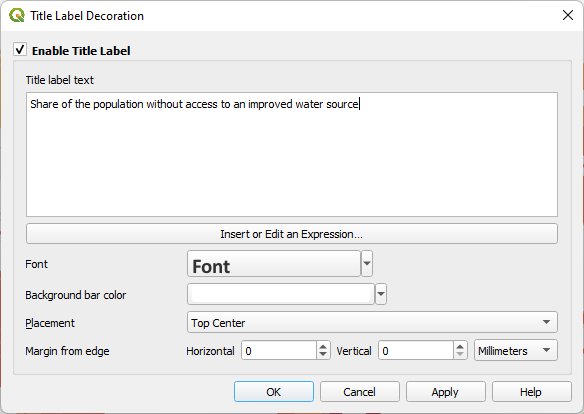
5. Click OK to apply and close the dialog.
To add a legend we need a picture of the legend. We can best make this in the Print Layout.
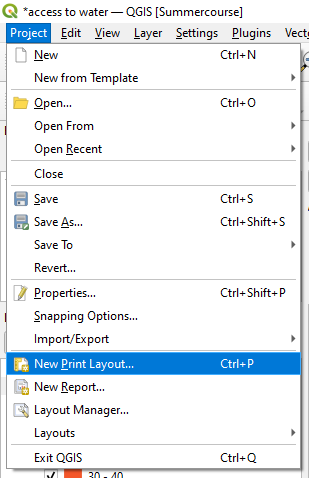
6. In the main menu choose Project | New Print Layout....
7. In the popup type Legend for the print layout title and click OK.
8. Only add a legend to the Print Layout by clicking the Add Legend icon  and drag a box on the sheet.
9. In the Item Properties panel go to the Legend Items section and uncheck the Auto update box so we can edit the legend.
10. Use  to remove all legend items except percentage_without_improved_water.
11. Double-click on percentage_without_improved_water and change the text to
% of population
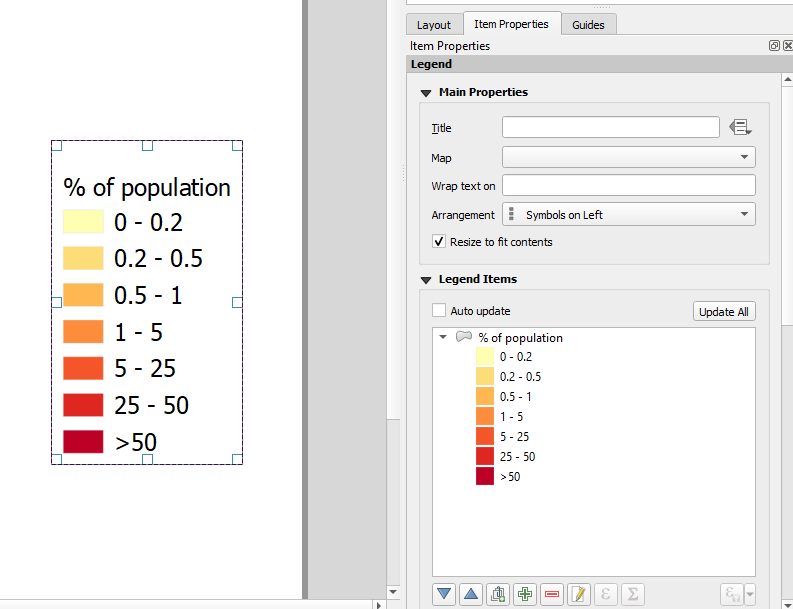
12. Make a screenshot of the legend and save it to a png file.
13. Close the Print Layout to go back to the main QGIS window.
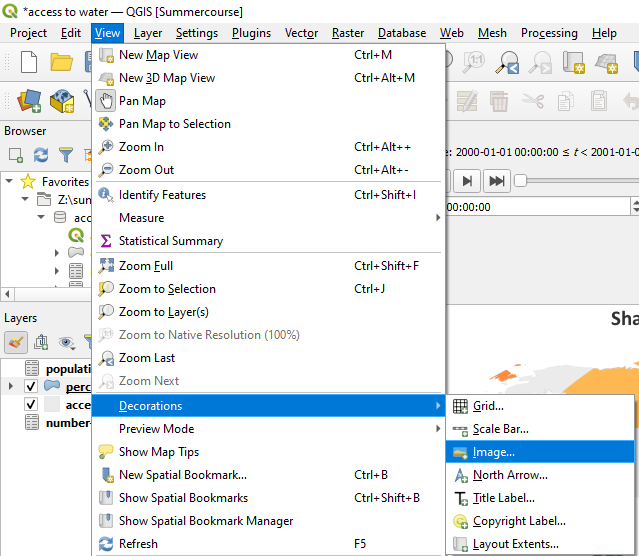
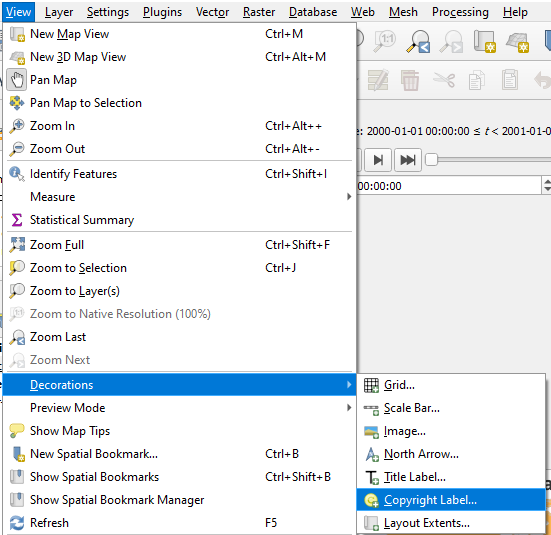
14. In the main menu go to View | Decorations | Image....
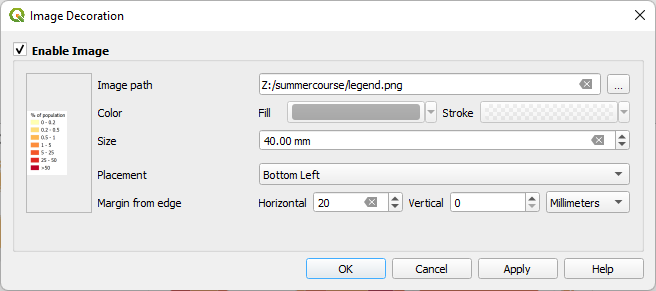
15. In the Image Decoration dialog check the box to Enable Image. Browse to the file with the saved screenshot of the legend. Change the Size to 40 mm and the Horizontal Marigin from edge to 20 mm. Keep the rest as default and click OK to apply and close the dialog.
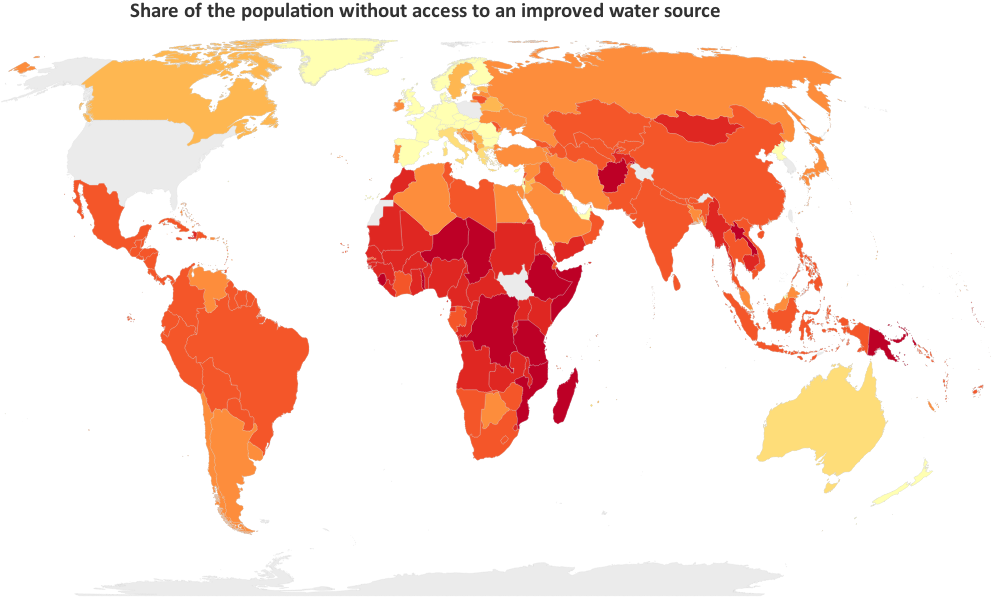
16. Move the map and expand the Temporal Controller panel in such a way that the elements show nicely in the map canvas.
It's important to mention the data sources that you have used. Let's add them in a similar way.
17. In the main menu go to View | Decorations | Copyright Label....
18. In the Copyright Label Decoration dialog check the box to Enable Copyright Label. Remove the default text and add the text given in teh screenshot below.
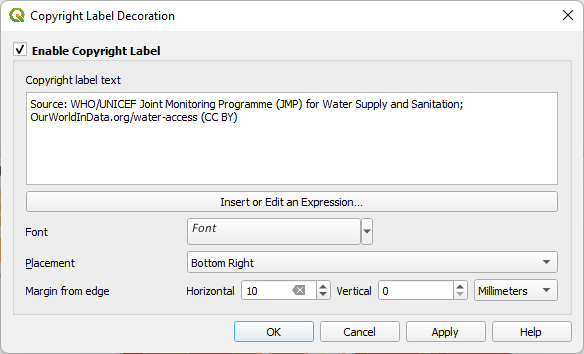
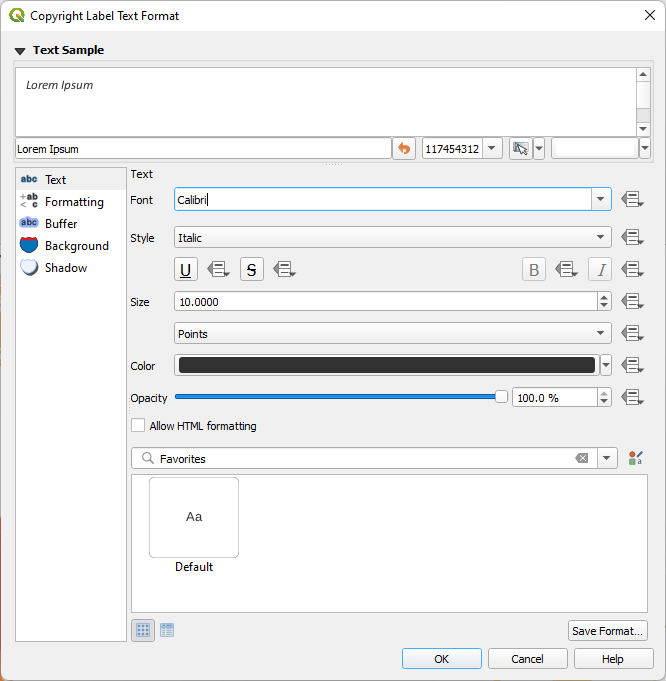
19. Click on Font to change the font to Calibri, Italic, 10 points.
20. Click OK to go back an click again OK to apply and close the dialog.
21. Nudge the map canvas between the panels in such a way that the map and added elements are nicely displayed. Note that we can move the Antarctic out of the view, but make sure that New Zealand is in!

The map doesn't need a North arrow, because from the world map it's clear where the North is. Also a scalebar is not needed in this case. However, a dynamic map needs a time counter, in this case for the year that is displayed. Let's add that.
22. Go back to the title decorator.
23. Add "in" to the text and click Insert or Edit an Expression.
There are a series of variables tied to the Temporal Controller.
24. Expand the Variables section and double-click on the map_start_time variable to add it to your expression.
This variable represents the start of the map’s time range. As you step through time on the map, this variable will update to represent the current start date for the map. We need to format the variable in such a way that it nicely shows the year.
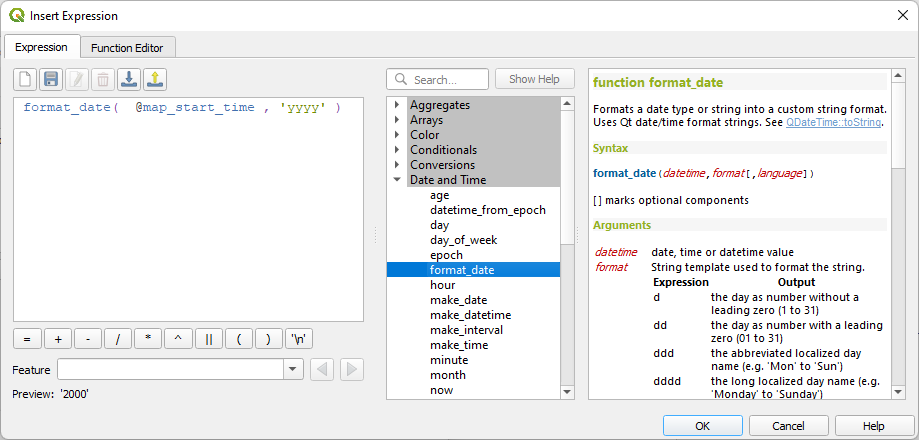
25. Put your cursor before @map_start_time, search for the format_date function and double click it to add it to the expression. Complete the expression so it reads:
format_date( @map_start_time,'yyyy' )
You can read in the right box what the syntax and arguments of the function are.
26. If the Preview in the lower left corner looks correct, click OK to apply and close the dialog.
The Title Label Decoration dialog should now look like this:
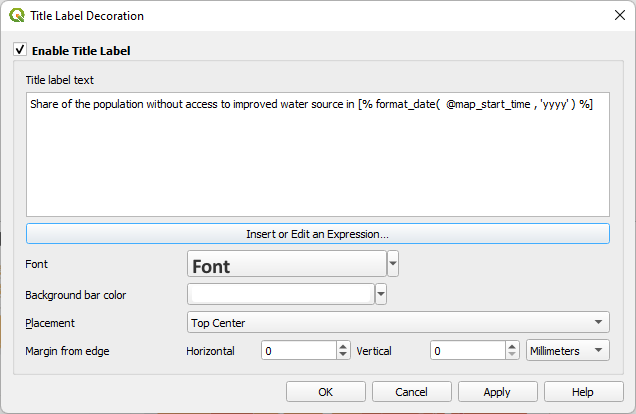
27. Click OK to apply and close the dialog.
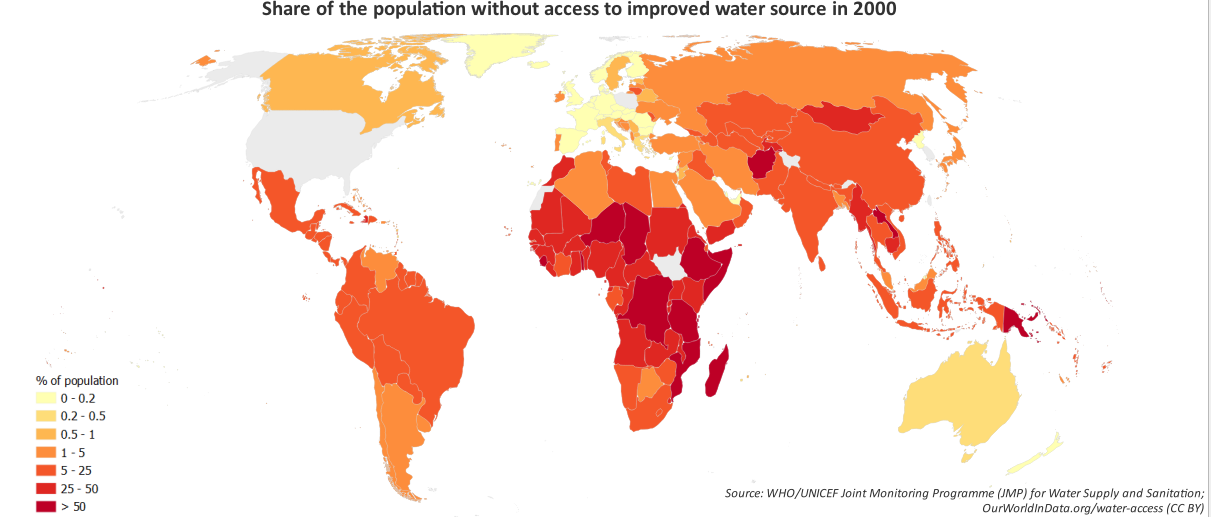
28. Click  in the Temporal Controller panel to see the result.
In the next section we're going to create an animated GIF from the result.