Tutorial: Open Data for Precision Agriculture
6. Add a high resolution elevation layer
Through the PDOK Services plugin we can also add high resolution digital elevation models (DEM). We can choose between digital surface models (DSM), which has all natural and man-made objects, or digital terrain models (DTM), which has the elevation of the terrain.
1. Zoom in to an area around our study area.
2. Go to the PDOK Services plugin dialog and add the 0.5m Digital Surface Model (DSM) in WCS format
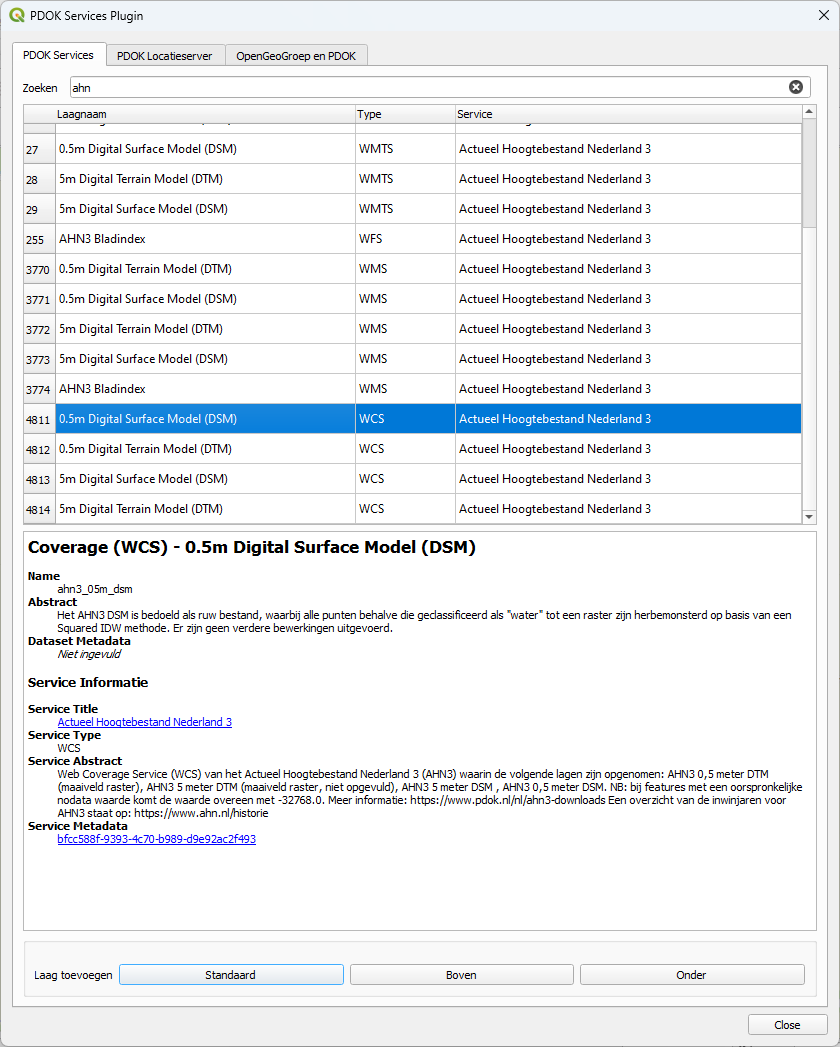
With the WCS format we get raster data that is suitable for calculations.
Let's first export the raster to a GeoTIFF that only covers our area of interest.
3. Zoom to the area of interest, a bit larger than the parcel of the coordinate.
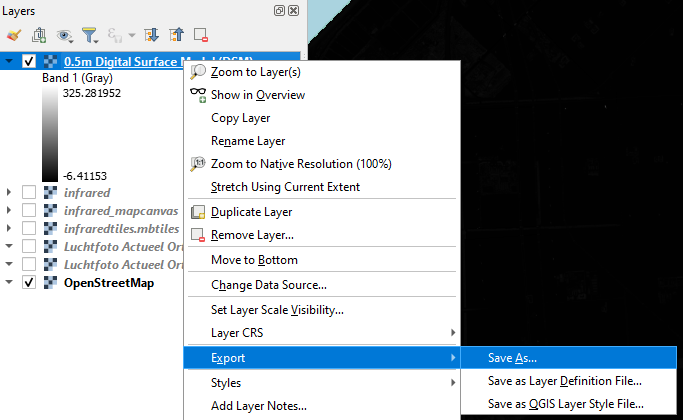
4. In the Layers panel right-click on the 0.5m Digital Surface Model (DSM) layer and choose Export | Save As... from the context menu.
5. This time use for Output mode Raw data, choose the Map Canvas Extent for Extent and save the result in your folder as dsm.tif.
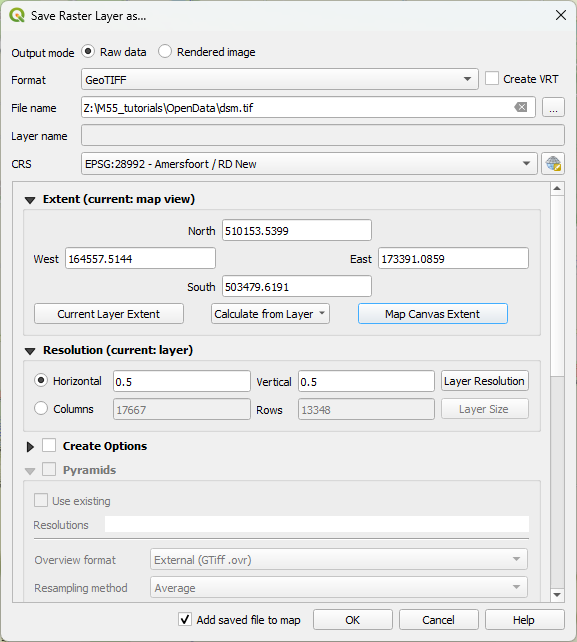
6. Click OK.
If you make the area large it can take some time. Make sure you have enough disk space for large areas.
7. Go to the Layer Styling panel. Make sure the dsm layer is the active layer and choose Singleband pseudolor as renderer.
8. Use the drop down menu at Color ramp to choose the Turbo ramp.
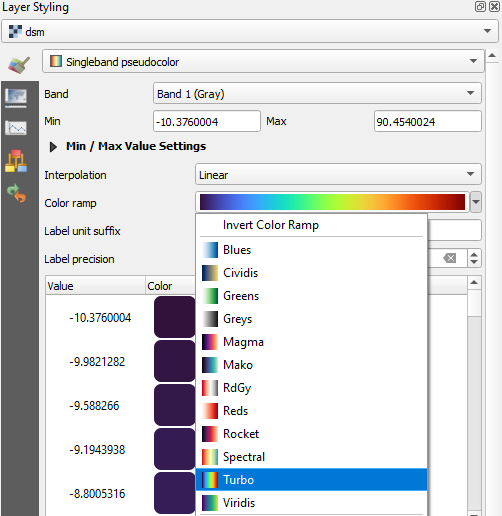
9. Expand the Min / Max Value Settings section and play around with the settings to get a good contrast in the parcels of our study area.
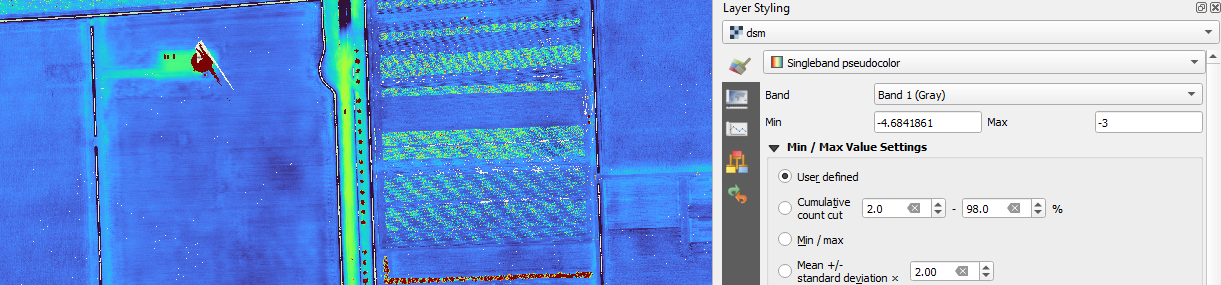
You can clearly see the trees and human-made objects. But you can also see patterns in the parcels, indicating micro relief, which affects the local drainage in the field. We can better investigate this if we look at the DTM.
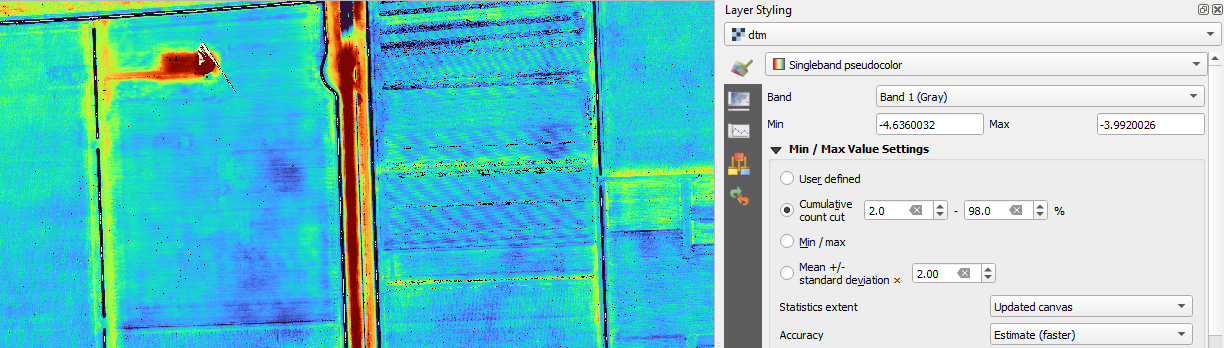
10. Go to the PDOK Services plugin and load the 0.5m Digital Terrain Model (DTM) in WCS format. Then repeat the steps so we have a styled layer that we can study.
Tips:
- When you export the layer choose for the extent to Calculate from layer and choose the dsm layer, so you have the same dimensions. Save the file as dtm.tif.
- In the Layer Styling panel try to change under Min/Max Value Settings the Statistics extent to Updated canvas. The colours will then be stretched to the min/max values of the map canvas, everytime you pan.
We can even get more detail when we download point cloud data, which we'll do in the next section.