Tutorial: Zonal statistics and area computation
2. Download a recent Sentinel 2 image
We'll start with downloading a recent Sentinel 2 image for our study area. We'll use the red and near infrared (NIR) bands in the next section to calculate NDVI. The spatial resolution of the visual and NIR bands is 10 m.
To download Sentinel 2 bands, we'll use the STAC API Browser plugin. STAC stands for SpatioTemporal Asset Catalogs. It is a standard for sharing spatio-temporal data.
1. Open QGIS Desktop with the same QGIS project from the previous tutorial. At least make sure that you have the parcels and Luchtfoto Actueel Ortho 8cm RGB layers visible in the map canvas.
2. Install the STAC API Browser plugin from the plugins manager: in the main menu go to Plugins | Manage and Install Plugins....

3. In the Toolbar, click the  icon to open the STAC API Browser dialog.
4. Choose the Microsoft Planetary Computer STAC API, Fetch collections. Choose Sentinel-2 Level-2A.
5. Check the box to Filter by date and choose a date range of the past month.
6. Check the box for Extent and use the extent of the parcels layer that you've created before.

7. Click Search.
Now you'll see the search results.You'll see a preview of the image and a description with the acquisition date and the cloud cover percentage. If you only see clouded images, extend the date range.
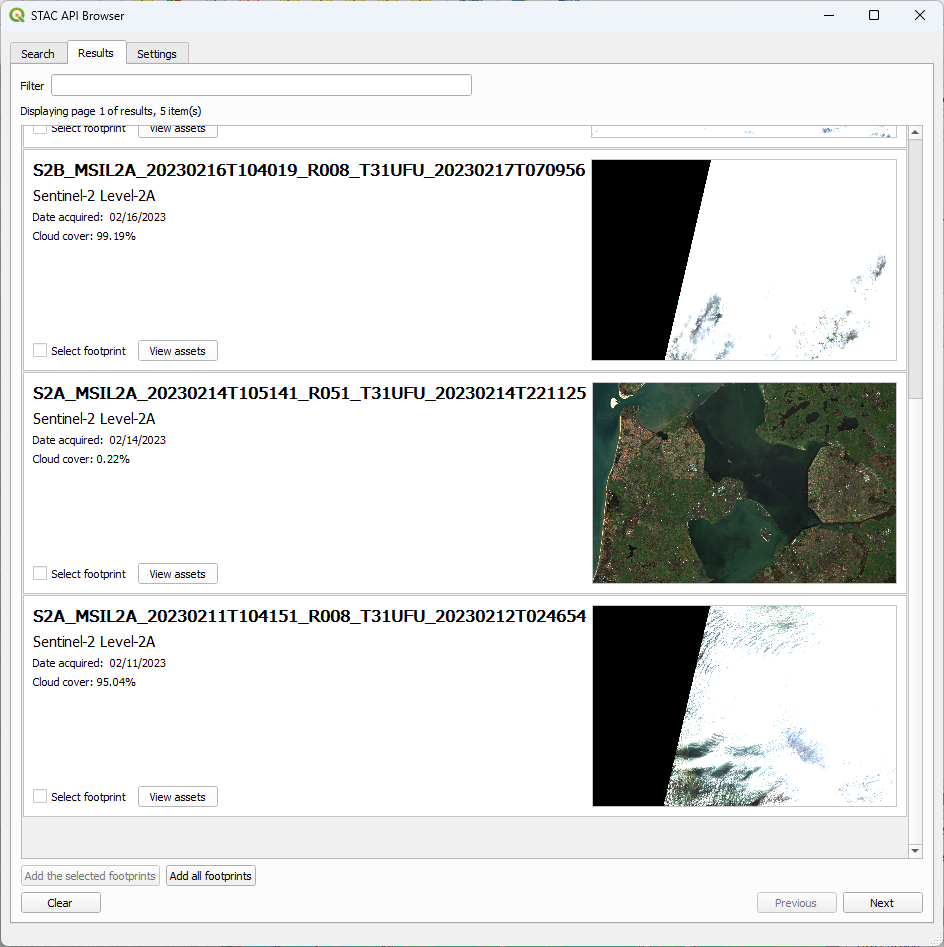
8. If you've found a useful cloudless image, click View assets.
Now you'll see the bands. For the calculation of NDVI we need the Red and Near Infrared bands, which are band 3 and 8 respectively.
9. We'll add them as temporary layers: check the boxes for Band 3 and Band 8 to Select to add as layer. Then click Add selected assets as layers (2).

10. The bands are now added to the map canvas.
Note that they are temporary layers. If you want to keep them, you should have chosen Select to download or you can make them now permanent by exporting them to a GeoTIFF on your disk.
Now we're ready to calculate the NDVI in the next section.