Tutorial: Zonal statistics and area computation
4. Calculate zonal statistics
In this section we'll use a tool from the Processing Toolbox to calculate the zonal statics from the NDVI layer using the parcel polygons. The Processing Toolbox
in QGIS provides a lot of tools for processing GIS data. Besides QGIS
tools, it also has tools from GDAL, GRASS, and SAGA that are very
useful.
1. You can activate the Processing Toolbox by choosing Processing | Toolbox from the main menu.
Now the Processing Toolbox panel shows up.
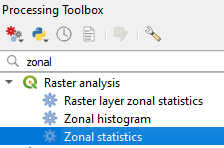
2. In the Processing Toolbox click on Raster analysis | Zonal statistics (you can use the search box to search for it):
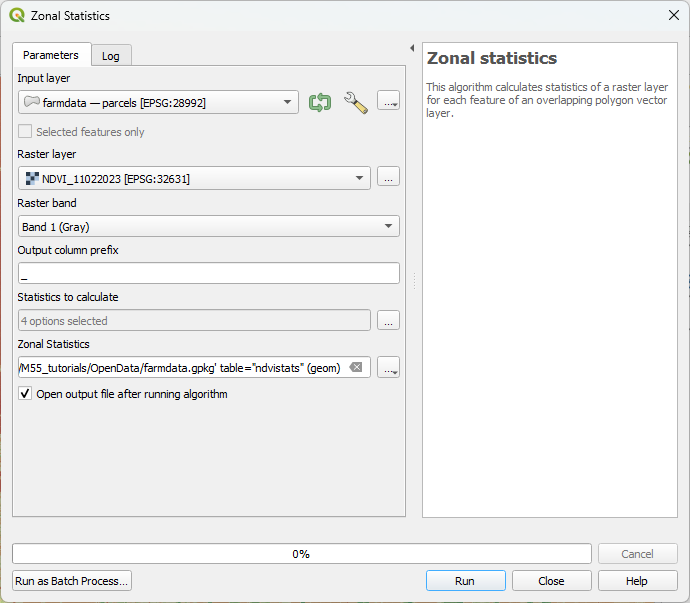
3. In the dialogue choose parcels as Input layer and NDVI_11022023 as Raster layer. We leave the Output column prefix as default.
You can use the Output column prefix if you want to add the zonal statistics of other raster layers later. Then you want use here NDVI_ and if you do it for the DEM, you'll use DEM_. In this way you can distinguish the results in the attribute table.
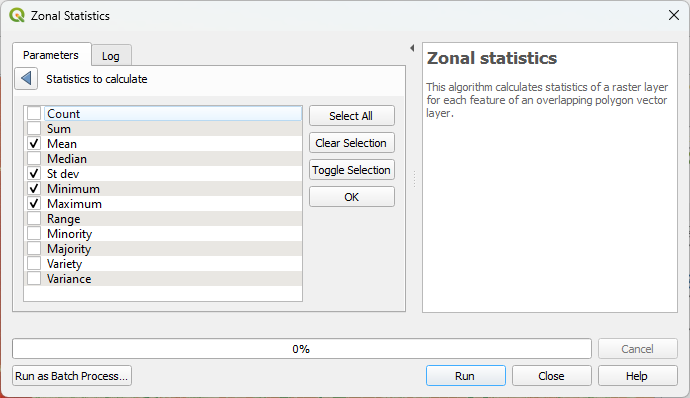
4. Click on  to choose the statistics that you want to calculate. Here choose Mean, St dev, Minimum and Maximum and click OK to return.
5.
At the Zonal Statistics field use the dropdown menu to choose Save to
GeoPackage. There browse to the GeoPackage of this project and indicate
in the popup that you want to use ndvistats as the layer name.