Tutorial: Field surveys using Mergin Maps
2. Project preparation
2.4. Adding a survey layer
Vector layers can be added as survey layer for the Input app.
In this section we'll create a survey layer for collecting ground truth for crop cover classification with remote sensing.
The following steps will be covered:
- Create a point vector layer with the necessary attributes
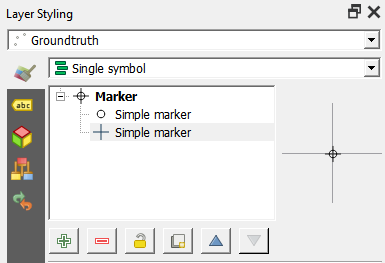
- Styling of the points
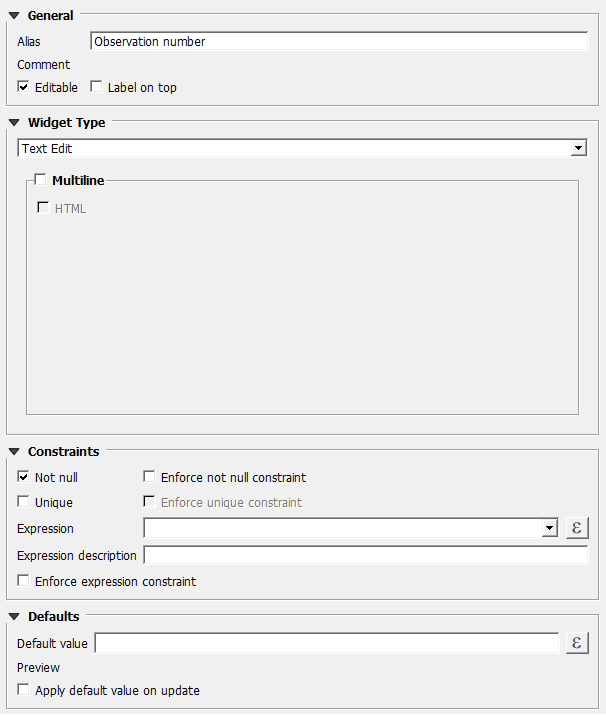
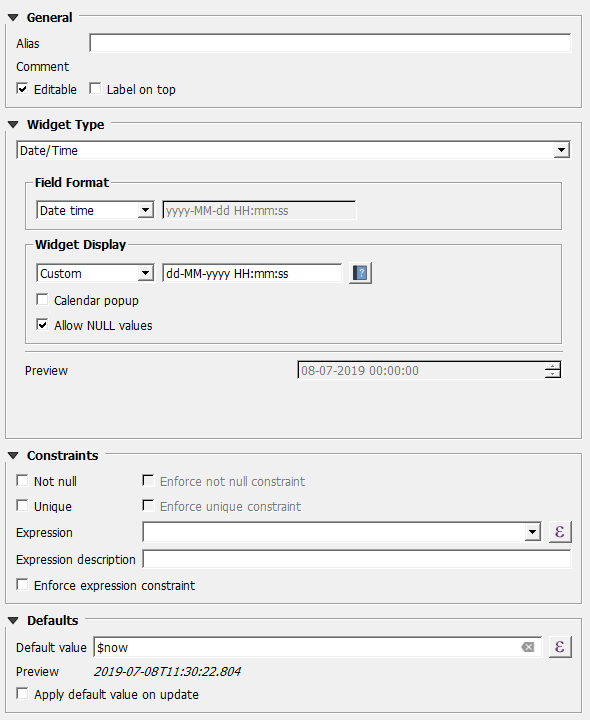
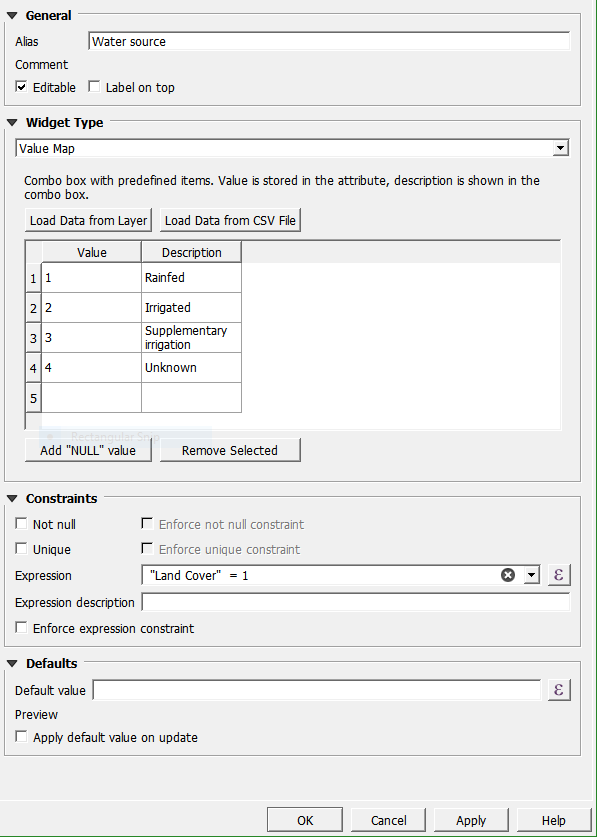
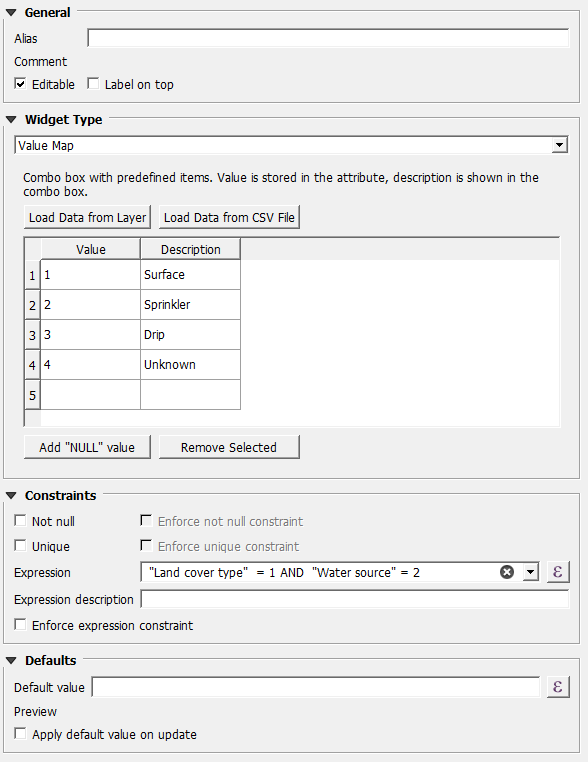
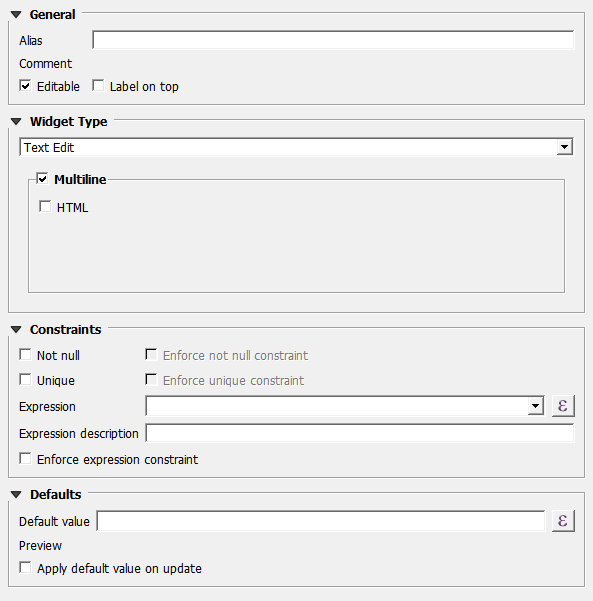
- Make an attributes form using widgets
- Settings for the Input preview panel
Create a point vector layer with the necessary attributes
1. In the Main Menu go to Layer | Create Layer | New GeoPackage Layer....

2. Click the Browse button ![]() to go to your project folder and choose the GeoPackage from the previous section, e.g. survey.gpkg.
to go to your project folder and choose the GeoPackage from the previous section, e.g. survey.gpkg.
3. For Table name type Groundtruth. For Geometry type choose Point. Make sure the projection is set to EPSG:32632.
4. Now we're going to add the attributes. A unique feature ID is automatically generated in a GeoPackage, so we don't have to add the observation ID attribute. Add the attributes like in the screenshot below. Add them by using the Add to list button.
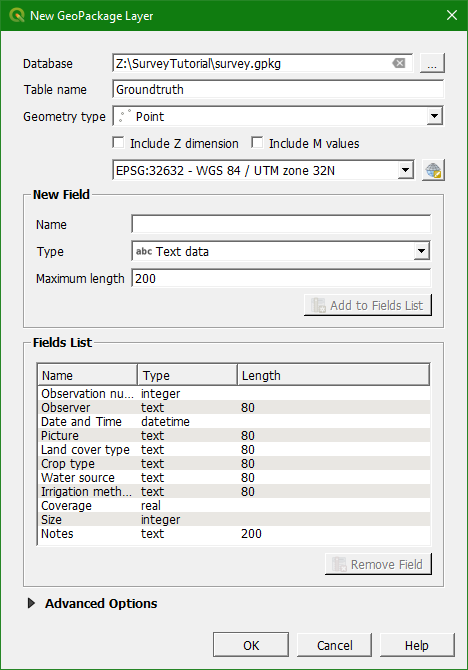
5. Click OK when done.
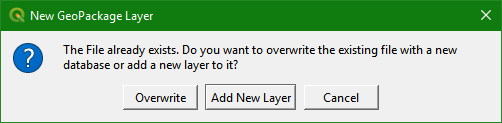
6. A popup will ask you if you want to overwrite or add a new layer. Choose Add New Layer so it will be added to the GeoPackage.
Styling of the survey points
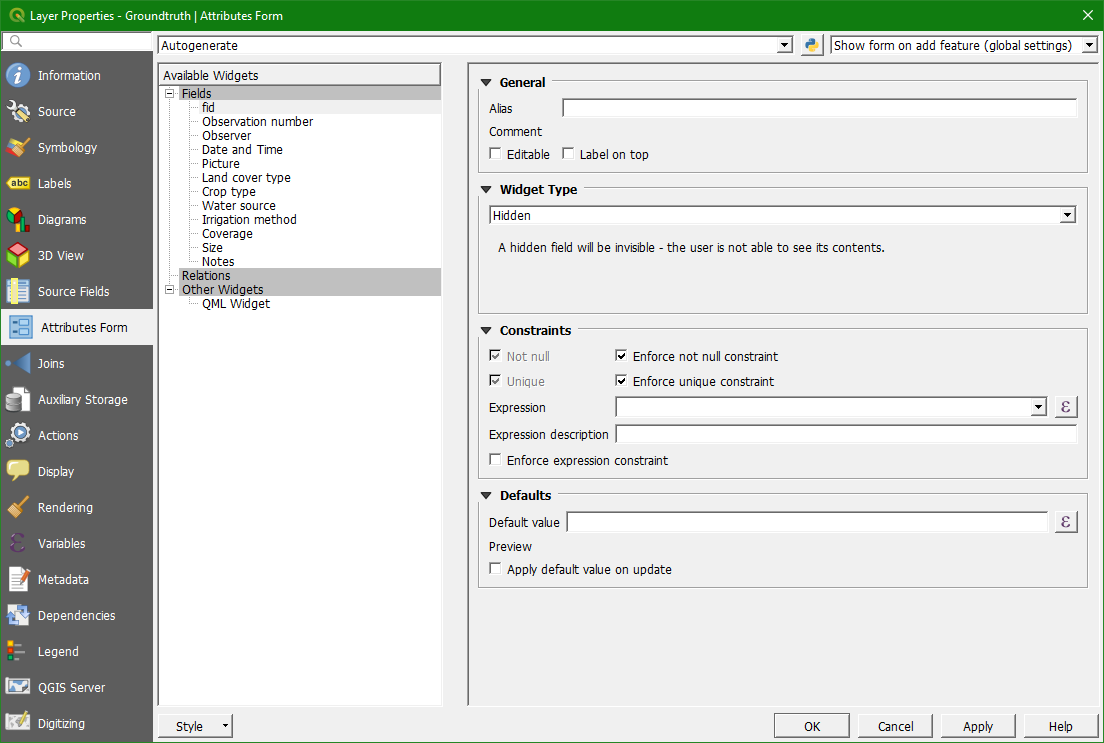
Make an attribute form using widgets
| Value | Description |
|---|---|
| 1 | Crop land |
| 2 | Tree cover |
| 3 | Shrubland |
| 4 | Grassland |
| 5 | Wetland |
| 6 | Artificial |
| 7 | Bare soil |
| 8 | Fallow land |
| 9 | Seasonal water |
| 10 | Permanent water |
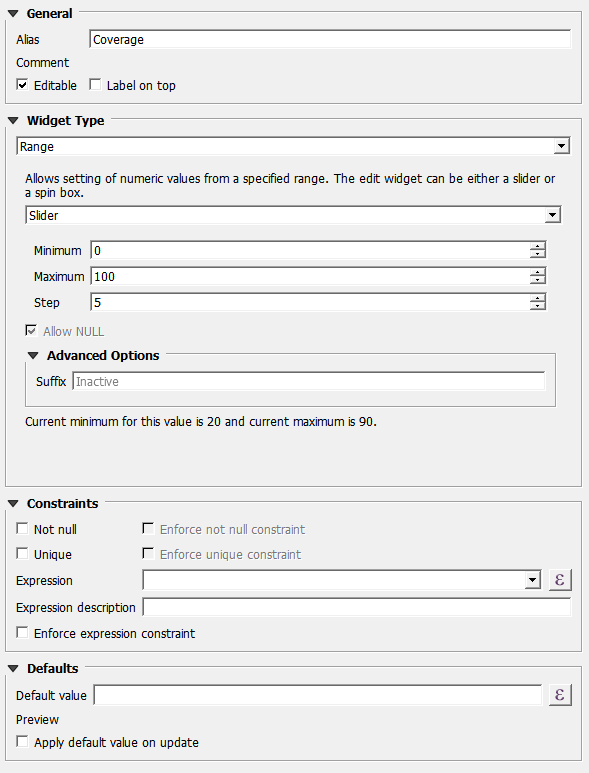
18. Set Constraints to Not null. And put the default value on 1, because for the purpose of crop mapping this will be chosen mostly.
| Value | Description |
|---|---|
| 1 | Wheat |
| 2 | Maize |
| 3 | Rice |
| 4 | Barley |
| 5 | Soybeens |
| 6 | Pulses |
| 7 | Cotton |
| 8 | Potatoes |
| 9 | Alfalfa |
| 10 | Sorghum |
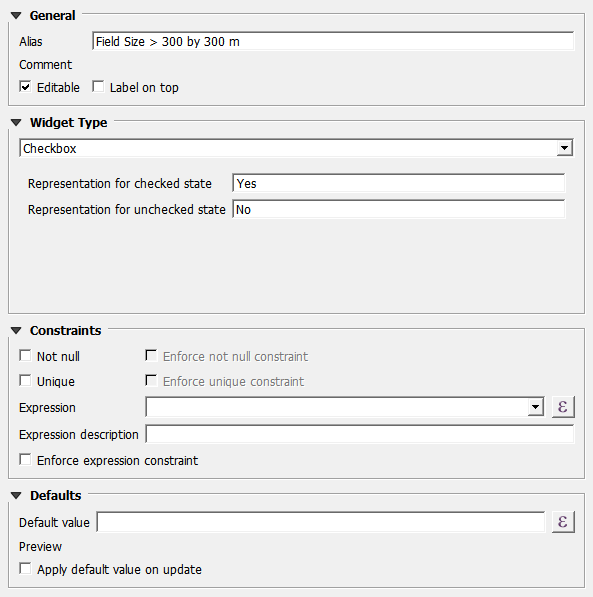
21. At Constraints write the following Expression: "Land Cover" = 1. This means that this can only be filled in when the Land Cover equals 1. By checking the box Enforce expression constraint you can prevent users to override the restriction.
Settings for the Input preview panel
Similar to Google maps, when a feature is identified on the map a
preview panel will appear. To enable a layer being identified, the
option should be enabled in QGIS desktop, under Project properties.
29. For setting the preview panel, you need to click right on the Groundtruth layer and choose Properties. Then select the Display tab.
-
title - this will use "Display Name" which can be a field name or an expression.
-
content - there are three options for what to show in content area: 1. field values, 2. image, 3. HTML. This will use "HTML Map Tip". QGIS always interprets the content of map tip as being HTML, however Input extends the syntax to allow two more modes. If the map tip is not specified, Input will try to use the first three fields and show their attribute values.
Field values
Sample map tip content that will show "description" and "time" field values:
# fields
fid
date and time
If the map tip content has # fields marker on the first line, the following lines will be understood as field names that should be listed in the preview.
At most three fields will be shown. Expressions are not allowed.
Image
Sample map tip content that will cause an image to be show specified by file path in field "image_1" (containing path relative to the project directory):
# image
file:///[%@project_folder%]/[% "Picture" %]
If the map tip has # image marker on the first line, the
following line is understood as the URL for the image. It can be a
regular file on the file system, but it could be even a remote image
from network. Expressions embedded in the image URL will be evaluated
(enclosed in [% 1+1 %]).
HTML
Sample map tip content that will show render as HTML page:
<p><strong>Notes:</strong>[% "notes" %]</p>
If the map tip does not contain any special marker, it is assumed that the map tip is HTML content. Only a limited subset of HTML is supported - see https://doc.qt.io/qt-5/richtext-html-subset.html