Tutorial Zonal Statistics and Area Computations
7. Calculate additional univariate statistics
Sometimes we're also interested in percentiles. We can calculate these easilty with the r.univar tool from GRASS which is available in the Processing Toolbox.
For this chapter we're interested in the statistics for the NDVI raster. NDVI is the Normalized Difference Vegetation Index, which is derived from satellite data to detect green vegetation cover. It has values from -1 to 1, where values larger than 0 represent vegetation cover.
NDVI in this tutorial was derived from a Sentinel 2 image of 7 May 2020 and has a spatial resolution of 10 m.
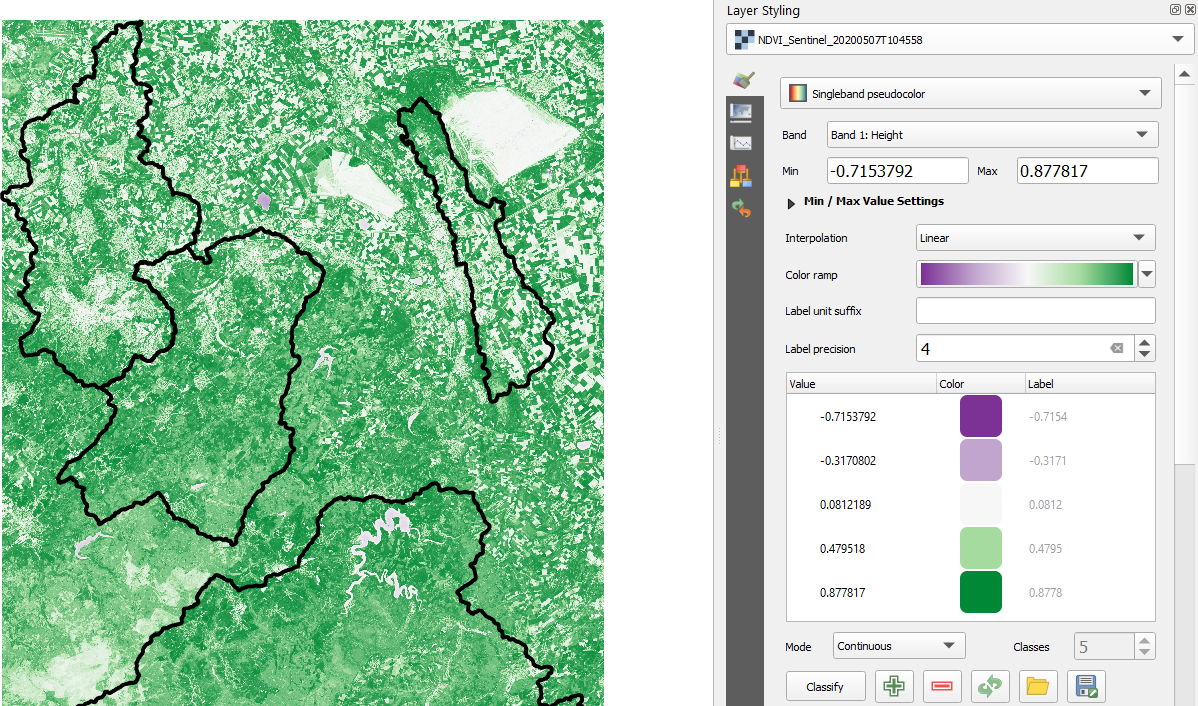
Let's first style the NDVI layer.
1. Move the NDVI_Sentinel_20200507T104558 layer to below the subcatchments_fixed layer and make sure it's visible.
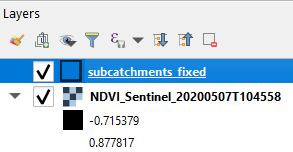
2. Select the NDVI_Sentinel_20200507T104558 layer and click  to open the Layer Styling panel.
- What raster data type is NDVI? What renderer should we use for styling?
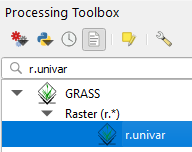
4. In the Processing Toolbox look for GRASS | Raster (r.*) | r.univar.
Note that if you can't use the GRASS tools, you need to start QGIS Desktop with GRASS as mentioned at the start of this tutorial. Only then you can use the GRASS tools in the Processing Toolbox.
5. In the r.univar dialogue make sure to set the following input:
- The NDVI_Sentinel_20200507T104558 layer should be selected as Name of raster map(s)
- Select rasterzones as Raster map used for zoning. Note that you can only have a raster with zones. It will not work with polygones.
- For Percentile to calculate type
5,99. In this way the 5th and 99th percentile will be calculated. Percentiles need to be separated by comma. - For field separator type
comma. This will be the column separator that will be used in the output text file. - Because we want to calculate the indicated percentiles we have to check Calculate extended statistics in the Advanced Parameters section.
- Write the Univariate results to a text file with the name univar_NDVI_subcatchments.txt.
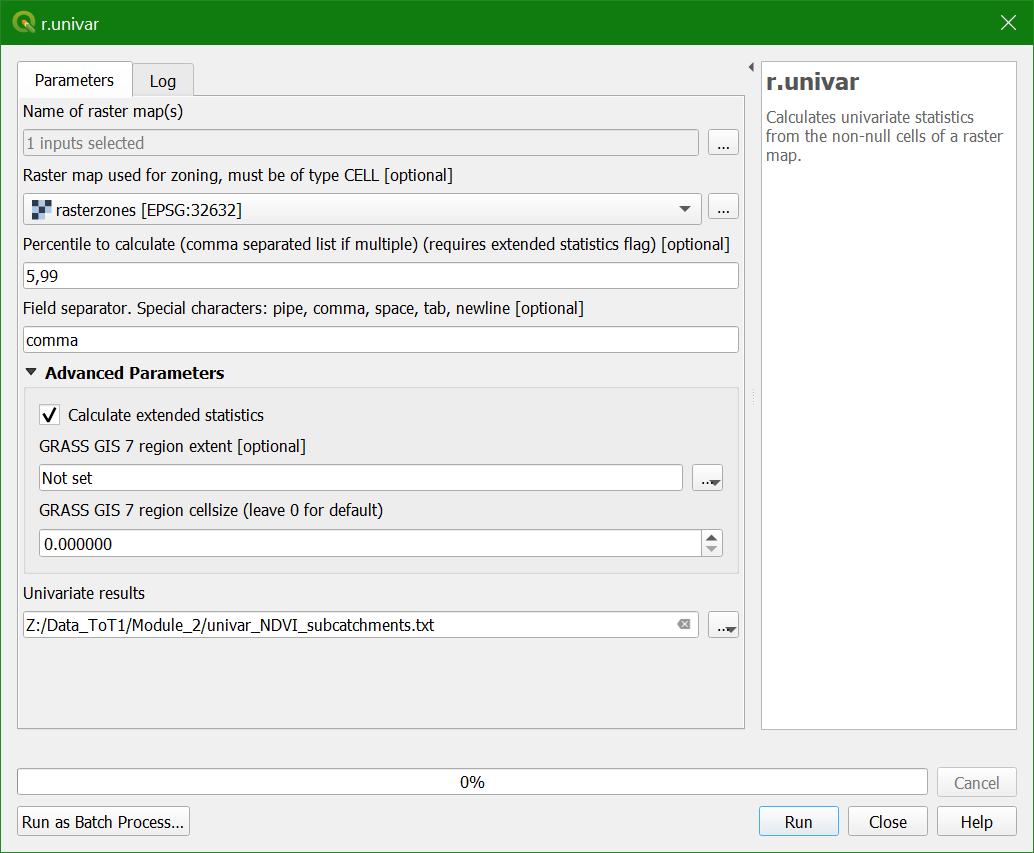
6. Click Run. Click Close after processing.
You can open the text file as comma separated file in a spreadsheet programme. Here we'll add it to our QGIS project.
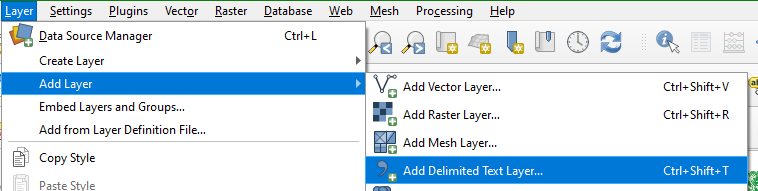
7. In the main menu go to Layer | Add Layer | Add Delimeted Text Layer...
8. In the dialogue browse to the text file. Make sure that CSV (comma separated values) is chosen under File Format. And because our table is non-spatial we need to indicate that under Geometry Definition by selecting No geometry (attribute table only).
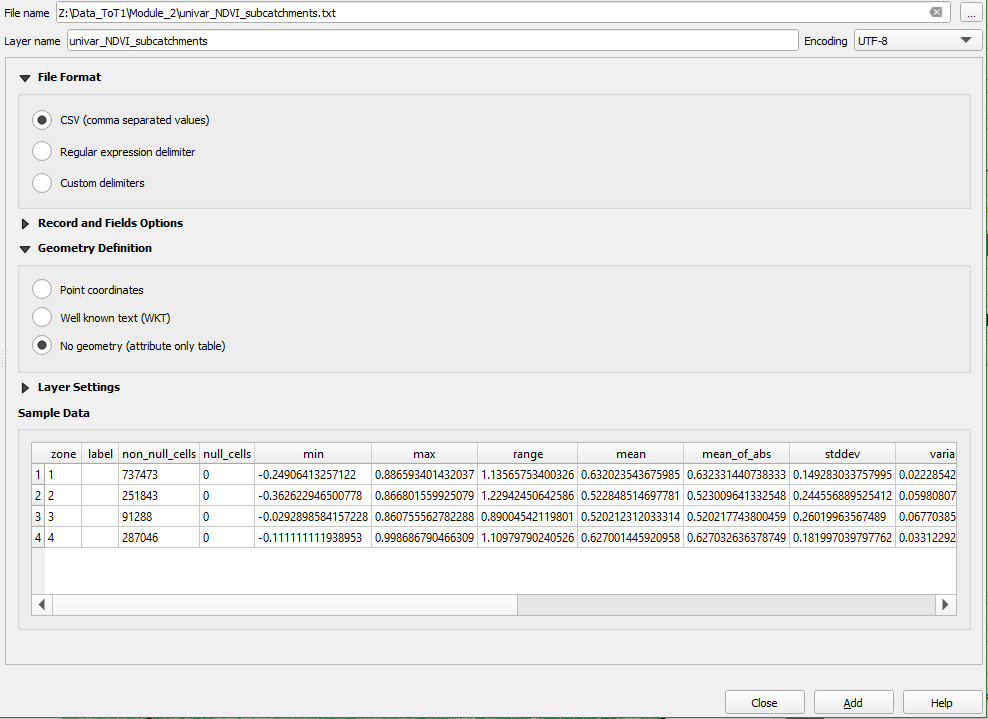
9. If the preview under Sample Data looks good, click Add to add the table to the Layers panel and click Close to close the dialogue.
10. Open the attribute table and interpret the results.
11. Repeat the procedure to get the NDVI statistics per land-cover class.