Tutorial Zonal Statistics and Area Computations
5. Zonal statistics with two raster layers
5.2. Raster layer zonal statistics
We're going to use another tool from the Processing Toolbox, called the Raster layer zonal statistics tool.
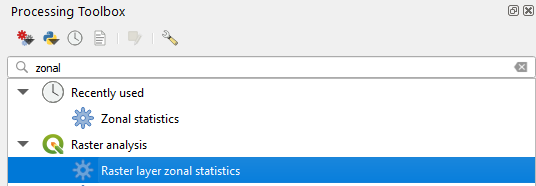
1. Go to the Processing Toolbox and look for Raster analysis | Raster layer zonal statistics.
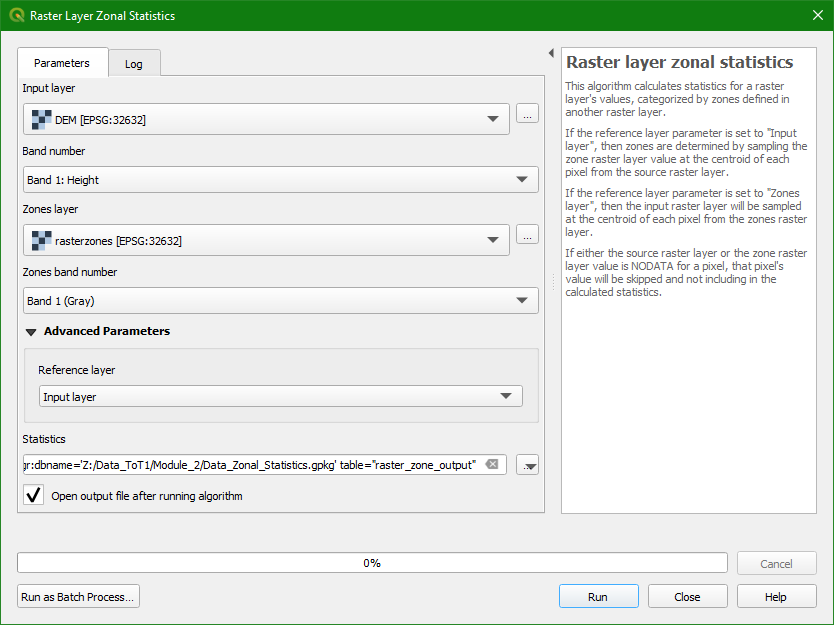
2. In the Raster Layer Zonal Statistics dialogue choose DEM as Input layer from which we want to calculate the statistics. Choose rasterzones as the Zones layer with the classes that we want the statistics for. Under Advanced you can choose if you want to use the Input layer or the Zones layer as the Reference layer for the centroids of the pixels used for the sampling. In our case we can keep it on Input layer. Note that if either the Input layer or the Zones layer has NODATA pixels, these will not be included in the statistics calculations. Save the Statistics layer to the GeoPackage with the layer name raster_zone_output and click Run.
3. Click Close to close the dialogue.
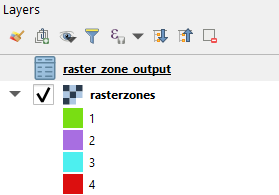
The result is a non-spatial table that has been added to the Layers panel.
Let's check the contents.
4. Click right on raster_zone_ouput in the Layers panel and choose Open Attribute Table.
- Which statistics are reported by the tool?
- Are the values the same as with the Zonal statistics tool that we have used before?