Tutorial: Create a groundwater level map from borehole data and a DEM
14. Derive groundwater contours
We'll continue with the IDW result and will add contour lines.
An easy and quick way to visualise contour lines is to use the Contours renderer in the Layer Styling panel.
1. Make sure that the GW_level_IDW layer is completely visible in the map canvas.
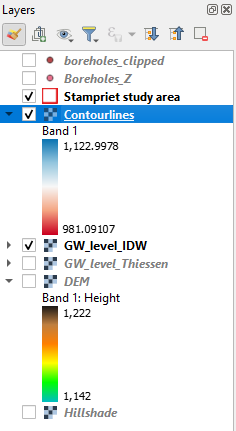
2. Duplicate the layer, rename it to Contourlines and drag it above the GW_Level_IDW layer. Also check the box to make the layer visible.
2. In the Layer Styling panel change the renderer from Singleband pseudocolor to Contours.
3. Change the Contour Interval to 5 m and the Index Contour Interval to 25 m. Change the Contour Symbol to gray.
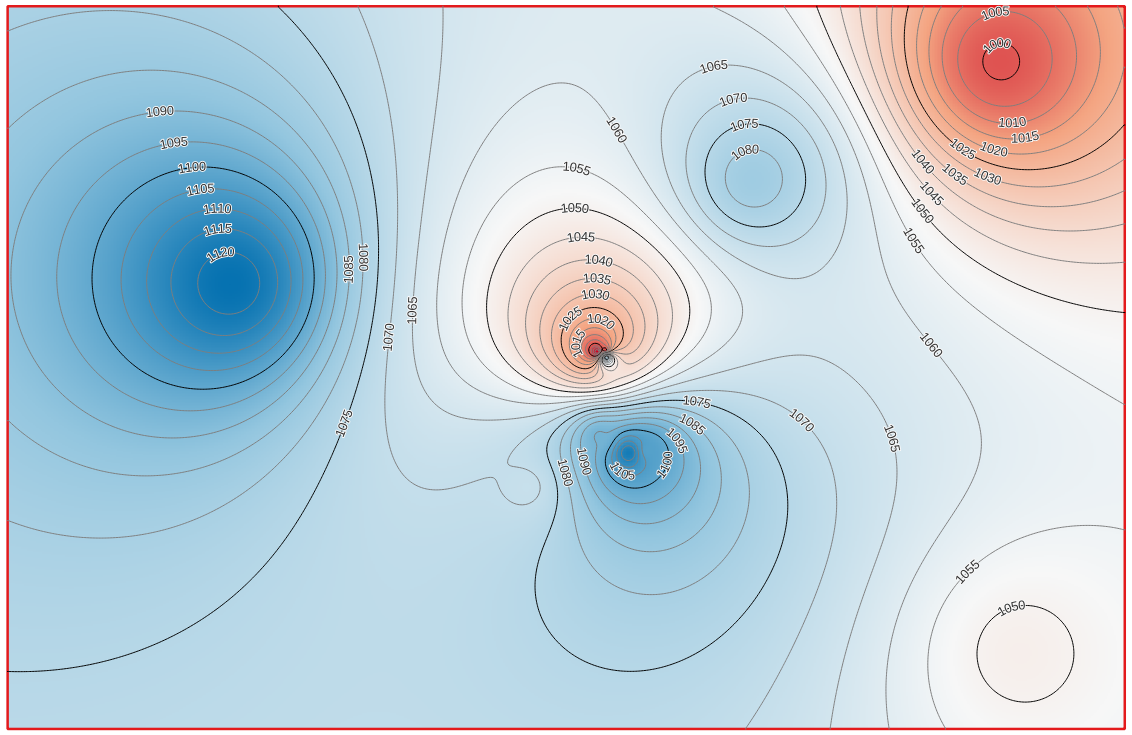
The map canvas should now look like this:
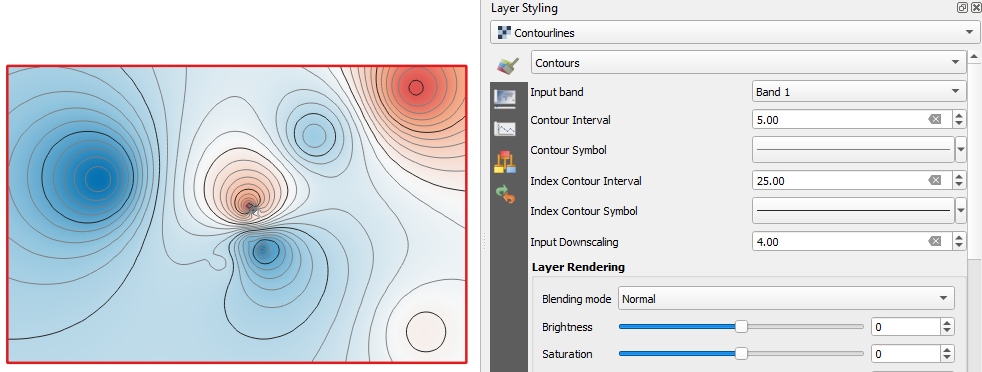
With the Input Downscaling setting you can change the smoothness of the lines. In this case the default is already smooth.
This is nice for visualisation, but not for calculations. Furthermore, we miss the labels with values of the contour lines. So, let's create a layer with contour lines.
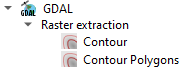
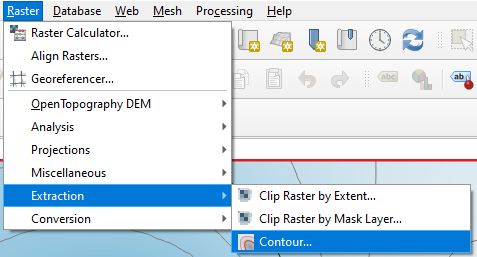
4. Choose from the main menu Raster | Extraction | Contour....
5. Choose the GW_level_IDW as Input layer, change the Interval between contour lines to 5 m. Set the Attribute name to Z. Keep the rest as default and save the result as a shapefile with the name contours.shp. Note that you can't save the layer into an existing GeoPackage.
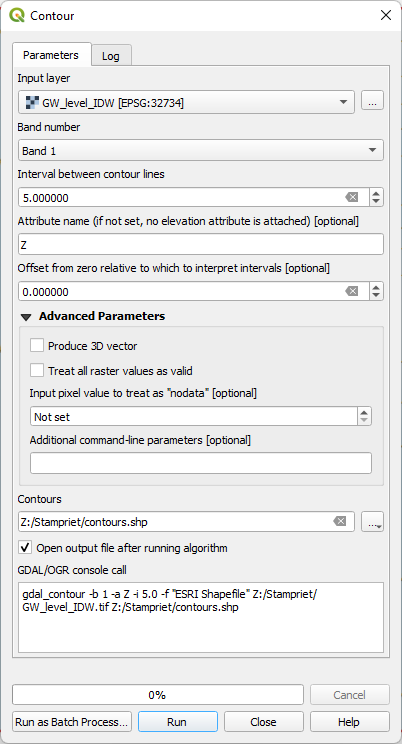
6. Click Run. Click Close after processing.
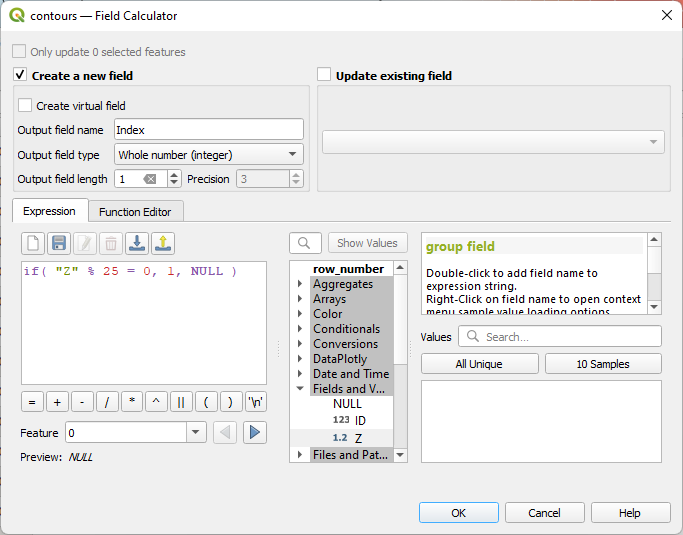
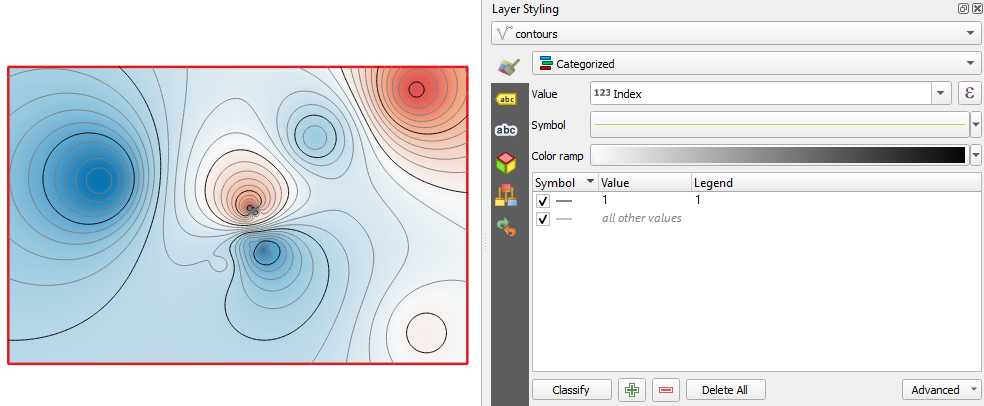
Let's style the calculated contour lines in the same way as the rendered lines.
if( "Z" % 25 = 0, 1, NULL )
 tab.
tab. tab. Change the Mode to Curved, check the On line box and uncheck the Above line box.
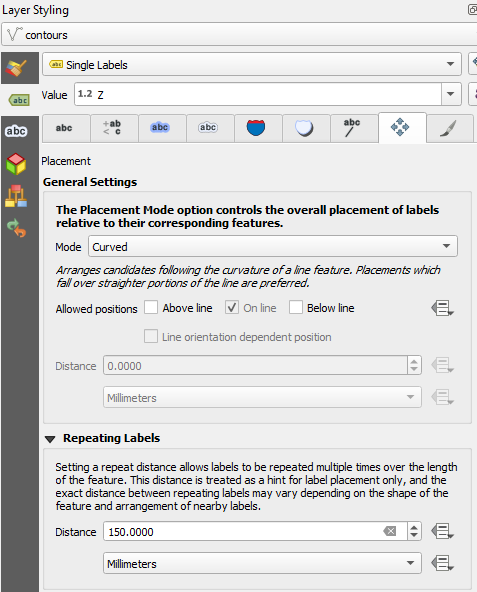
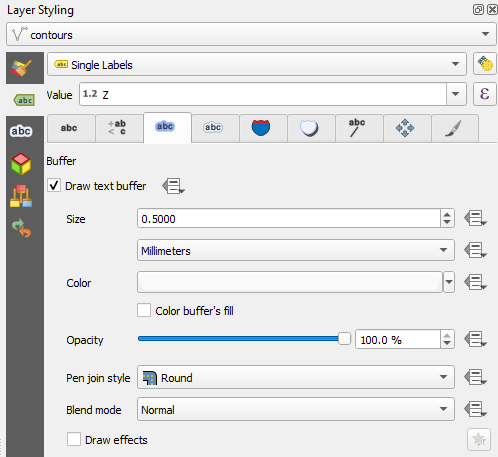
 tab. Check the box to Draw text buffer and set it to 0.5 mm. This makes the labels more readable through the contour lines.