Tutorial: WebODM
9. Viewing results in WebODM in 2D
9.5. View surface model in 2D
In the 2D View we can also visualise the derived DSM
1. In the upper right of the screen click on Surface Model.

This will show the DSM of the area:
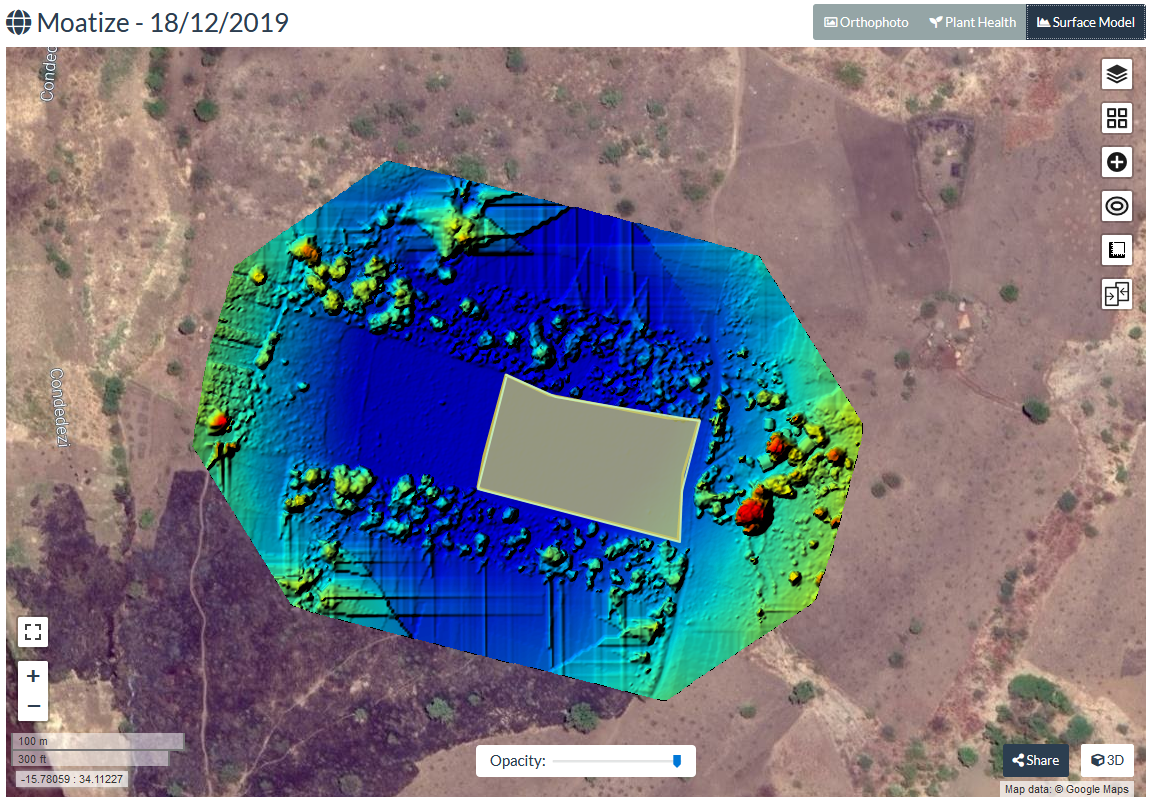
Now part of our view is covered by the polygon of our field of interest. Let's hide it.
2. Click on the  icon.
icon.
Here we can control which layers to visualise. We can for example switch off the polygon (maize_plot.zip) and add the camera locations where the drone made the pictures.
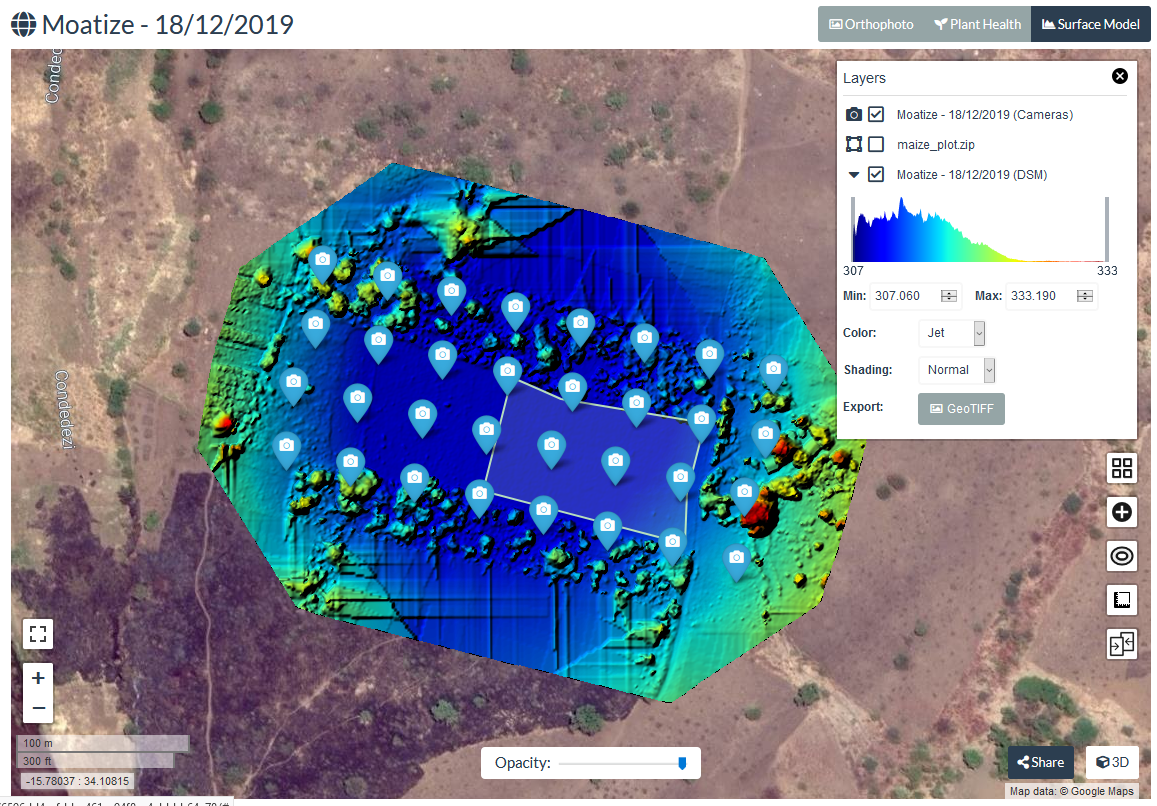
It also shows the elevations in a frequency histogram.
Under Color you can choose different colour ramps. With Shading you can change the shading of the elevation. You can also export the image as a GeoTiff to use in GIS.
3. Play with the color and shading settings.
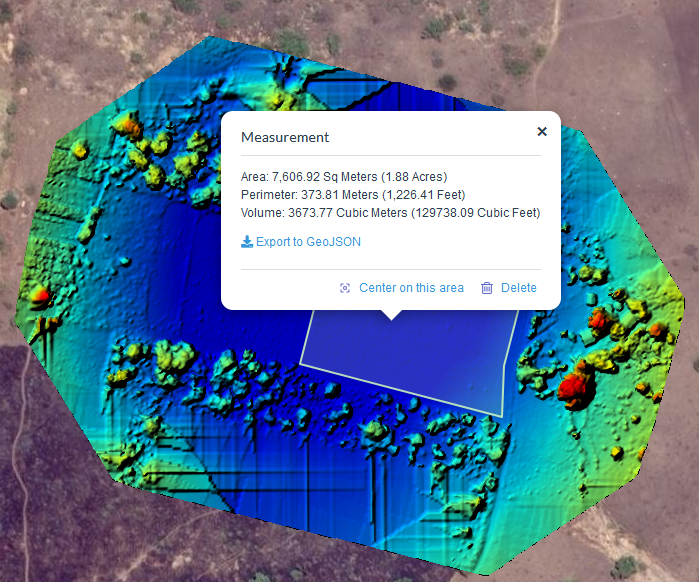
4. Delete the measurement polygon that we have created earlier by clicking on it and choosing delete in the popup.
5. If you're happy with the result, you can click  to share the link with others. People with the link can only view your result in an interactive way.
In the next chapter we'll explore the 3D View.