Tutorial - crop monitoring using vegetation indices
This tutorial takes you through different steps from extracting different vegetation indices from RGB drone images in WebODM to further analysis in QGIS.
2. Theory
Vegetation indices are widely used to understand the vegetation coverage in the study area. For applications related to precision agriculture, it gives information about crop health and growth parameters.
The most common vegetation index in Normalized Difference Vegetation Index which is computed using the Red and Near InfraRed (NIR) reflectance bands. The NDVI is computed using the following equation: NIR - Red/NIR + Red
However the drone flights we used for monitoring Maize field in Moatize has only RGB camera, which means there is NO NIR spectral images available for these flights dated 18/12/2019 and 22/01/2020.
There are vegetation indices computed from Red, Green and Blue (RGB) bands. In this tutorial we will cover the following vegetation indices as shown in the below figure:
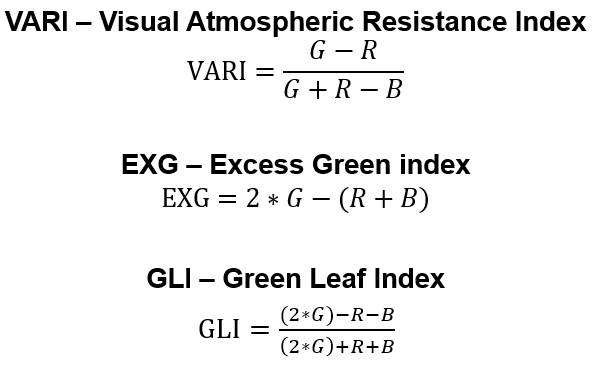
Read more about these indices in these papers:
VARI
Gitelson, A. A., Kaufman, Y. J., Stark, R., and Rundquist, D. (2002). Novel algorithms for remote estimation of vegetation fraction. Remote Sens. Environ. 80, 76–87. doi: 10.1016/S0034-4257(01)00289-9
EXG
Woebbecke, D. M., Meyer, G. E., VonBargen, K., and Mortensen, D. A. (1995). Color indices for weed identification under various soil, residue, and lighting conditions. Trans. ASAE 38, 259–269. doi: 10.13031/2013.27838
GLI
Louhaichi, M., Borman, M. M., and Johnson, D. E. (2001). Spatially located platform and aerial photography for documentation of grazing impacts on wheat. Geocarto Int. 16, 65–70. doi: 10.1080/10106040108542184