Tutorial - crop monitoring using vegetation indices
This tutorial takes you through different steps from extracting different vegetation indices from RGB drone images in WebODM to further analysis in QGIS.
3. Vegetation Indices in WebODM
3.1. Generate vegetation indices
1. Visualizing maps in WebODM
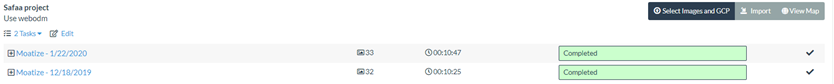
Once the processing of both date images (18/12/2019 and 22/01/2020) are finished the WebODM interface will look like the following screenshot:
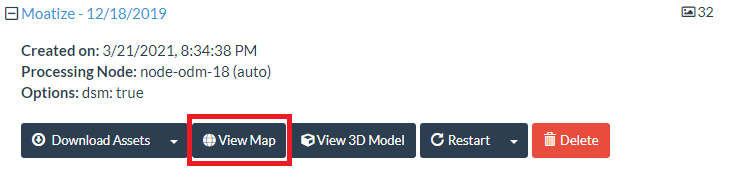
Now lets go to the task - "Moatize - 12/18/2019" and open the "View Map" to open the 2D map interface.
In the 2D map interface on the right top, you will see three tabs: "Orthophoto", "Plant Health" and "Surface Model". By default the interface opens with "Orthophoto" selected.
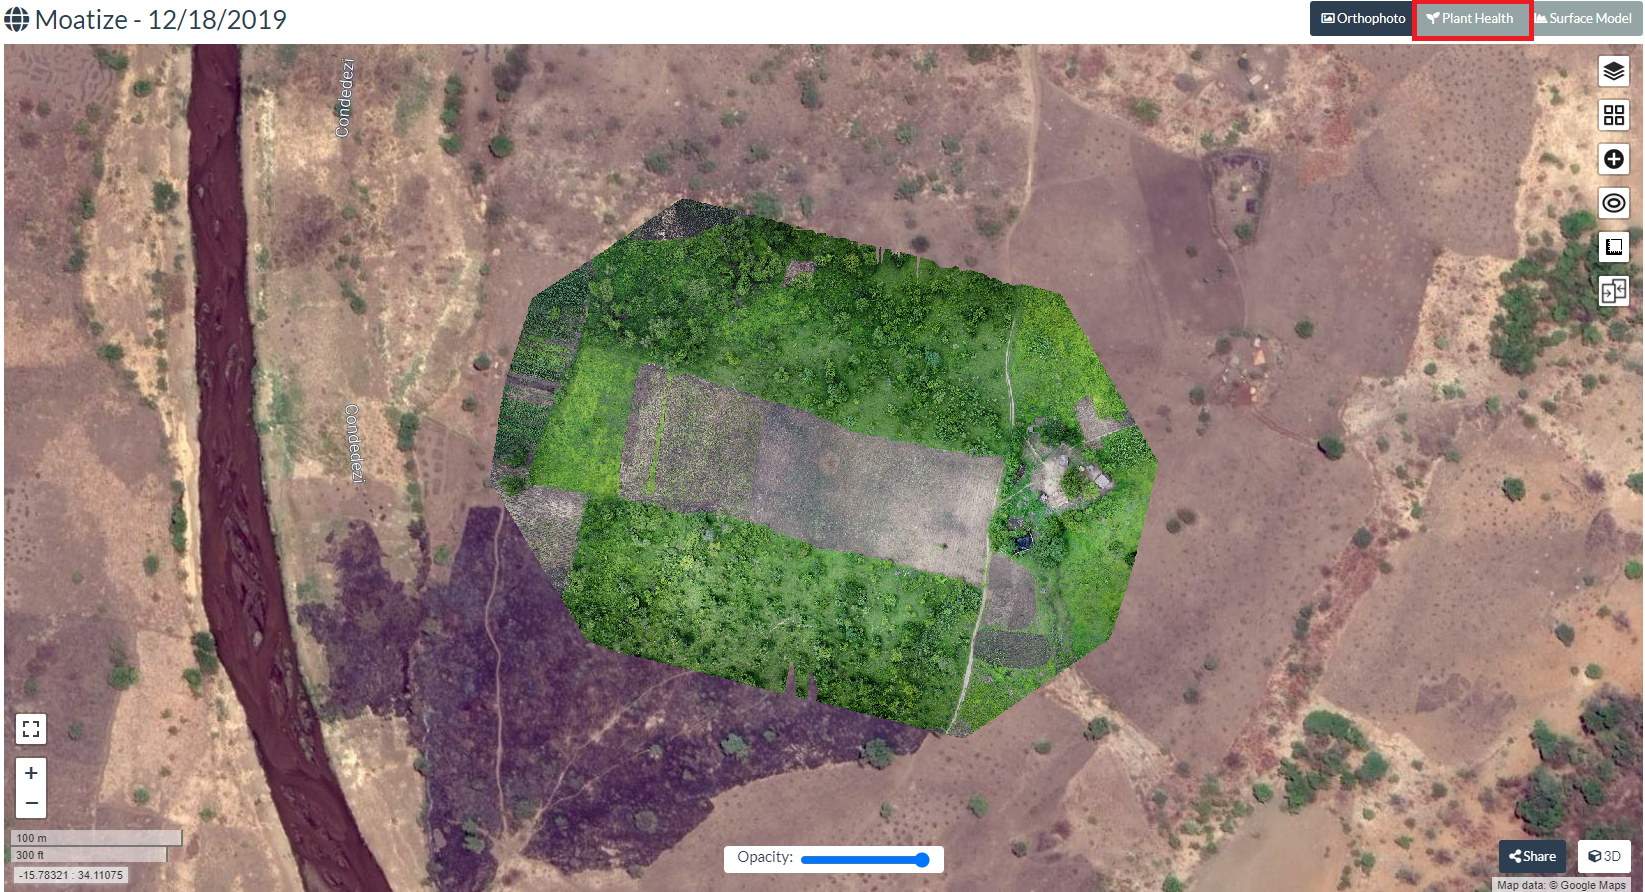
From the above window select "Plant Health" tab to generate various Vegetation indices.
2. Vegetation indices in WebODM
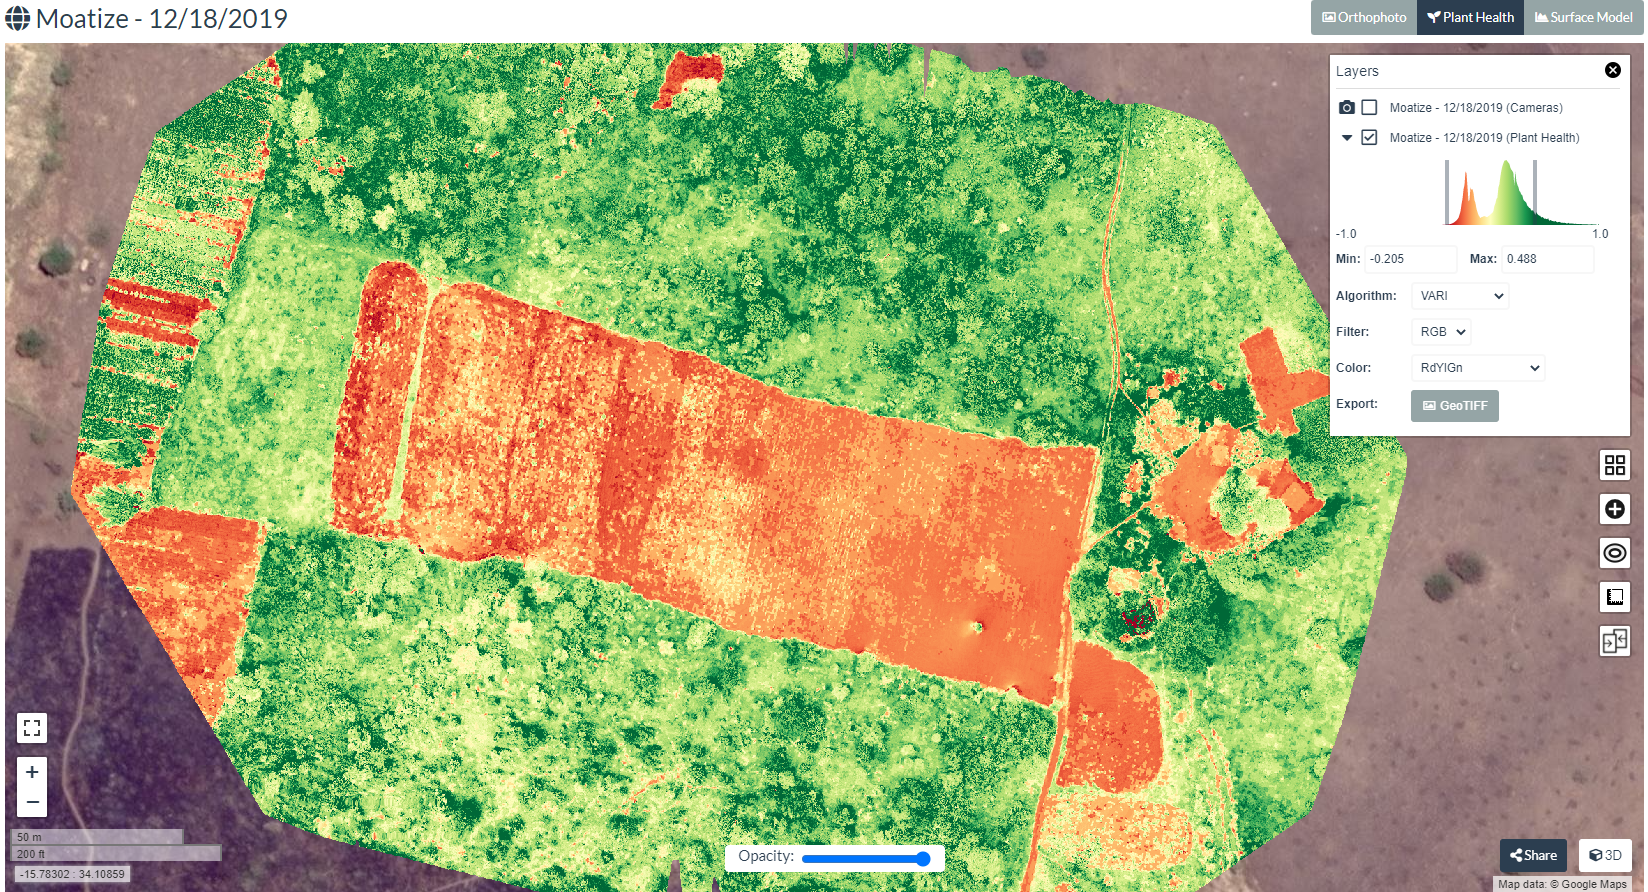
Once you select "Plant Health" you will see the below map which by default the NDVI index generated by WebODM. However as there is no NIR band let us explore other indices as explained before. Click on  icon for layer manager and also where you can select various indices.
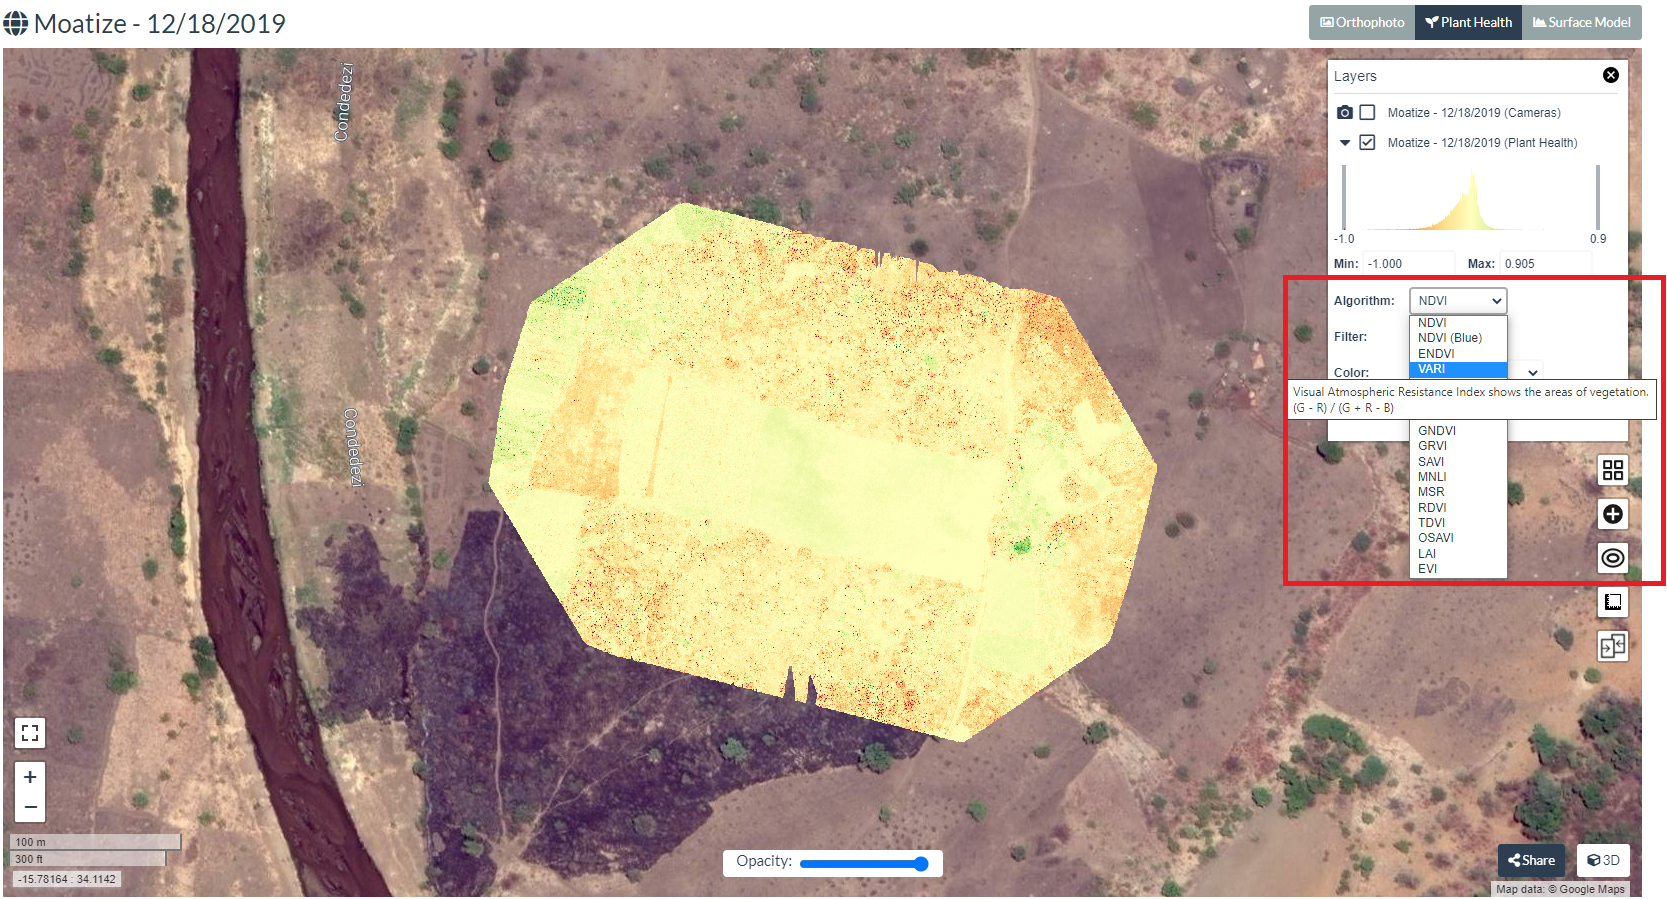
As shown in the above screenshot select the index from the drop down which will be generated and visualized in the map upon selection. Select VARI to generate and visualize this index. Note that as you hover the drop down the equation behind each index is displayed.
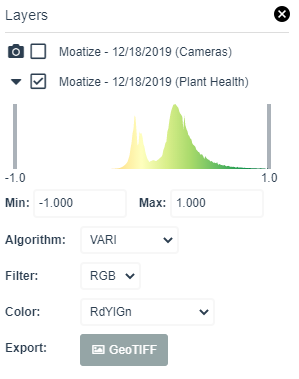
Adjust the color palette to increase the contrast to see the heterogeneity in the field. Adjust the two bars in the color histogram to stretch or sharpen the colors. Map after adjusting the color palette is shown below.