Tutorial - crop monitoring using vegetation indices
This tutorial takes you through different steps from extracting different vegetation indices from RGB drone images in WebODM to further analysis in QGIS.
4. Analyzing vegetation index in QGIS
4.1. Clip the vegetation index
1. Visualize VARI geotiff raster image in QGIS
Open "QGIS with GRASS GIS" by clicking on the following logo in the programs.
![]() (Note that the following steps should work other QGIS versions as well (greater than version 3.12)
(Note that the following steps should work other QGIS versions as well (greater than version 3.12)
Once the QGIS is open, start a "New Empty Project"
"Open Data Source Manager" in QGIS using the  icon
icon
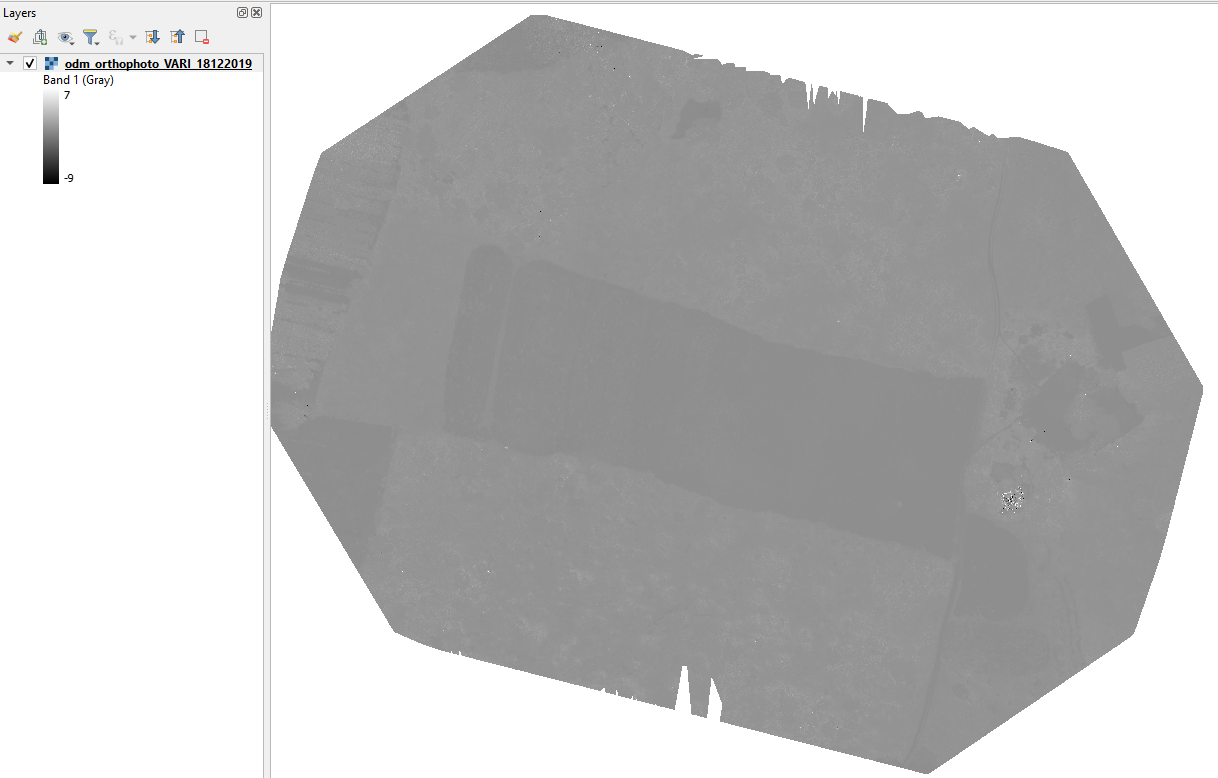
Select  on the left side and browse to the folder where the VARI GeoTIFF file is saved, click "Add" to see the VARI image in Map view in QGIS.
The VARI image will appear in gray scale as shown below:
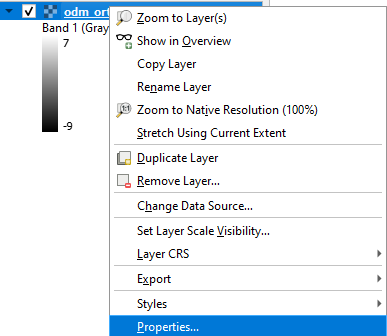
Change the styling:
- Right click on the VARI image in the Layer manager and select properties.
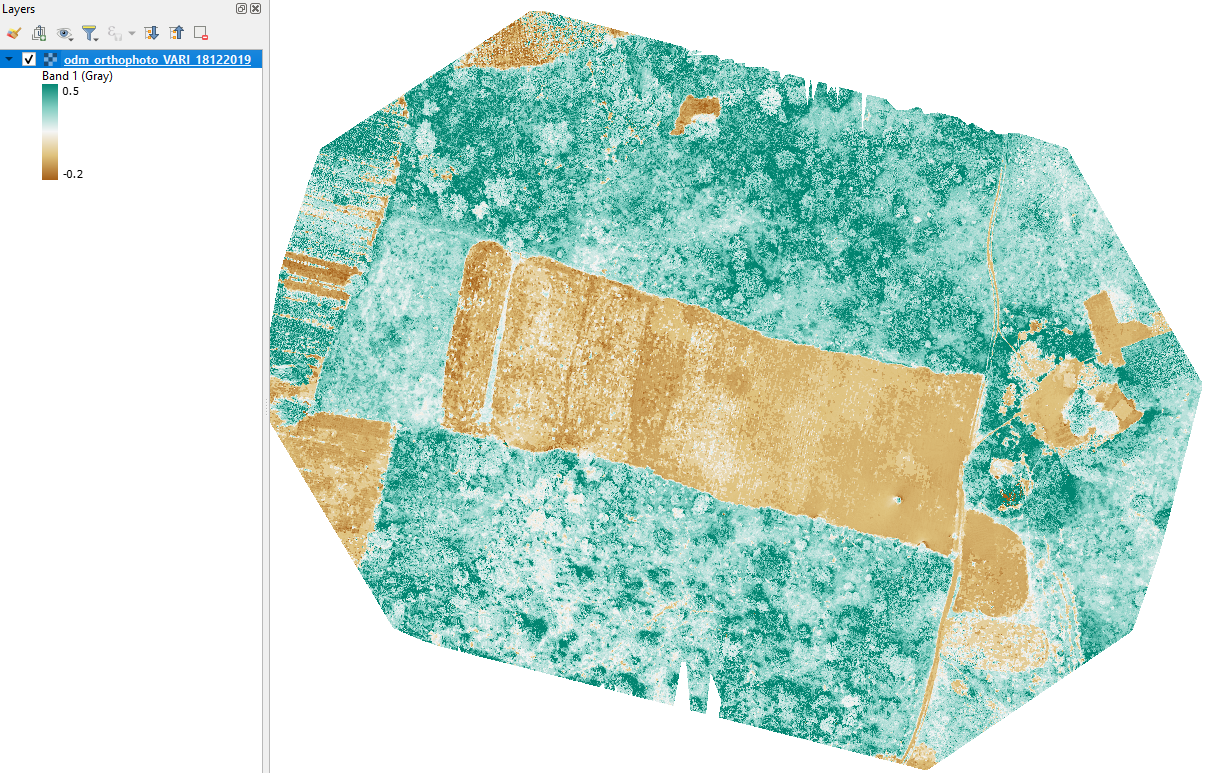
- In the properties panel select "Symbology" tab on left side. Select Render type as "Singleband pseudocolor". Change the Min and Mac values to -0.2 and 0.5. Select the color ramp you prefer and click on "Classify" to set values to palette. Once the settings are done, click on "Apply"
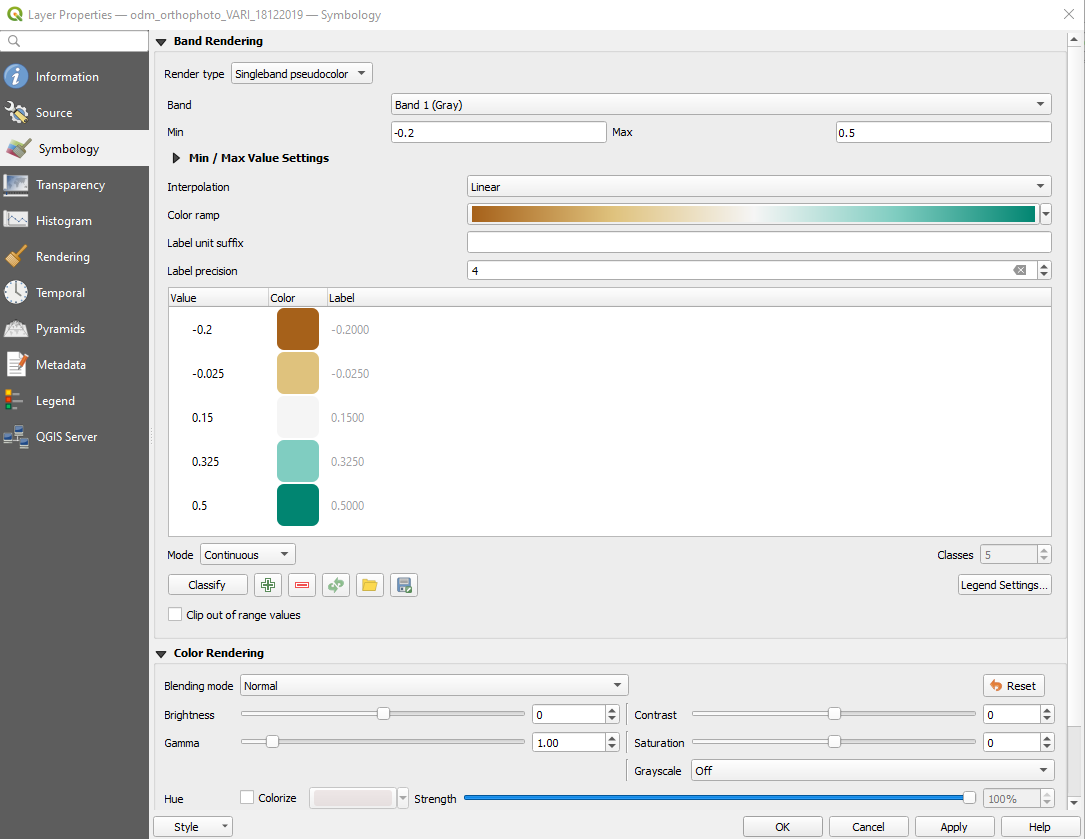
Here is the VARI map after applying the symbology:
2. Clip VARI to Maize field
Next step would be to clip the VARI image to Maize field boundary. Follow the steps explained in video below:
3. Your tasks
Perform these steps for EXG and GLI indices for the date 18/12/2019