Tutorial: Create a groundwater level map from borehole data and a DEM
10. Compare reported elevation with DEM values
In the Boreholes_Z attribute table we have the reported elevation and the values from the DEM. Let's compare the two fields by making a scatter plot.
The elevation field contains a lot of no data values. Let's not consider those for the scatter plot.
1. Open the attribute table of Boreholes_Z.
2. Click the Select by attributes button  .
.
3. Write the expression
"elevation" < 0

4. Click Select Features and click Close to close the dialogue.
10 features have been selected. We could remove them from the attribute table by toggling to editing mode and click the trash bin. For the scatter plot, however, we can invert the selection and indicate we only want to use the selected features.
5. Click  to invert the selection.
To make the scatter plot we need to install the Data Plotly plugin.
6. Install the Data Plotly plugin from the Plugins manager.

7. Click the  icon in the toolbar to open the Data Plotly panel.
8. In the Data Plotly panel choose Scatter Plot as Plot type. Choose Boreholes_Z as Layer. Check the box to Use only selected features. Choose elevation for the X field and Z for the Y field. Keep the styling as default.

9. Click  to go to legend configuration tab.
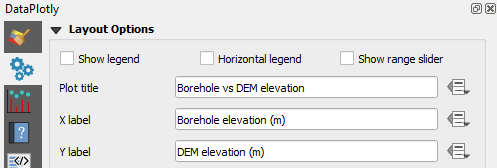
10. Uncheck the Show legend box. Change the Plot title to Borehole vs DEM elevation. Write Borehole elevation (m) for the X label and DEM elevation (m) for the Y label. Keep the rest as default.
11. Click Create Plot at the bottom of the panel.
Check the plot.

In the next section we're going to replace the missing values of elevation with the DEM elevations.