Tutorial: Create a groundwater level map from borehole data and a DEM
13. Interpolate groundwater levels in boreholes to a raster
Now we have the groundwater levels in the boreholes we can interpolate the points to a raster.
We're going to use two methods: Inverse Distance Weighting (IDW) and Thiessen polygons.
Let's start with the IDW interpolation.
1. In the Processing Toolbox choose Interpolation | IDW interpolation.

2. In the IDW Interpolation dialogue choose the Boreholes_Z layer as Vector layer. Use the GW_level_m as Interpolation attribute. Click  to add these settings to the list. Keep the Distance coefficient P at 2 for an exponential decay function. Select the Extent from the Stampriet study area layer. Change the Pixel size to 30 m. Save the Intepolated raster to the project folder as GW_level_IDW.tif.
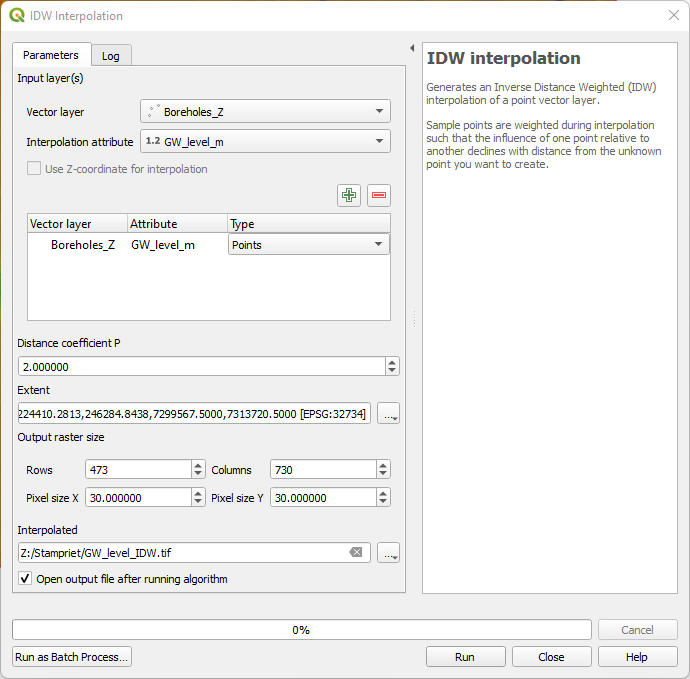
3. Click Run. Click Close after processing.
Let's style the result with a colour ramp.
4. Select the GW_level_IDW layer in the Layers panel and click  to open the Layer Styling panel.
5. In the Layer Styling panel change the renderer to Singleband pseudocolor and choose All Color Ramps | RdBu

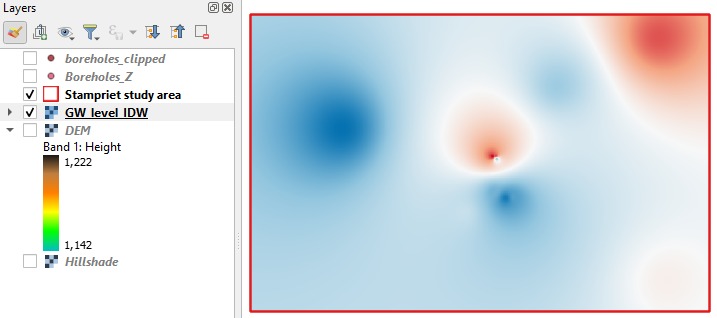
The Layer Styling panel should now look like this.

And
the interpolated layer should look like the figure below. You can play
with different ramps and classes to improve the visualisation. You can
see the the IDW interpolator creates a smooth output, but because the
amount of boreholes is low there's a lot of bias towards individual
boreholes and outliers.
Let's apply the Thiessen polygon (aka nearest neighbour or Voronoi tesselation) method now.
6. In the main menu choose Raster | Analysis | Grid (Nearest Neighbor).

7. In the Grid (Nearest Neighbor) dialogue choose the Boreholes_Z layer as Point layer. Under Advanced choose GW_level_m as Z value from field. Save the Interpolated (Nearest Neighbor) output to GW_level_Thiessen.tif. Keep the rest as default.
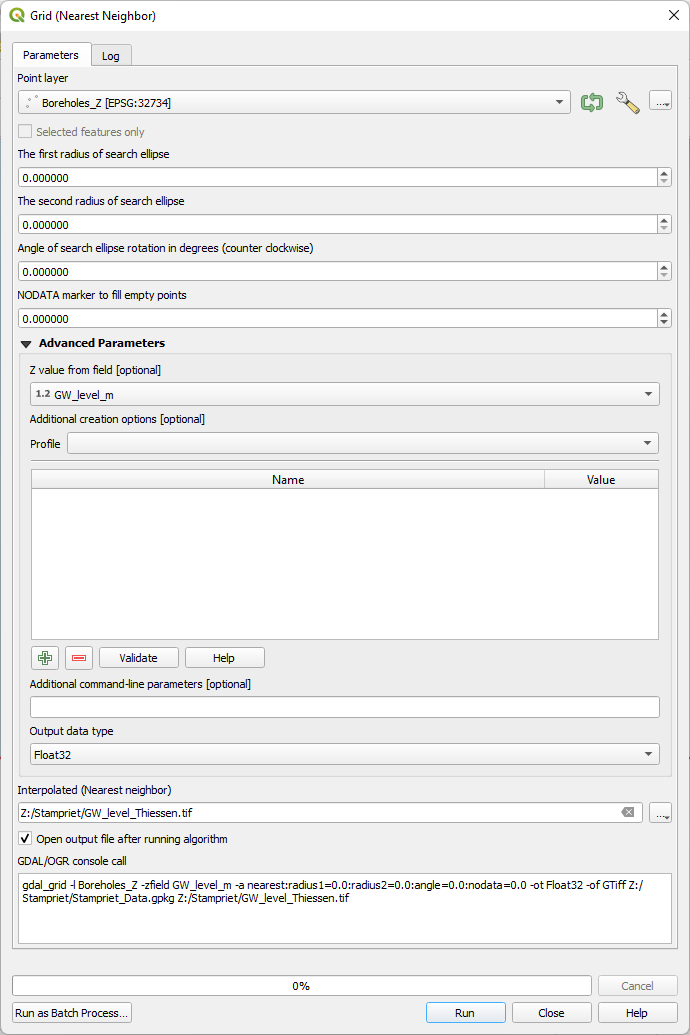
8. Click Run. Click Close to close the dialogue.
9. Style the result by copying the style from the IDW layer.
This
algorithm doesn't cover the whole study area but is limited to the so
called convex hull of the input point layer. It gives a less smooth
result then the IDW intepolation. However, with scarce data the nearest
value might be the best approximation.

In the next section we'll derive contour lines.
Note that if you want to use Thiessen polygons with control of the output extent and resolution, you can do this by adding GDAL options in the dialogue. Watch this video (optional) to see how this works: