Tutorial: Create a groundwater quality map from borehole data
4. Interpolate groundwater quality data
4.2. Thiessen polygons
The first interpolation method that we'll use is the Thiessen method. It's also known as Voronoi tesselation or nearest neighbour interpolation. It will assign the closest know value to locations without measurements. When the point density is low and you don't have any knowledge of trends, this method is preferred.
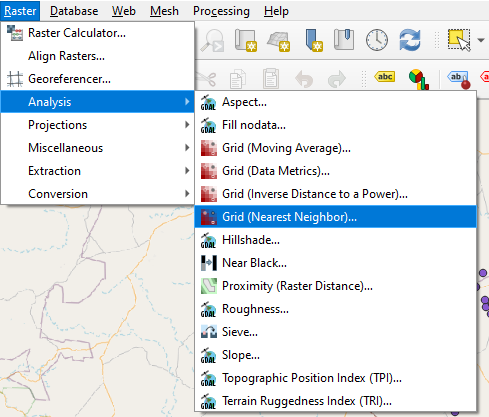
1. In the main menu of QGIS choose Raster | Analysis | Grid (Nearest Neigbor)....
2. In the Grid (Nearest Neighbor) dialog choose NO3 as the Point layer. At NODATA marker to fill empty points type -9999, otherwise it would use zeros, which are also values in our data. Scroll down and expand the Advanced Parameters section by clicking on the arrow. There choose the NO3_mg_l field at Z value from field. Keep the rest at default and save the result to NO3_Thiessen.tif in the same folder where you have the GeoPackage of this tutorial.
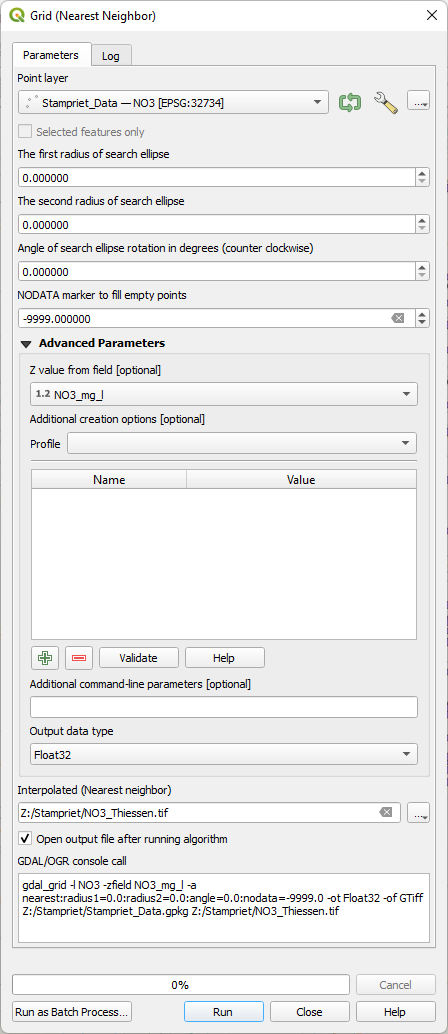
3. Click Run. Click Close after the processing has finished.
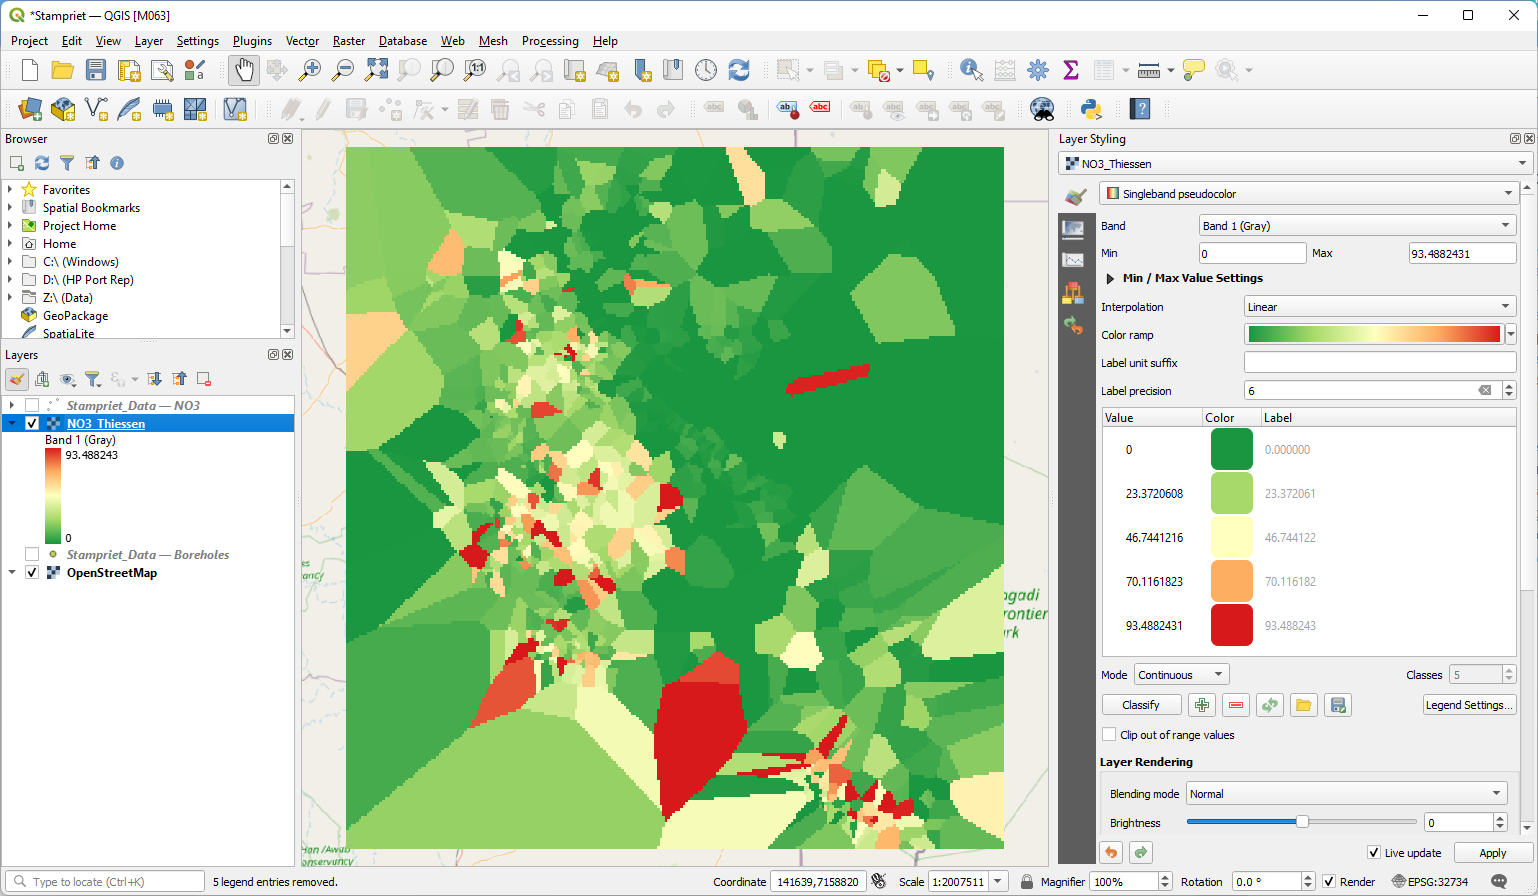
4. Change the styling of the Thiessen raster in the Layer Styling panel. Use Singleband pseudocolor, because it is a continuous raster (decimals), although it looks discrete. Choose a color ramp that is intuitive for this data.
The result should look like this:
In the next section we'll use the IDW interpolation method.