Tutorial: Create and Use Virtual Point Clouds (VPC)
6. Visualise point clouds in 2D and 3D
It's nicer to look at the RGB colours instead of the classification attribute. We can see the RGB colours again by changing some settings in the Layer Styling panel.
1. In the Layers panel, make sure that the VPC layer is selected and click  to open the Layer Styling panel.
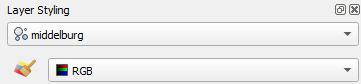
2. In the Layer Styling panel, click on the Classification renderer and change it to RGB.
You were now changing settings in the 2D styling tab .
We can also visualise point cloud layers in the 3D View.
You can change the settings for the styling in the 3D View in the 3D View  tab of the Layer Styling panel. By default it is set to Follow 2D symbology, which is okay for our purpose.
Now we're ready to visualise the point cloud in the 3D View.
3. To fill in the voids (missing points), unhide the aerial photograph layer by checking its box in the Layers panel.
4. In the main menu, select View | 3D Map Views | New 3D Map View.
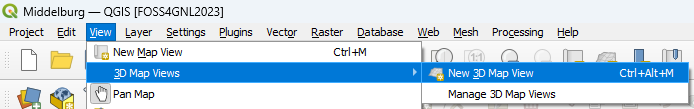
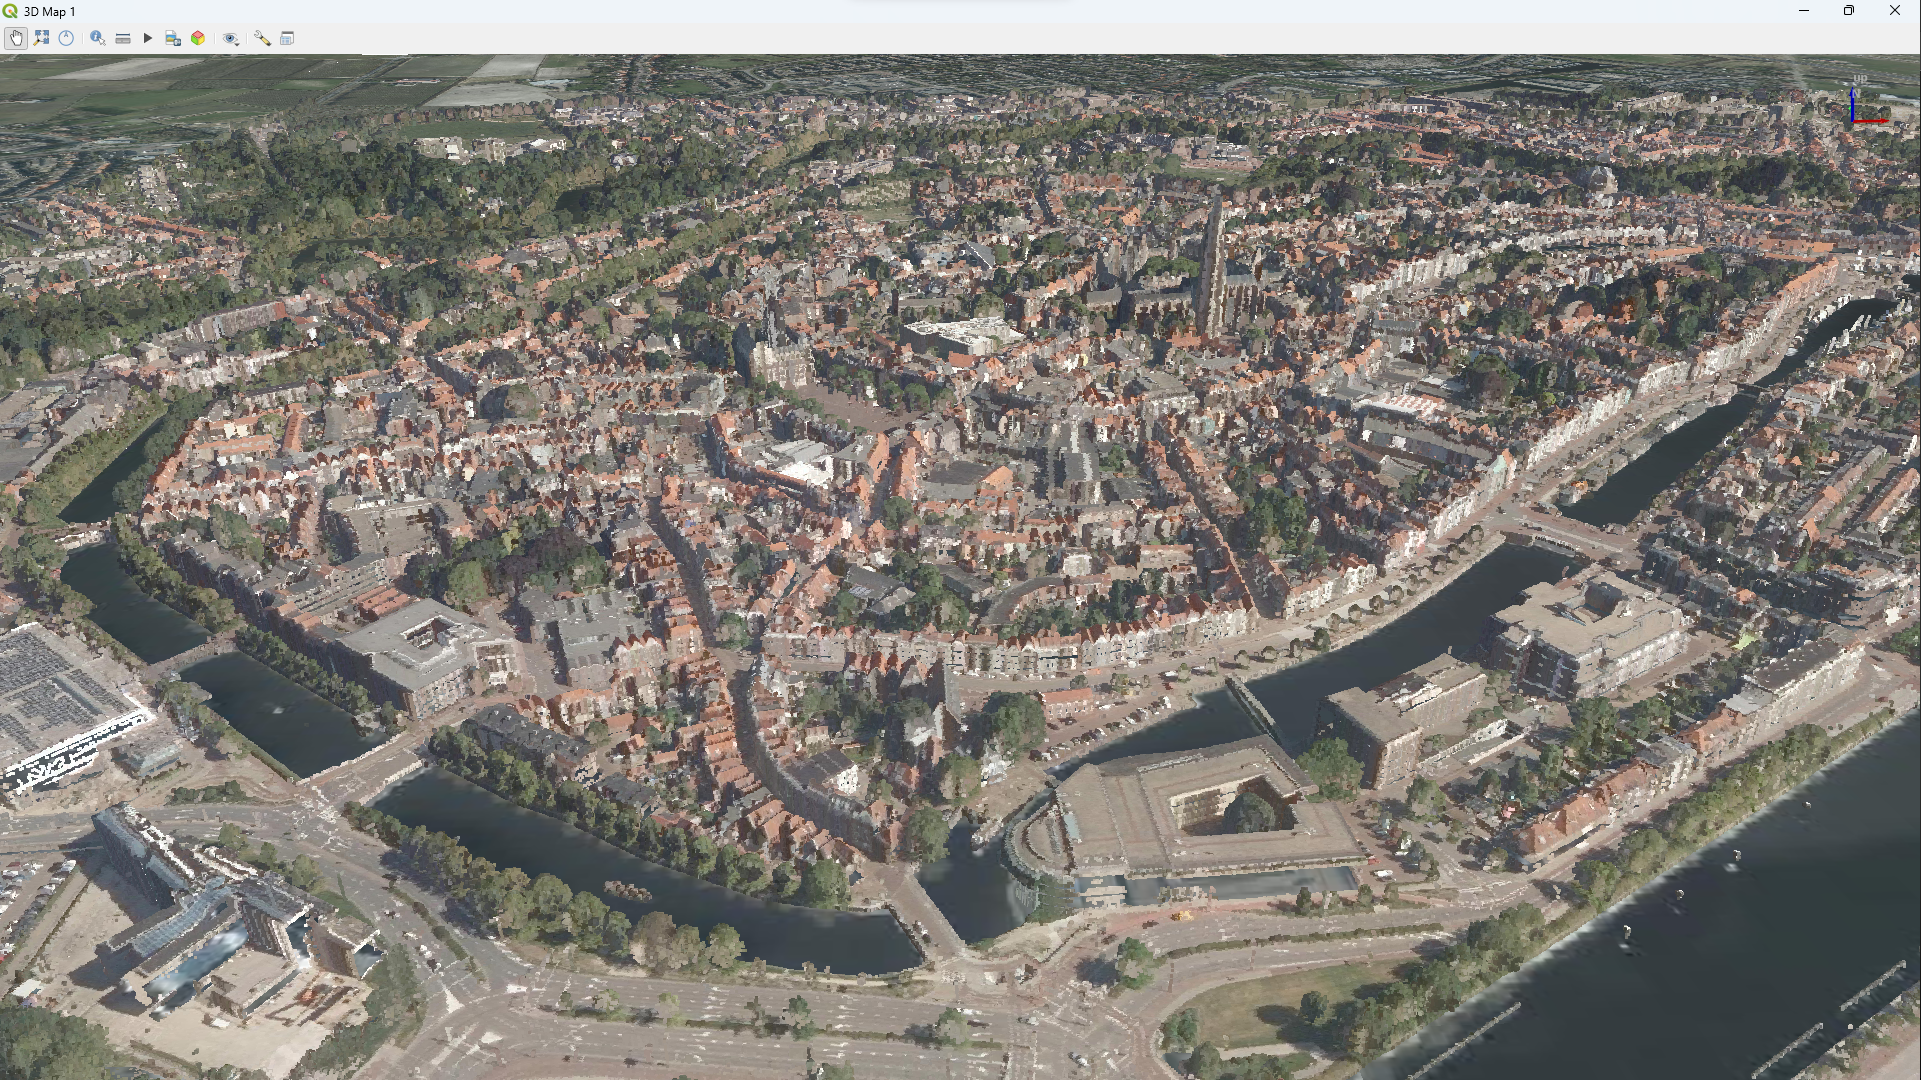
This will load a new window for the 3D view and starts rendering the point cloud layer.
By default the window will dock like other QGIS panels. However, often it's nicer to have the 3D view full screen.
5. In the 3D Map 1 window, click the  to undock the window.
6. Maximize the 3D Map 1 window.
Now you can navigate in the 3D view. You can use the compass panel on the right side of the window or try to use the mouse. Dragging the scroll wheel will tilt the scene. By dragging the left button, you can pan in all directions. By dragging the right button you can zoom in/out. If you don't need the compass, you can click  to hide the panel.
- Try to visualise other attributes in 2D and 3D by changing settings in the Layer Styling panel.
- Use the
 tool to measure heights of buildings.
 - Play with the
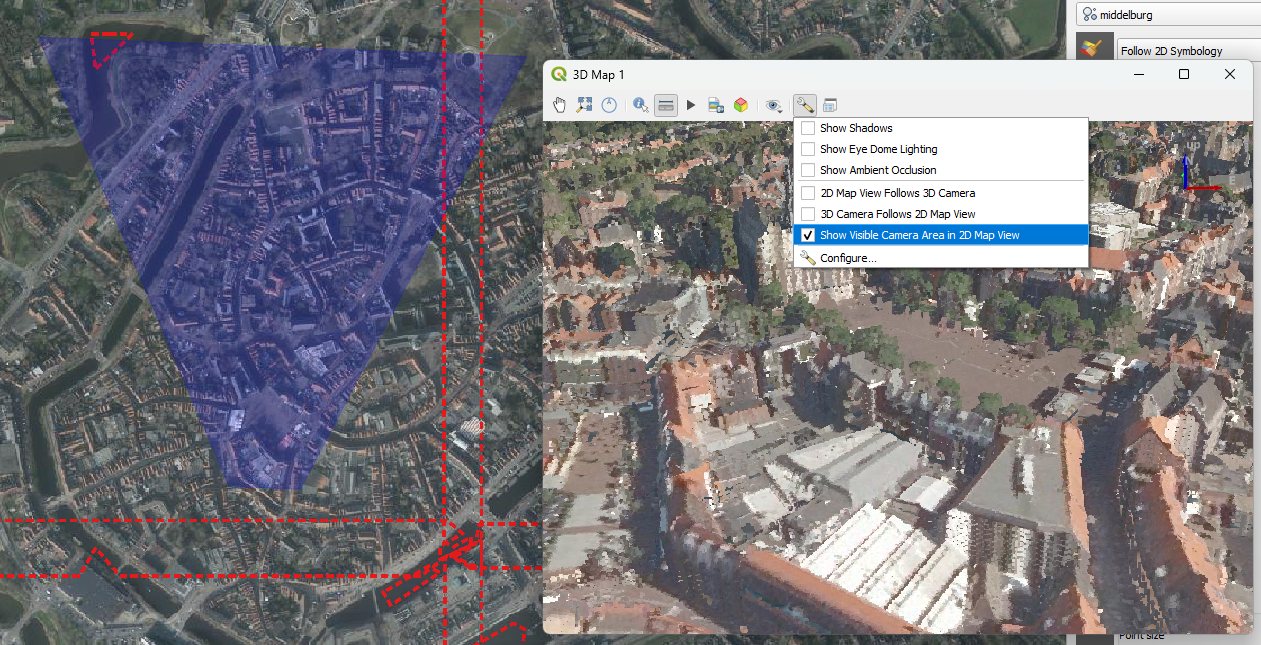
 options to visualise in the 2D map, which area is shown in the 3D View.