Tutorial: Filter Point Clouds
نیازمندیهای تکمیل
2. Check statistics of point cloud attributes
Let's first check which attributes are available that we can use for filtering the points in the point cloud layer.
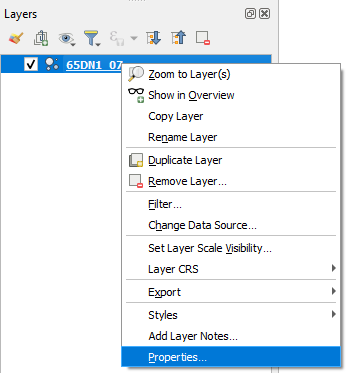
1. In the Layers panel, right-click on the point cloud layer and choose Properties... from the context menu.
2. In the Layer Properties dialog click on the Statistics tab.
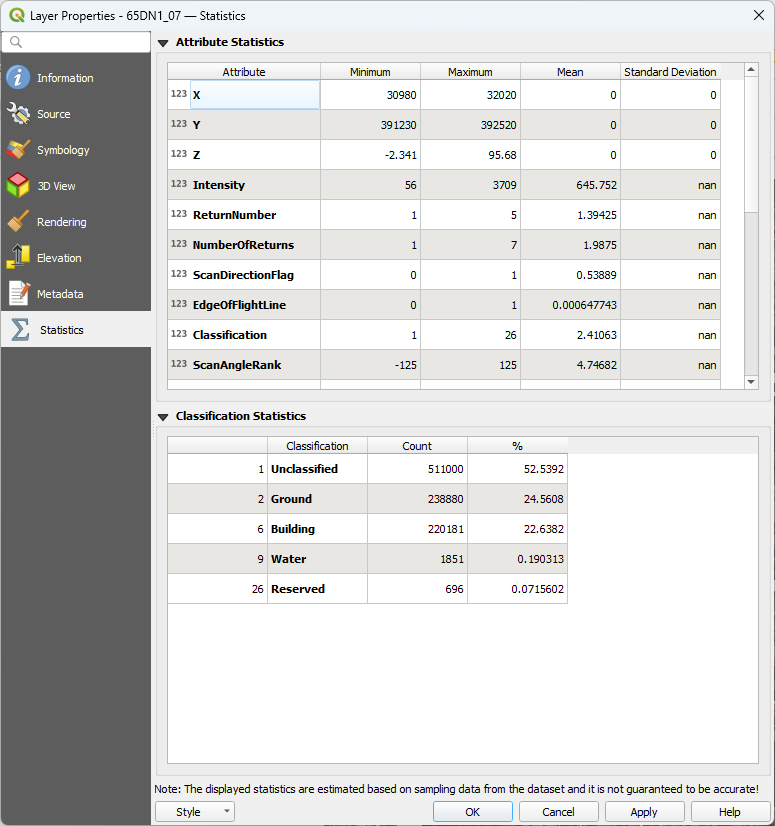
In the upper table you can see the attributes and their statistics (minimum, maximum, mean, standard deviation). In the lower table you can see the statistics for the Classification attribute. The Count column shows the amount of points in the class and the % column shows the percentage of points with that class.
| Atrribute | Description |
|---|---|
| x, y, z | Location information |
| GpsTime | The time at which the laser pulse was recorded |
| Intensity | The strength of the returned laser pulse |
| ReturnNumber | The order in which the laser pulse was returned |
| NumberOfReturns | The total number of returns for a given laser pulse |
| Classification | A code that defines the type of object that reflected the laser pulse |
| ScanAngleRank or ScanAngle | The angle at which the laser pulse was emitted from the sensor |
| RGB and Infrared | Color information for the point |
| ScanDirectionFlag | The direction in which the scanner mirror was moving when the laser pulse was emitted |
| EdgeOfFlightLine | A flag indicating whether the point is at the edge of a flight line |
| UserData | User-defined data |
| PointSourceID | An identifier for the source of the point data |
| Amplitude | Strength of the returned laser pulse |
| Reflectance | Amount of laser light that is reflected back to the sensor by the target object |
| ScannerChannel | Channel number of a LiDAR scanner |
We can use these attributes for visualisation of the point cloud data.
3. Click
 to open the Layer Styling panel.
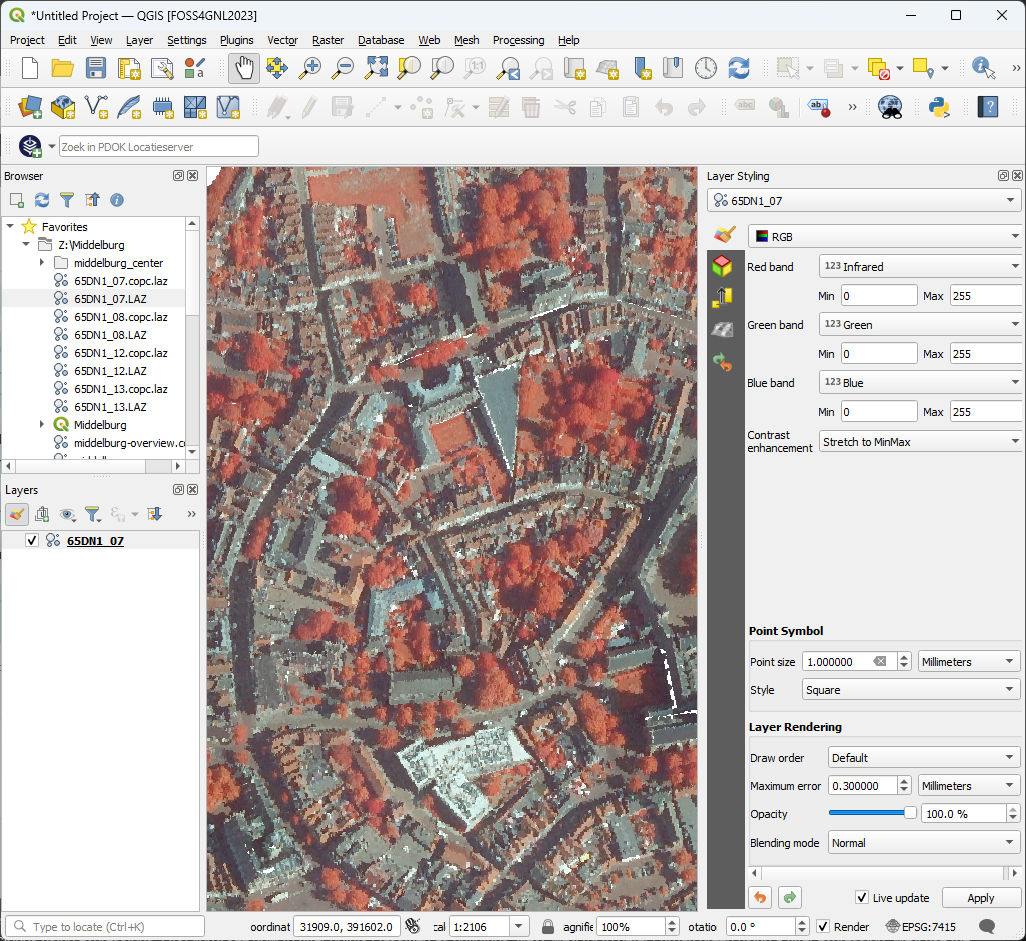
4. Make sure you see the data with the RGB renderer. Change the Red band to Infrared, keep the rest the same.
Now you can see in red the the points which represent vegetation:
5. Change the renderer to Classification.
- Which classes do you see?
- How does it correspond with the infrared visualisation of vegetation?
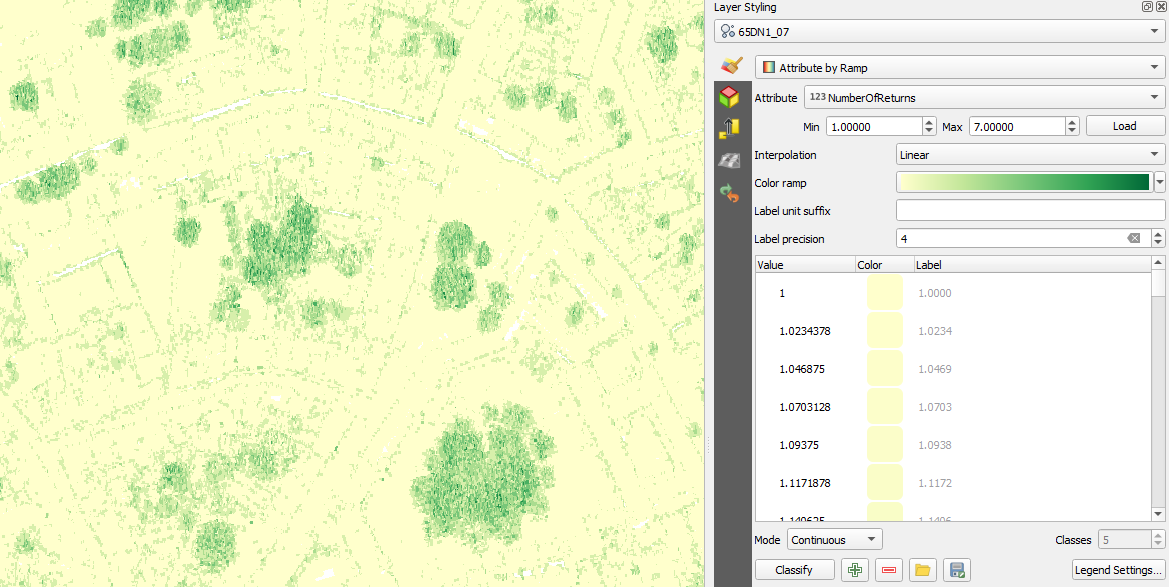
6. Change the renderer to NumberOfReturns.
7. Click the arrow at Color ramp, choose All color ramps and choose YlGn (from Yellow to Green).
- How does it correspond with the infrared visualisation of vegetation?