
Tutorial: Interpolate Point Clouds to Rasters
5. Compare the results
5.3. Compare with the Elevation Profile tool
Another way to compare the interpolation results is to use an elevation profile.
1. Close the Map 1 panel.
2. In the main menu go to View | Elevation Profile.
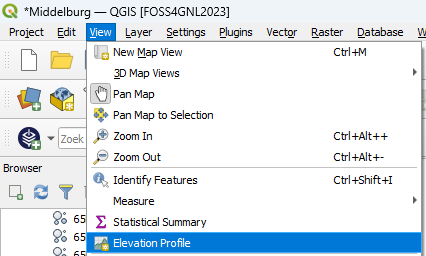
This opens the Elevation Profile panel at the bottom of the map canvas.
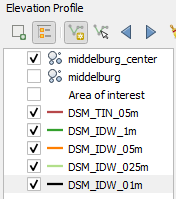
3. In the Layer tree, on the left side of the Elevation Profile panel, keep the boxes checked of the layers you want to show in the profile.
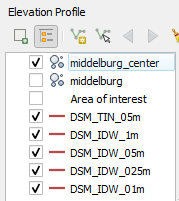
4. Now all the DSM layers have the same colour. Double-click on a line and change the colours so we can distinguish the different lines.
5. Use the Capture Curve  tool to draw a transect line on the map. Click right to end the curve.
6. Compare the different interpolation results.
Note that the VPC layers can't be used. Instead we can add one of the original tiles.
7. Add one or more of the LAZ tiles.
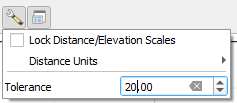
8. Check the elevation profile. Use the Options  icon to change the Tolerance. This determines the buffer around the transect that will include the points in the elevation profile.
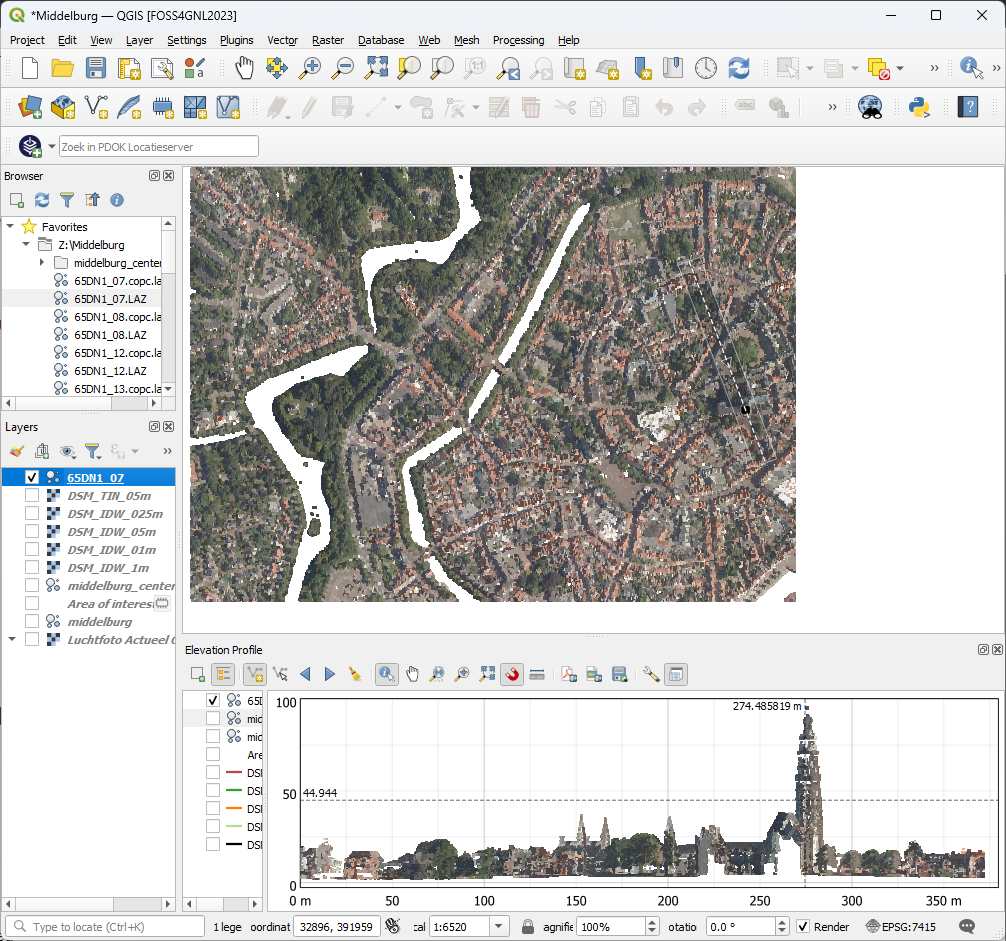
- How high is the church tower (Lange Jan)?
- Compare the points with the interpolation. Which one fits best?